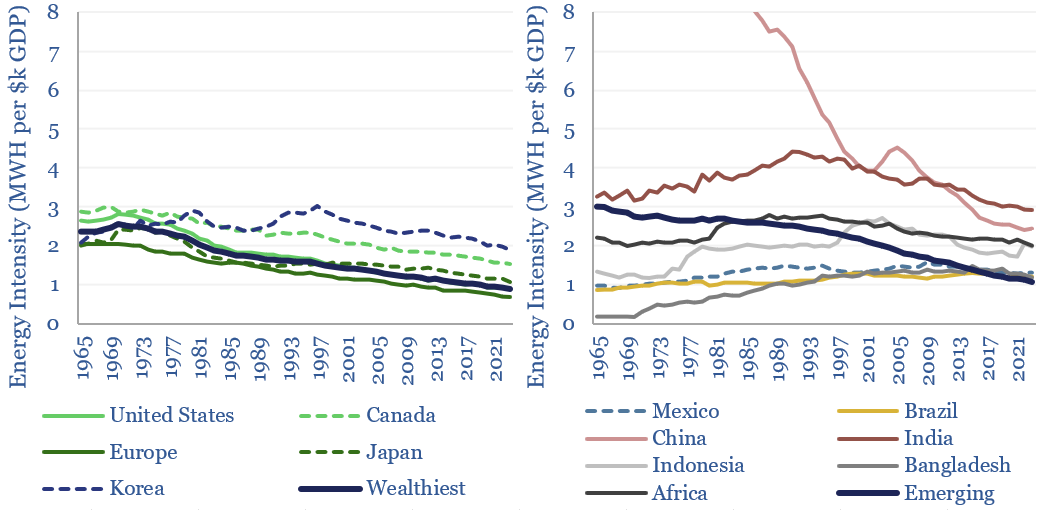
This data-file assesses energy intensity by country, across 25 countries and regions over the past 50-years, and correlated against income levels. Energy intensity of GDP of the global economy has fallen by -1.0% per annum over the past half-century and now stands at 1.8 MWH per $k of GDP. The work is discussed further here and here.
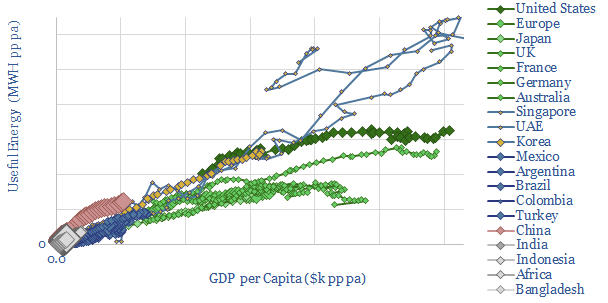
We have cross-plotted GDP per capita versus total primary energy, total useful energy, total CO2 emissions and the relative shares of coal, oil, gas, nuclear, hydro, wind, solar and other energy.
Early industrialization is most energy-intensive, as energy consumption rises 1:1 with GDP growth, mostly sourced from coal and oil.
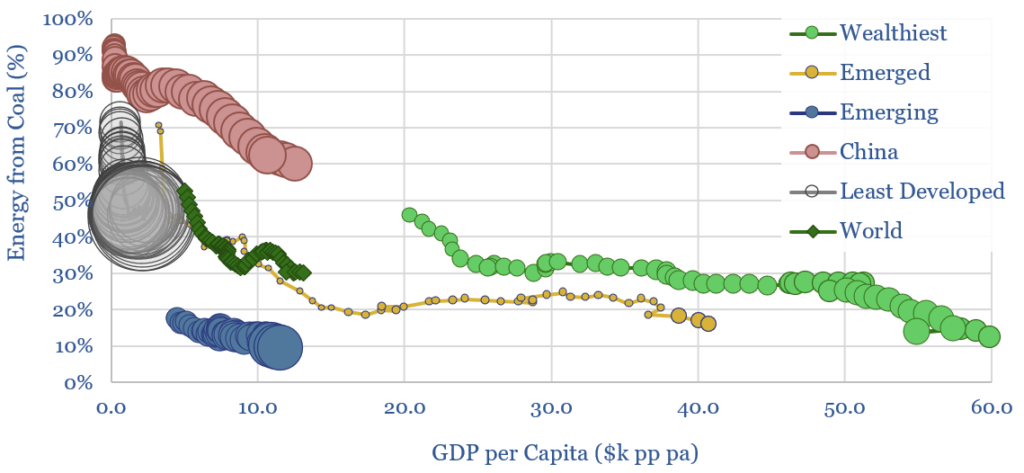
Later industrialization is less energy-intensive, with the ‘beta’ falling to 0.6-0.8% pa and $10-30k pp pa GDP. Middle-income countries start to prefer cleaner energy, especially natural gas (thus coal falls, chart below).
In developed countries, energy use per capita does seem to plateau, at around 25MWH pp pa, and this is also when decarbonization most steps up too.
Energy intensity of GDP of the global economy has fallen by -1.0% per annum over the past half-century and now stands at 1.8 MWH per $k of GDP. Some commentators in the energy transition are tempted to use ‘energy intensity of GDP’ as a proxy for ‘efficiency of the global energy system’. We explore this definition in our recent overview of global energy efficiency.
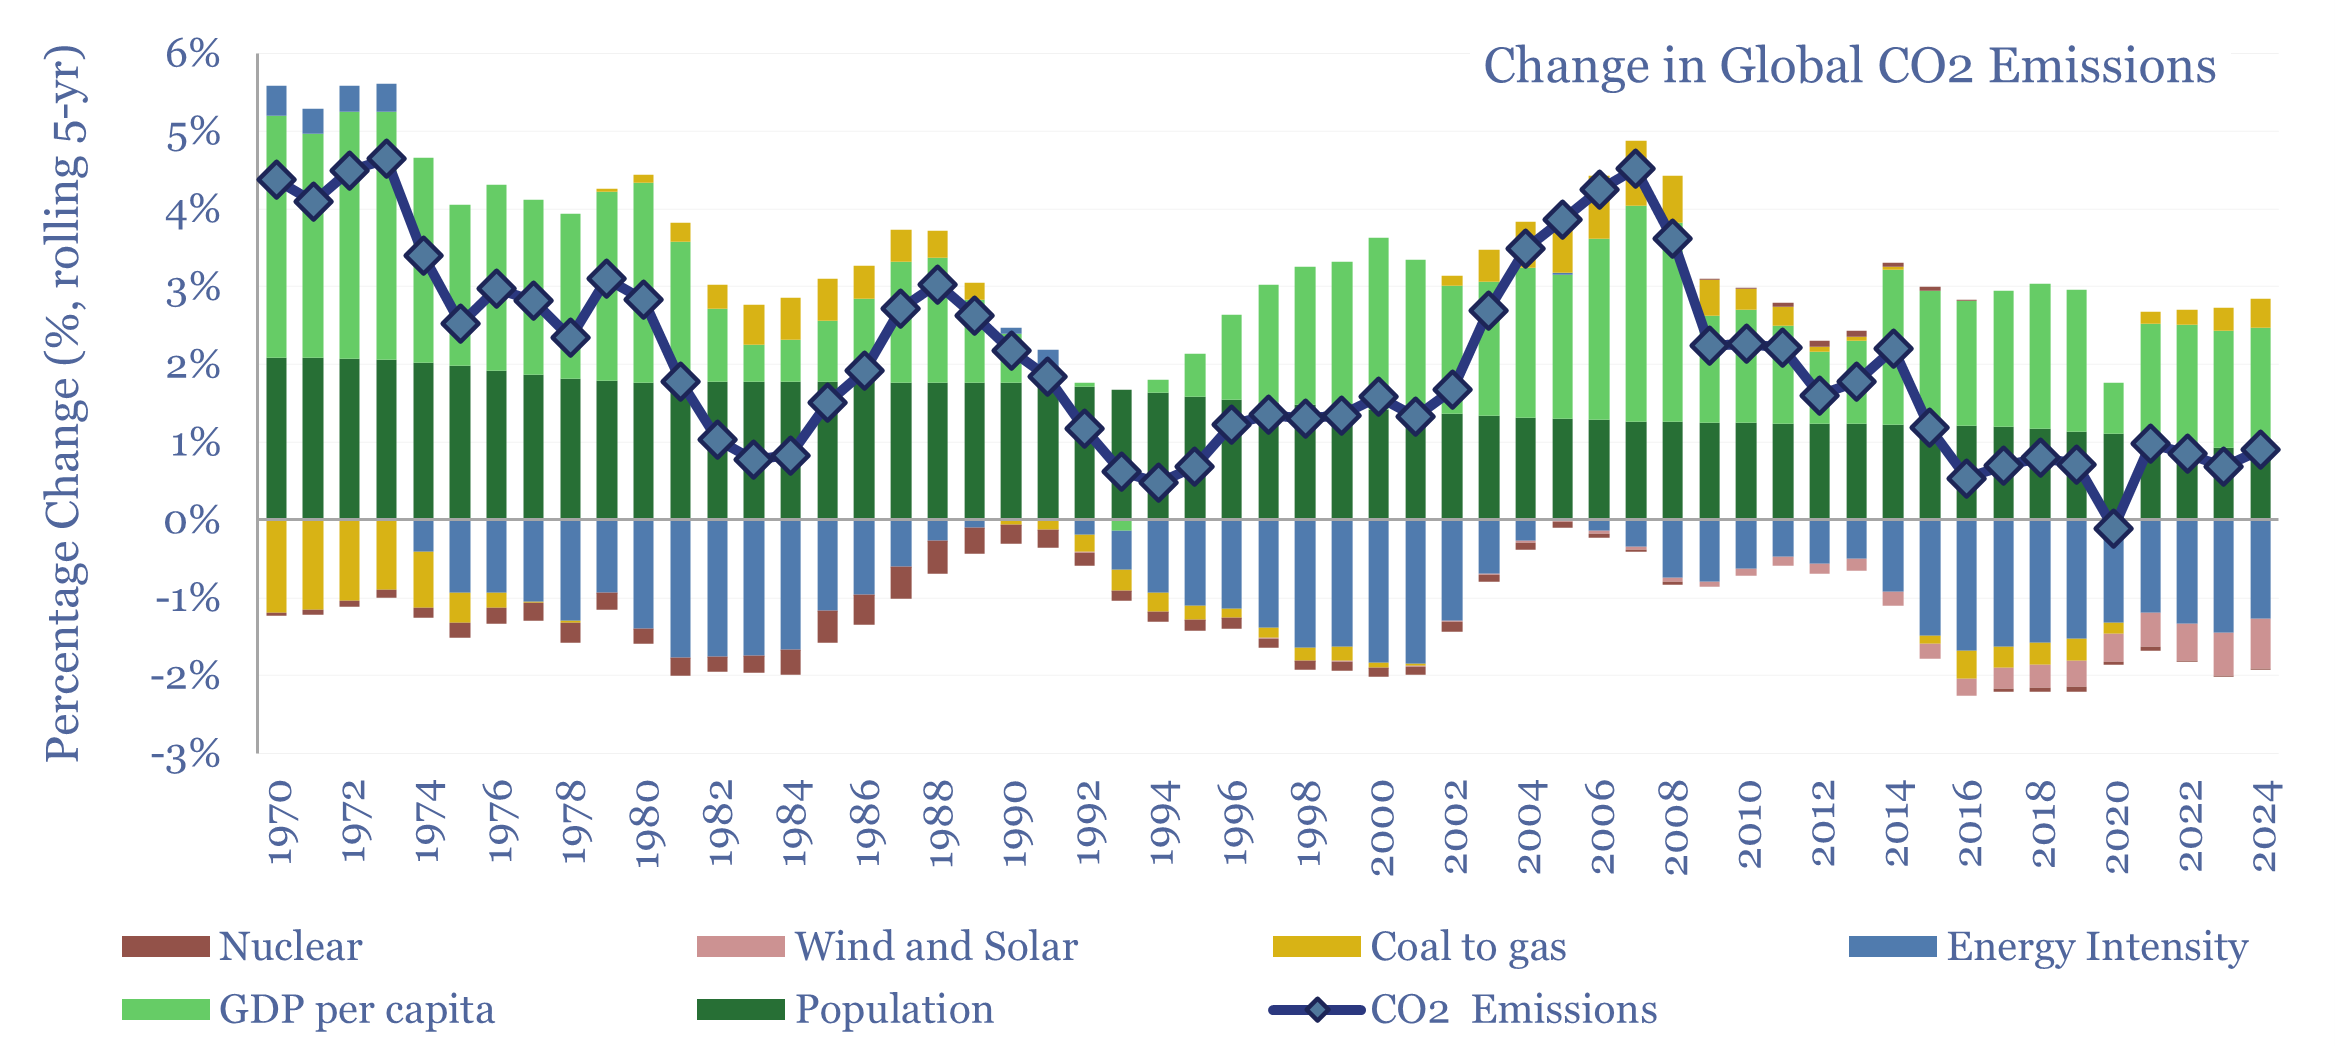
We have also used this database for a factor analysis of global CO2 emissions. Over the past five years, global CO2 emissions have risen at a +0.7% CAGR, which attributed to +1.0% pa population growth, +1.4% pa GDP per capita, -1.4% pa efficiency gains, -0.5% pa due to the ramp up of wind and solar, but +0.2% pa due to the switching back from lower-carbon to higher-carbon hydrocarbons. This same factor attribution is also built up in the data-file for the US, Europe, UK, Japan, Australia, Canada, LatAm countries, China, India, other Asian economies, Africa, and “the emerging world” in aggregate.
Note: the last data points in this file are 2020, intended mainly as a record of historical trends into energy intensity by country type, rather than as a tracker of recent energy demand which can be found in our other energy market models.
The data-file was last updated in July-2025, to add 2024 full year data. The latest data-points are available by downloading the file.