
Global gas prices by country are often measured at the world-famous delivery points for liquids futures contracts, such as Henry Hub and the Netherlands’ TTF. This data-file takes a broader approach, aggregating the annual gas prices by country across twenty geographies.
Covered countries include Argentina, Australia, Brazil, Canada, China, Colombia, Egypt, India, Japan, Kazakhstan, Nigeria, Oman, Qatar, Russia, Saudi Arabia, Singapore, Trinidad, the UAE, the United States and the European region.
Taking a straight-line average, wholesale global gas prices averaged $4/mcf in 2016-19, with an interquartile range of $2-6/mcf, or in other words, a period of exceptionally low and stable gas prices.
Conversely, 2021-22 saw gas prices rise, but most of all, it is the dispersion in gas prices between different countries that has risen most, reaching all-time records well above $35/mcf in 2022.
Finally, in 2024, even after the irregularities of 2022 had moderated, gas price dispersion remained 50% higher than the 2016-19 period, with an inter-quartile range of $2-8/mcf, and rising particularly at the higher end of the market.
Although the lower end of the market has also seen somewhat higher gas prices, possibly linked to mild-moderate signs of resource maturation in shale?
There were still half a dozen countries enjoying sub-$2.5/mcf wholesale gas in 2024. We have discussed some implications of this trend in our recent research note here, but mainly the work is constructive for LNG activity.
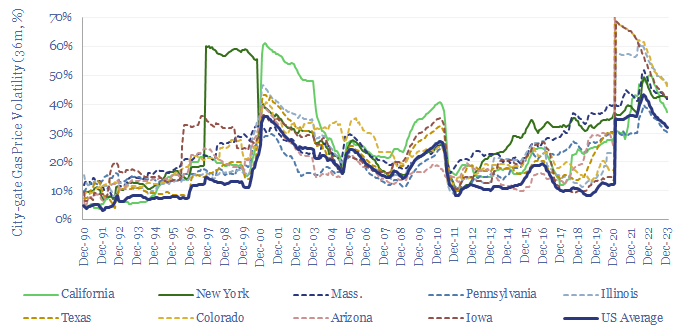
By 2023, average gas prices had moderated to $6/mcf globally, but the inter-quartile range remains elevated at $2-10/mcf. There are also signs of structurally higher volatility, both between geographies and within geographies, such as specific markets in the US (chart below).
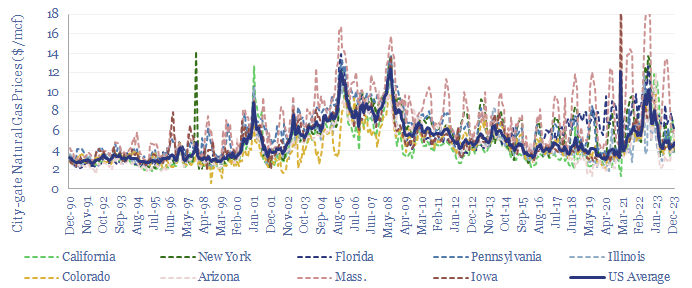
Specifically in the US, the volatility of city-gate gas prices steadily declined in the 2000s, and has been steadily increasing since the 2010s. The increases were most pronounced in gas-importing regions, which have also added large quantities of renewables.
Headline statistics on global gas prices by country are calculated in $/mcf in the data-file: including averages, standard deviations, standard errors, ranges and inter-quartile ranges. Further conclusions feature in our natural gas research and energy transition research.