Power grids will be the biggest bottleneck in the energy transition, according to this 18-page report. Tensions have been building for a decade. They are invisible unless you are looking. And power grid bottlenecks could last a decade. Further acceleration of renewables may be thwarted. And we are re-thinking grid back-ups.
Power grid bottlenecks remind us weirdly of the US housing market in 2007-08. Capable of world-changing economic upheaval. Imbalances have been building for a decade. But they are invisible unless you are looking. So where should we be looking and what will we find?
In the most likely route to net zero by 2050, global electricity demand would grow by 2.5x, transmission and distribution miles grow by 3-5x and global grid capex rises by 5x. Charts and numbers are on pages 2-4. But will this actually happen?
The functioning of low-voltage distribution network is discussed on pages 5-6. We predict what might indicate distribution network bottlenecks. And these indicators are starting to look worrying.
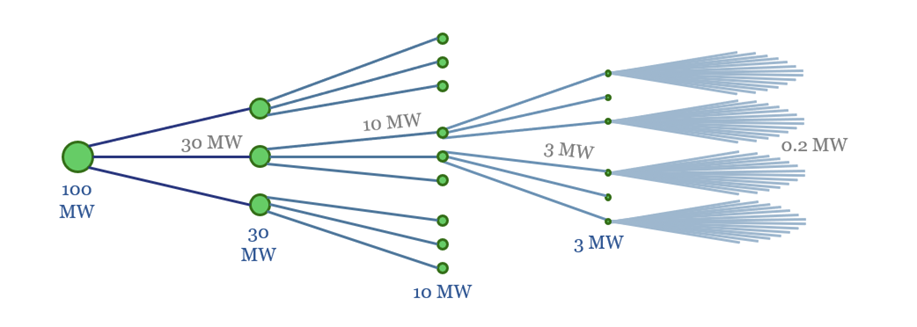
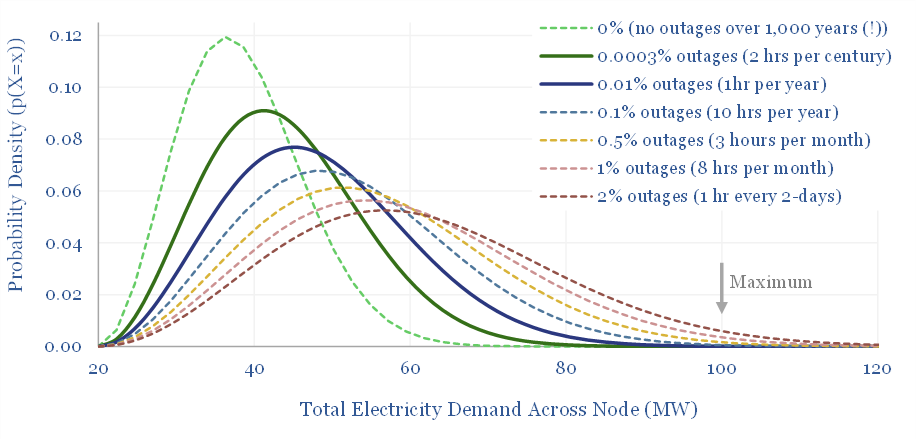
The capacities of individual grid nodes are modelled on pages 7-8, using a modified Maxwell-Boltzmann distribution. We predict what would be the most likely indicator for grid node bottlenecks. These indicators are increasing, but not exponentially.
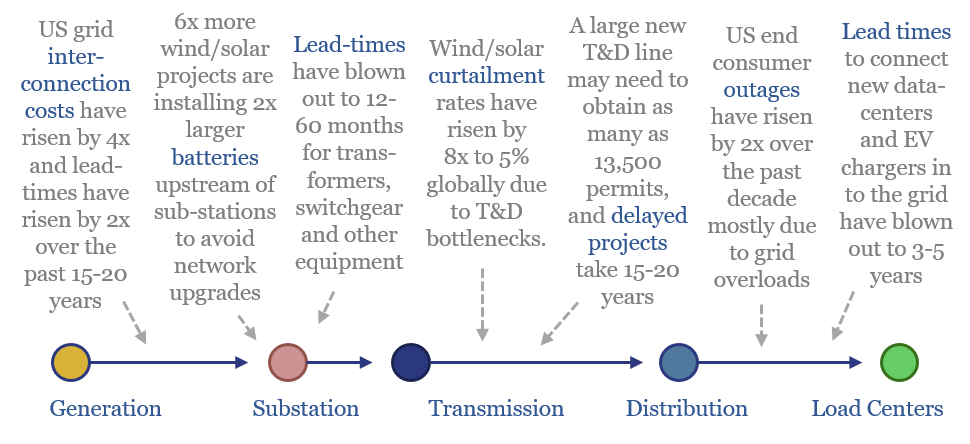
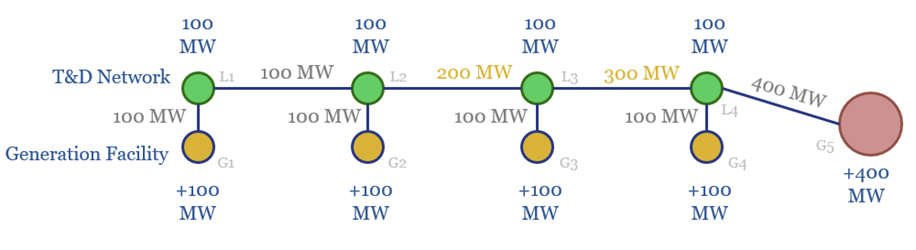
The functioning of the high-voltage transmission network is discussed on pages 9-12. The crucial conclusion is that interconnecting large new loads — wind, solar, data-centers, electric vehicles, etc — pulls on the entire network, not just the point of interconnection.
Indicators for transmission network bottlenecks include renewables curtailment rates (page 13), interconnection costs (page 14), interconnection timelines (page 15) and attempts to circumvent network costs by co-developing renewables plus batteries (page 16).
The evidence in this note suggests bottlenecks have slowly been building up over the past ten years. Some indicators of grid bottlenecks are ‘going exponential’ in 2024. Implications for batteries, load-shifting, natural gas and even diesel gensets are on pages 17-18.
Some topics in our research have tended to seem so large and far-reaching that we have struggled to capture all of the implications in a concise 18-page note. If you are a TSE client and would like to discuss this report, then please do contact us.