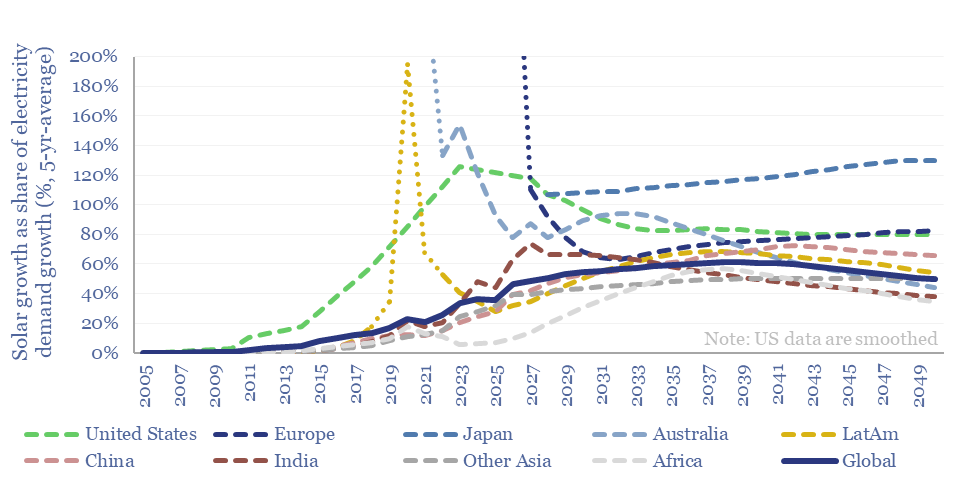
How much new solar can the world absorb in a given year? And are core markets such as the US now maturing? This 15-page note refines our forecasts for global solar additions using a new methodology. Annual solar adds will likely plateau at 50-100% of total electricity demand growth in most regions. What implications and adaptation strategies?
Solar is the new energy source that excites us most, with potential to abate 11 GTpa of CO2 emissions by 2050 in our roadmap to net zero, ramping 18x from 2022, to supply 25,000 TWH of useful energy in 2050, or 20% of total global useful energy. But how much can solar grow?
The answer hinges on relative costs. When global electricity demand is growing, then as a general rule, new sources of electricity generation will be constructed in order to meet this increasing demand. The relevant comparison is the LCOE of constructing new solar versus the LCOE of constructing new wind, hydro, nuclear, gas, coal, biomass, diesel gensets and geothermal (as discussed on page 3).
However, when solar growth starts exceeding total electricity demand growth, then new solar is no longer competing with new coal, gas, etc. It is competing with the cost of simply fuelling pre-existing power plants. These economics are much more demanding (pages 4-5).
Hence global solar additions will likely face new challenges when solar growth exceeds total electricity demand growth. We discuss this issue, country by country, across China, India, the broader emerging world, the US, Europe, Japan, Canada and Australia. The most interesting market is US solar, because it is now maturing? (pages 6-7).
What implications and adaptation strategies? We can see three pragmatic options for the solar industry, as 40% of the global solar market is now concentrated in more mature markets. Implications and recommendations are on pages 8-10.
Electrification initiatives and power grid expansions would seem to be the most important bottlenecks for global solar additions to continue accelerating from here. This is because we are increasingly tempted to model solar additions by country by multiplying total electricity demand growth x share of demand growth met by solar (pages 11-12).
A new methodology for modeling global solar additions by country and by region is captured in our wind and solar capacity additions model. Key outputs from the model, including our solar forecasts for 2024, 2025, 2026 and beyond, are described on pages 13-15.

