Written Research
-
Oil pipelines: unchoke the chokepoints?
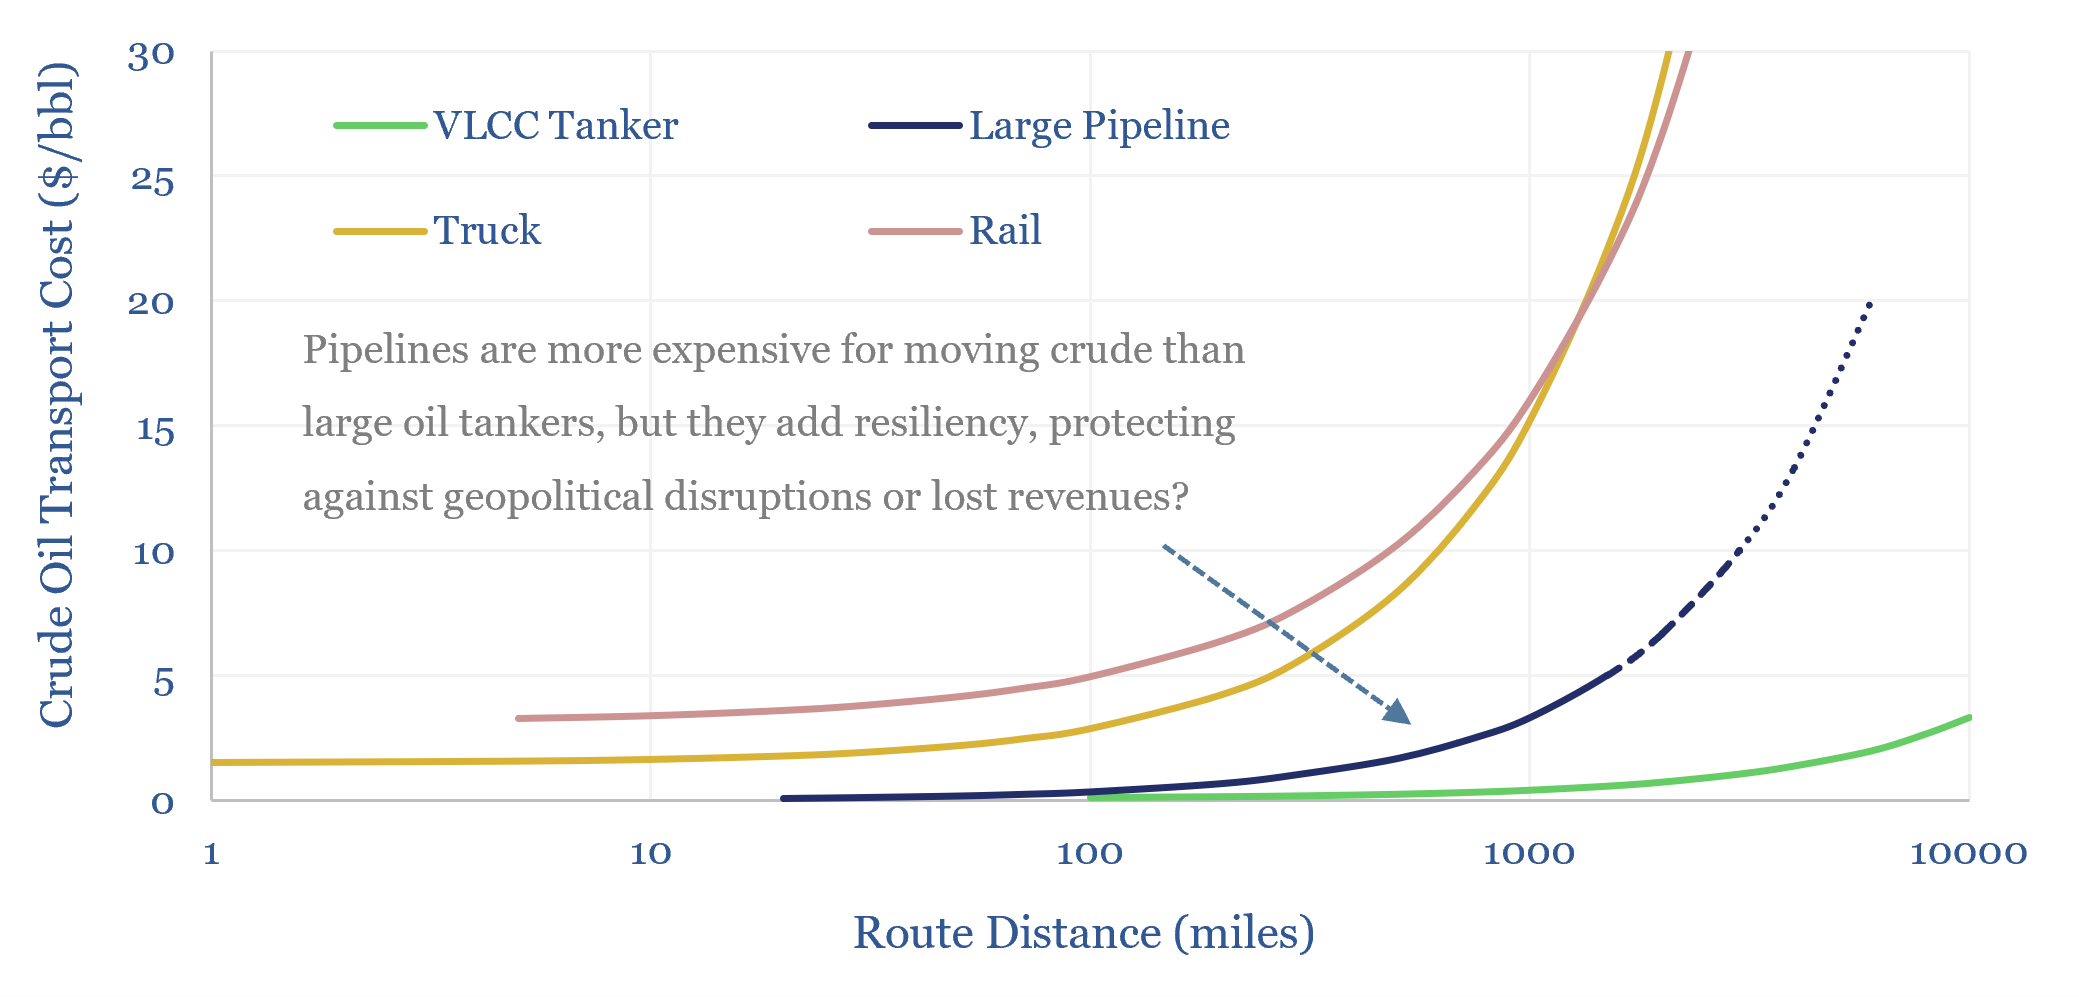
Will 2026’s disruption in the Strait of Hormuz leave a lasting aversion to chokepoints, and thus unleash a building boom for $5-25bn pipeline projects, in the Middle East, Canada and beyond? This 15-page report evaluates pipeline costs, resiliency benefits, and screens the supply chain on 25 past pipeline projects.
-
Inertial measurement units: force to reckon with?
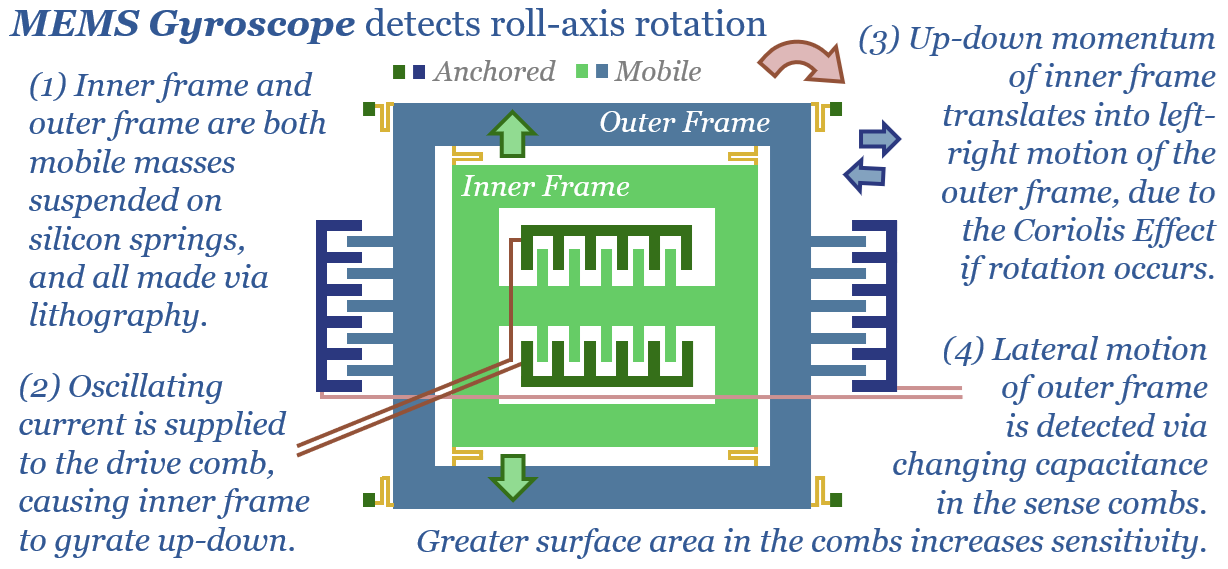
Inertial Measurement Units (IMUs) comprise accelerometers, gyroscopes and possibly magnetometers. These sensors tell you how far/fast you are traveling, and in which direction. The market is $30bn pa and expands to $80bn by 2035, due to the rise of physical AI. This 14-page report is our overview and covers leading sensor companies.
-
Global hydrocarbon resources: across the history of the world?
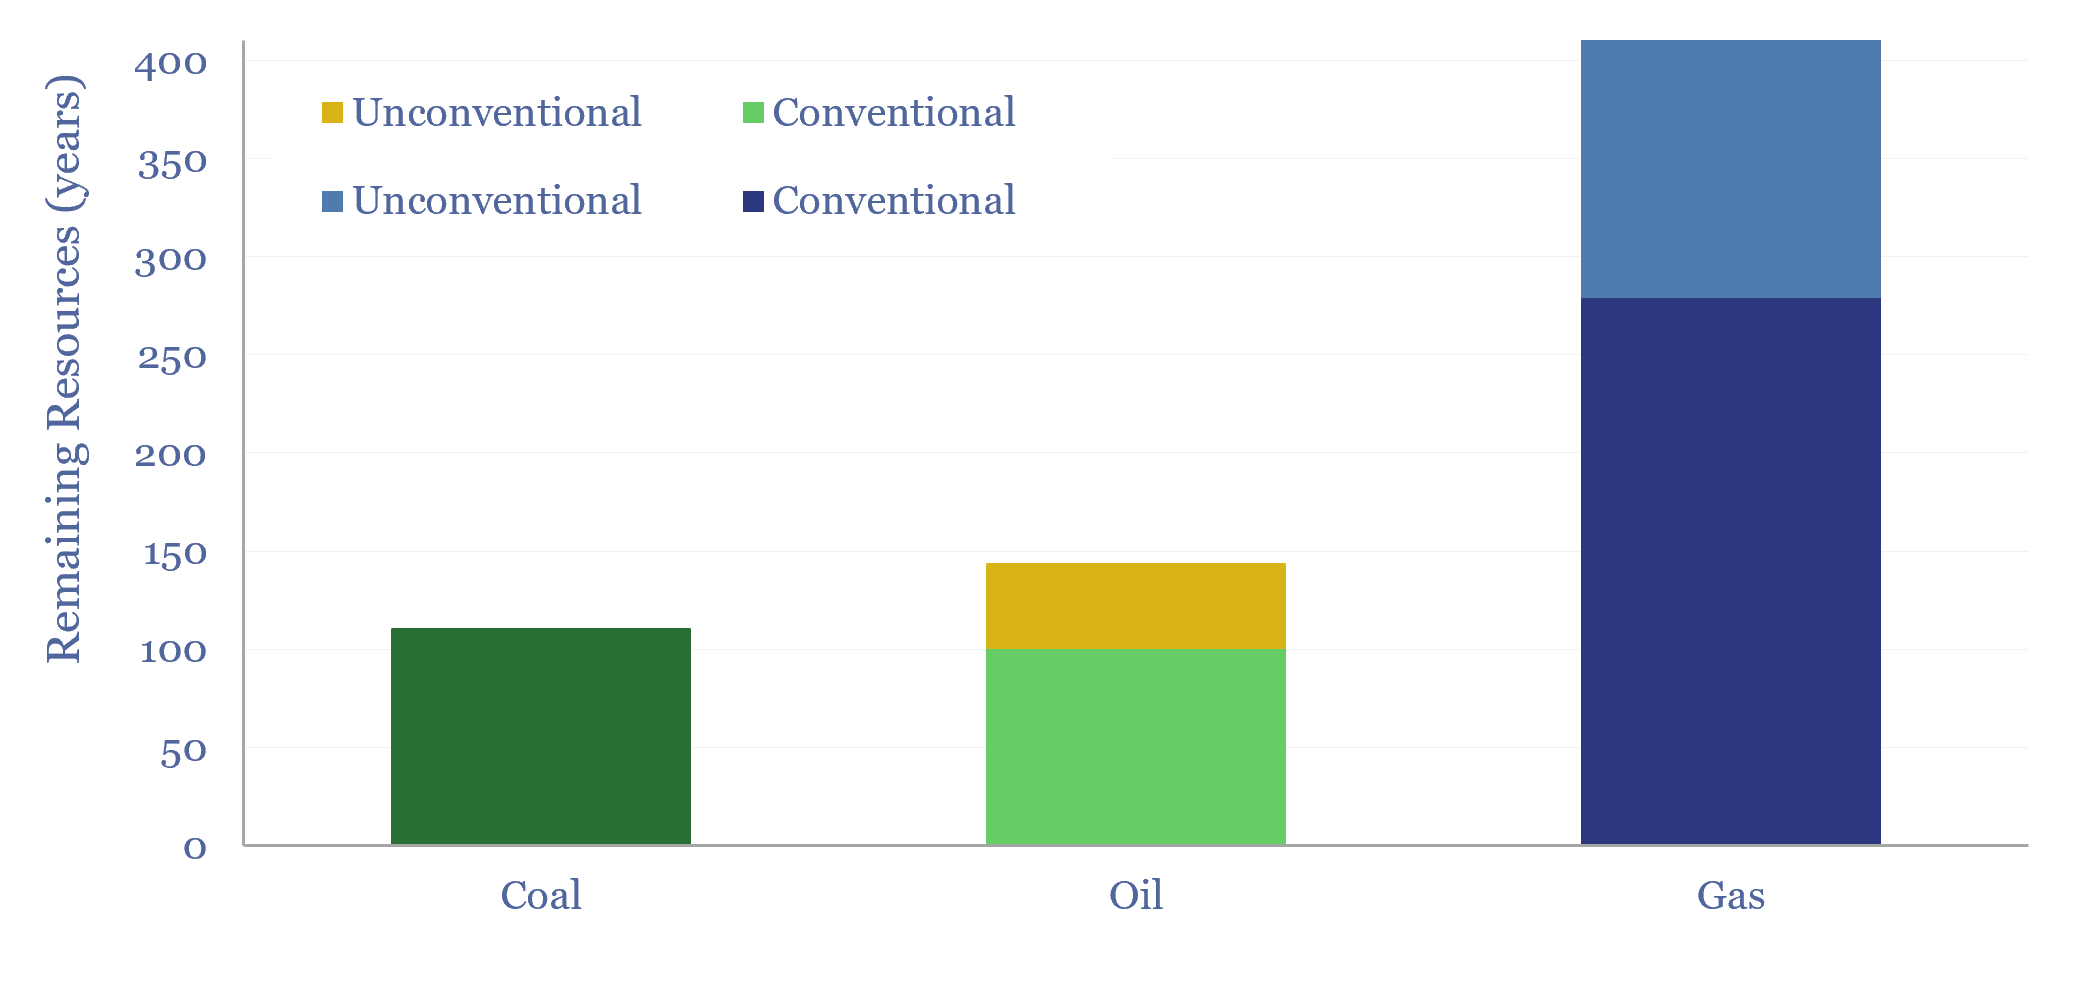
We have quantified global hydrocarbon resources, from first principles, in this 15-page report. We estimate how much oil, gas and coal ever formed across the total history of the world. And more importantly, we estimate how much is left. Our numbers support an energy transition from coal to gas.
-
Ten themes for energy in 2H26
This 12-page report looks back at all of our research from the past year, to draw out our top ten conclusions in energy, industrials and materials. Energy volatility buoys solar and batteries. The ‘AI energy transition’ boosts the physical AI ecosystem more than the data center ecosystem?
-
Delivery drones: flight trajectory?
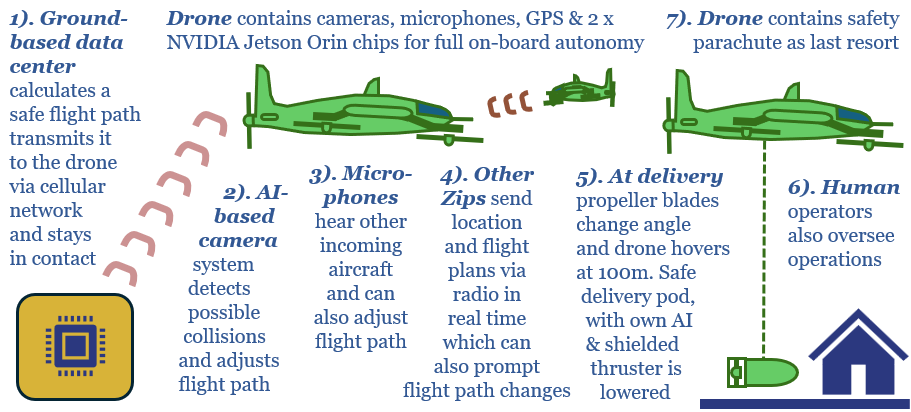
Delivery drones are finally taking off? Pilot projects in the US are achieving strong safety records, exciting consumers and raising the prospect of sub-$1 deliveries within 10-minutes. This 13-page report explores the future impacts of delivery drones in energy, materials and capital goods.
-
Electrical service agreements: how real are those data centers?
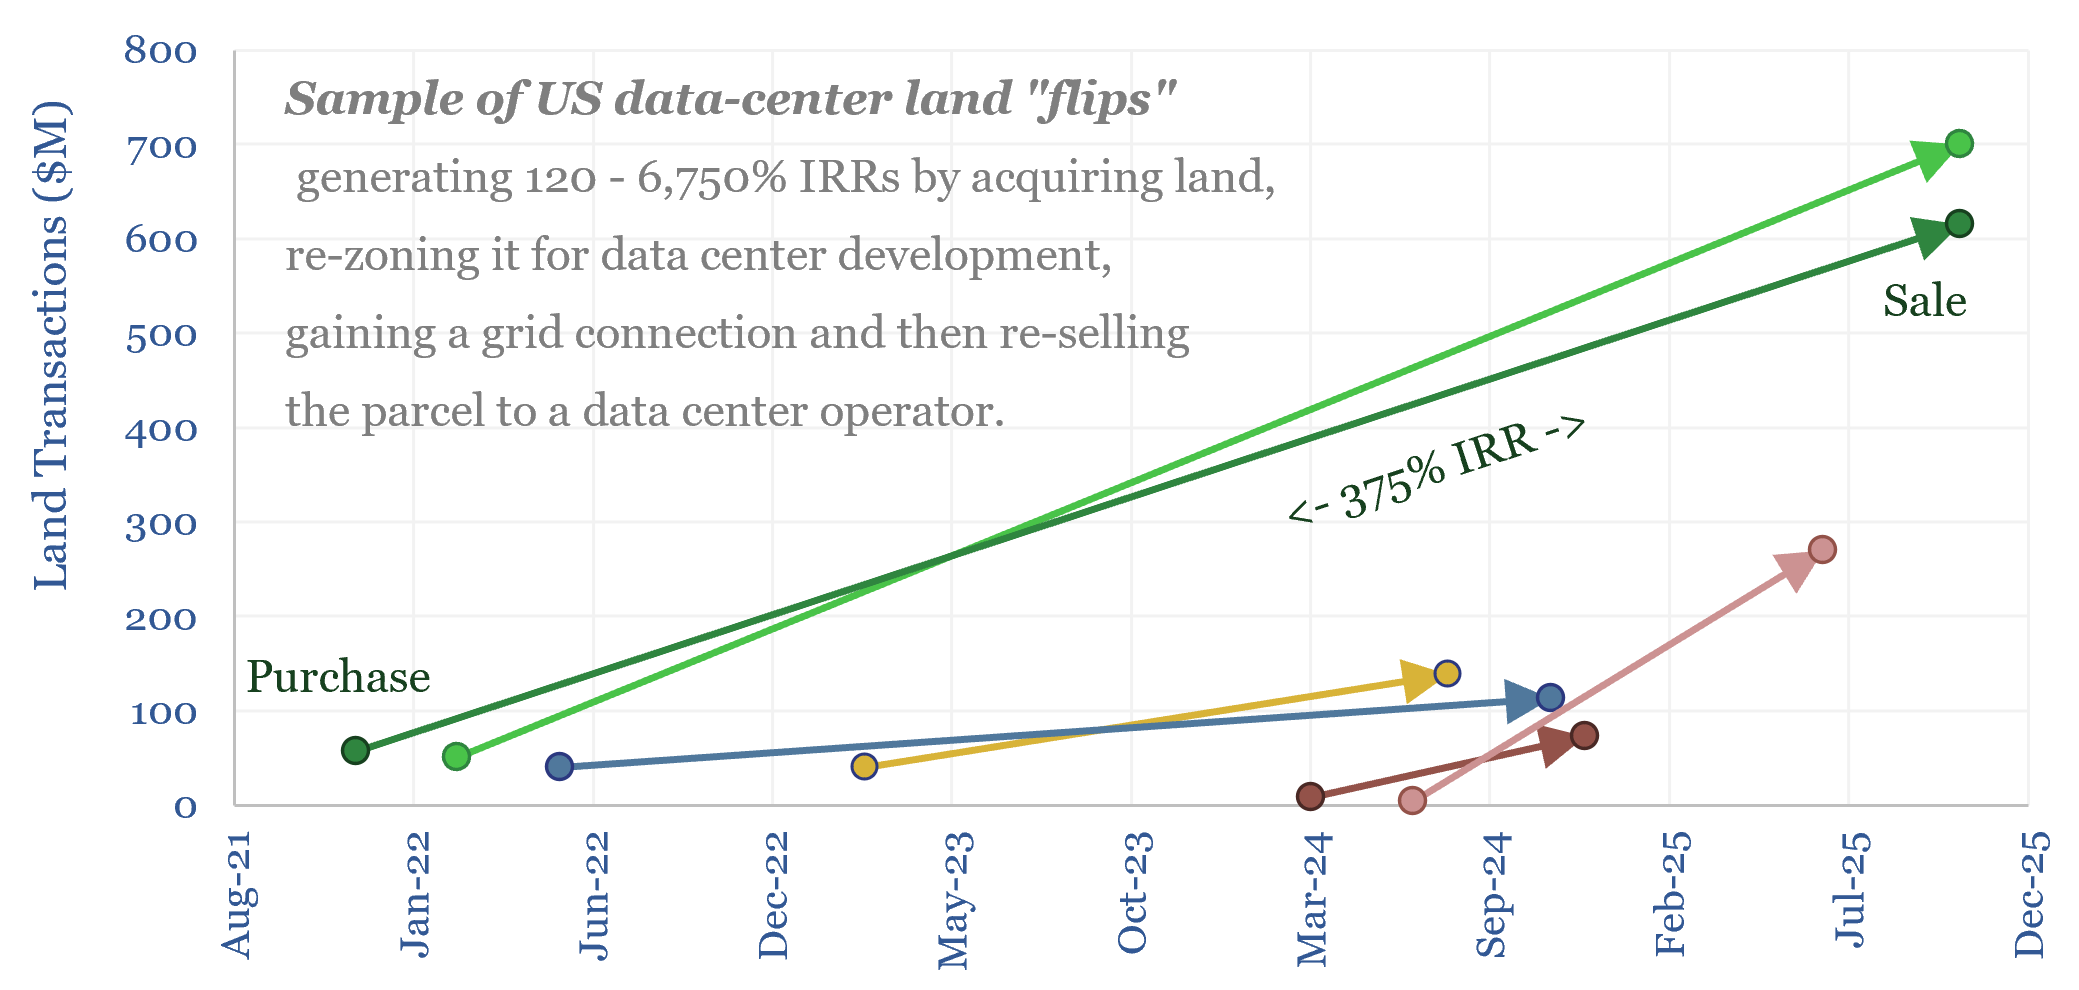
Are speculative data center projects, 80% of which will never get built, inflating future load growth forecasts? This 18-page report reviews evidence from land developer returns, recent PUC deliberations and evolving terms in Electrical Service Agreements (ESAs).
-
Sodium ion batteries: comparing costs versus LFP?
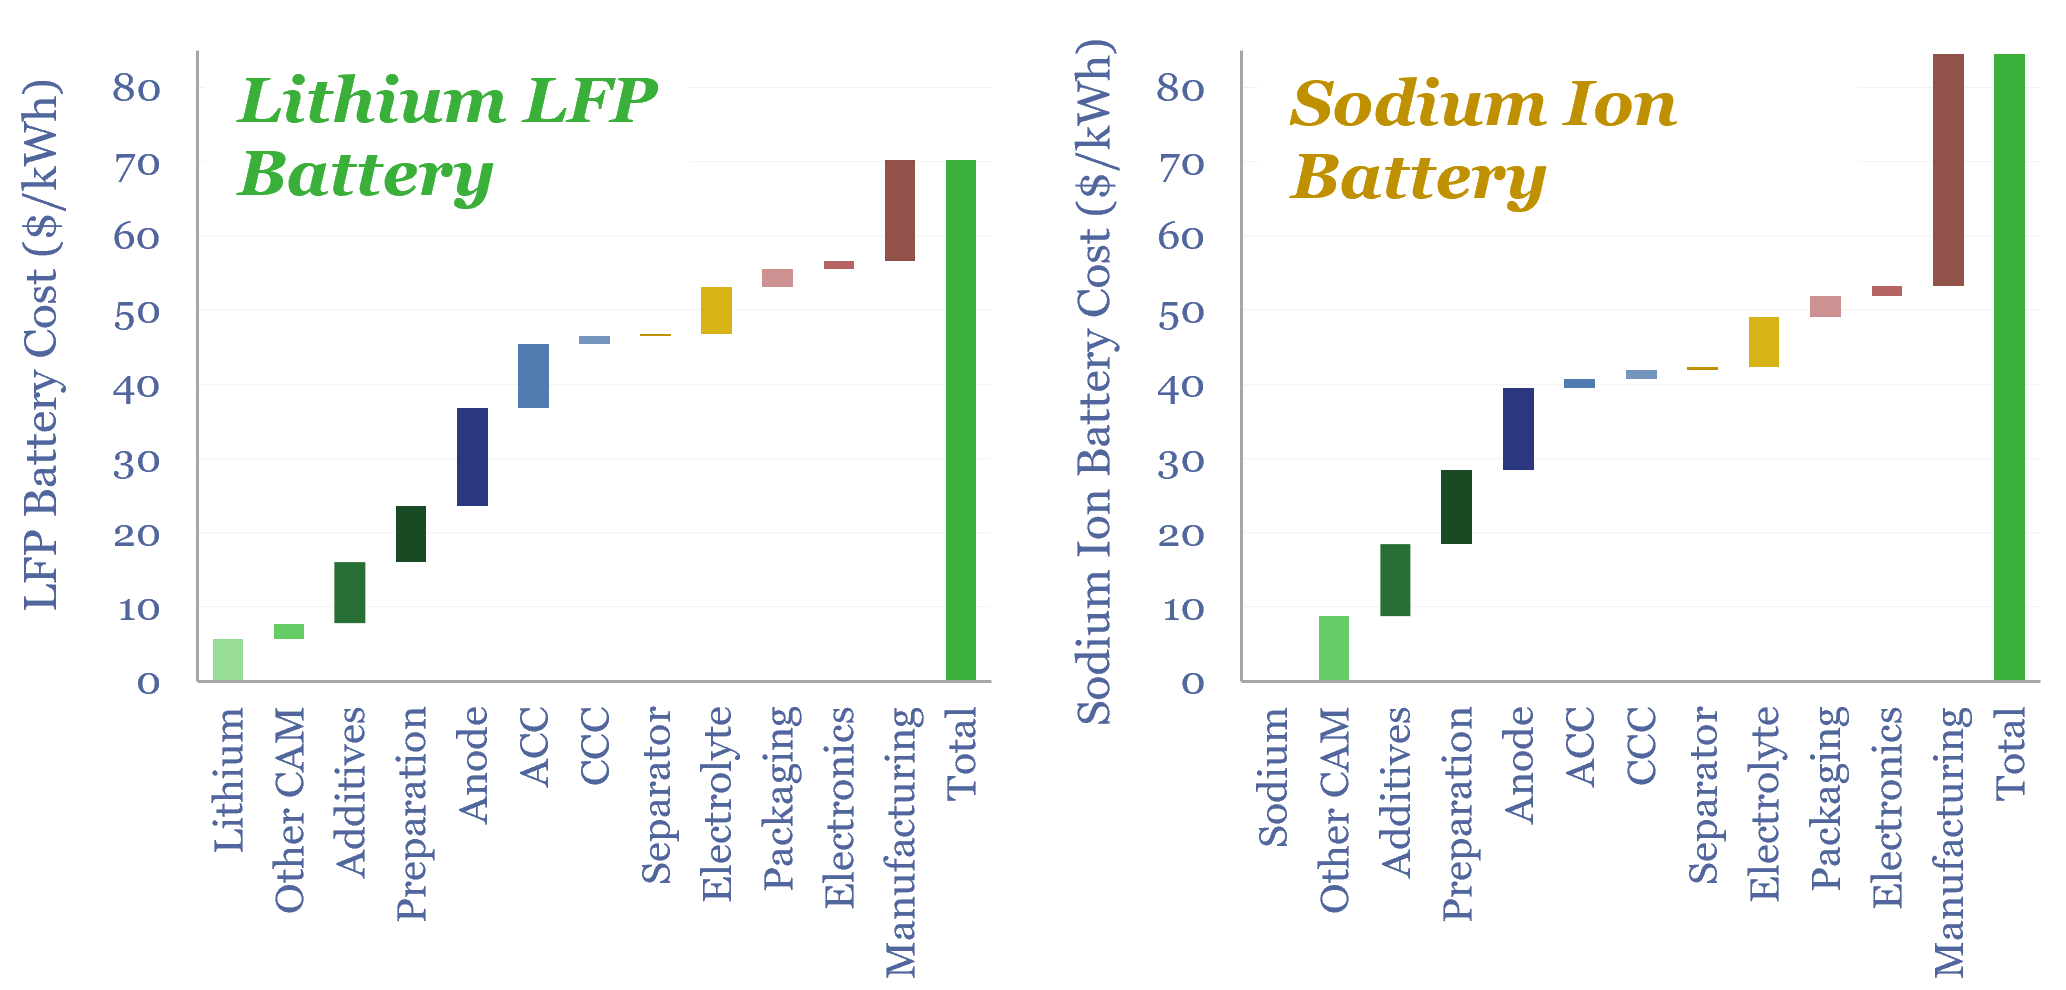
Sodium is 1,000x more abundant than lithium in the Earth’s crust and 99% cheaper. So will sodium ion batteries disrupt lithium ion batteries? Not until lithium carbonate prices treble to $40/kg. Or novel SIB electrode materials emerge. This 16-page SIB deep-dive de-risks our lithium market outlook.
-
Could thermoelectric materials change the world?
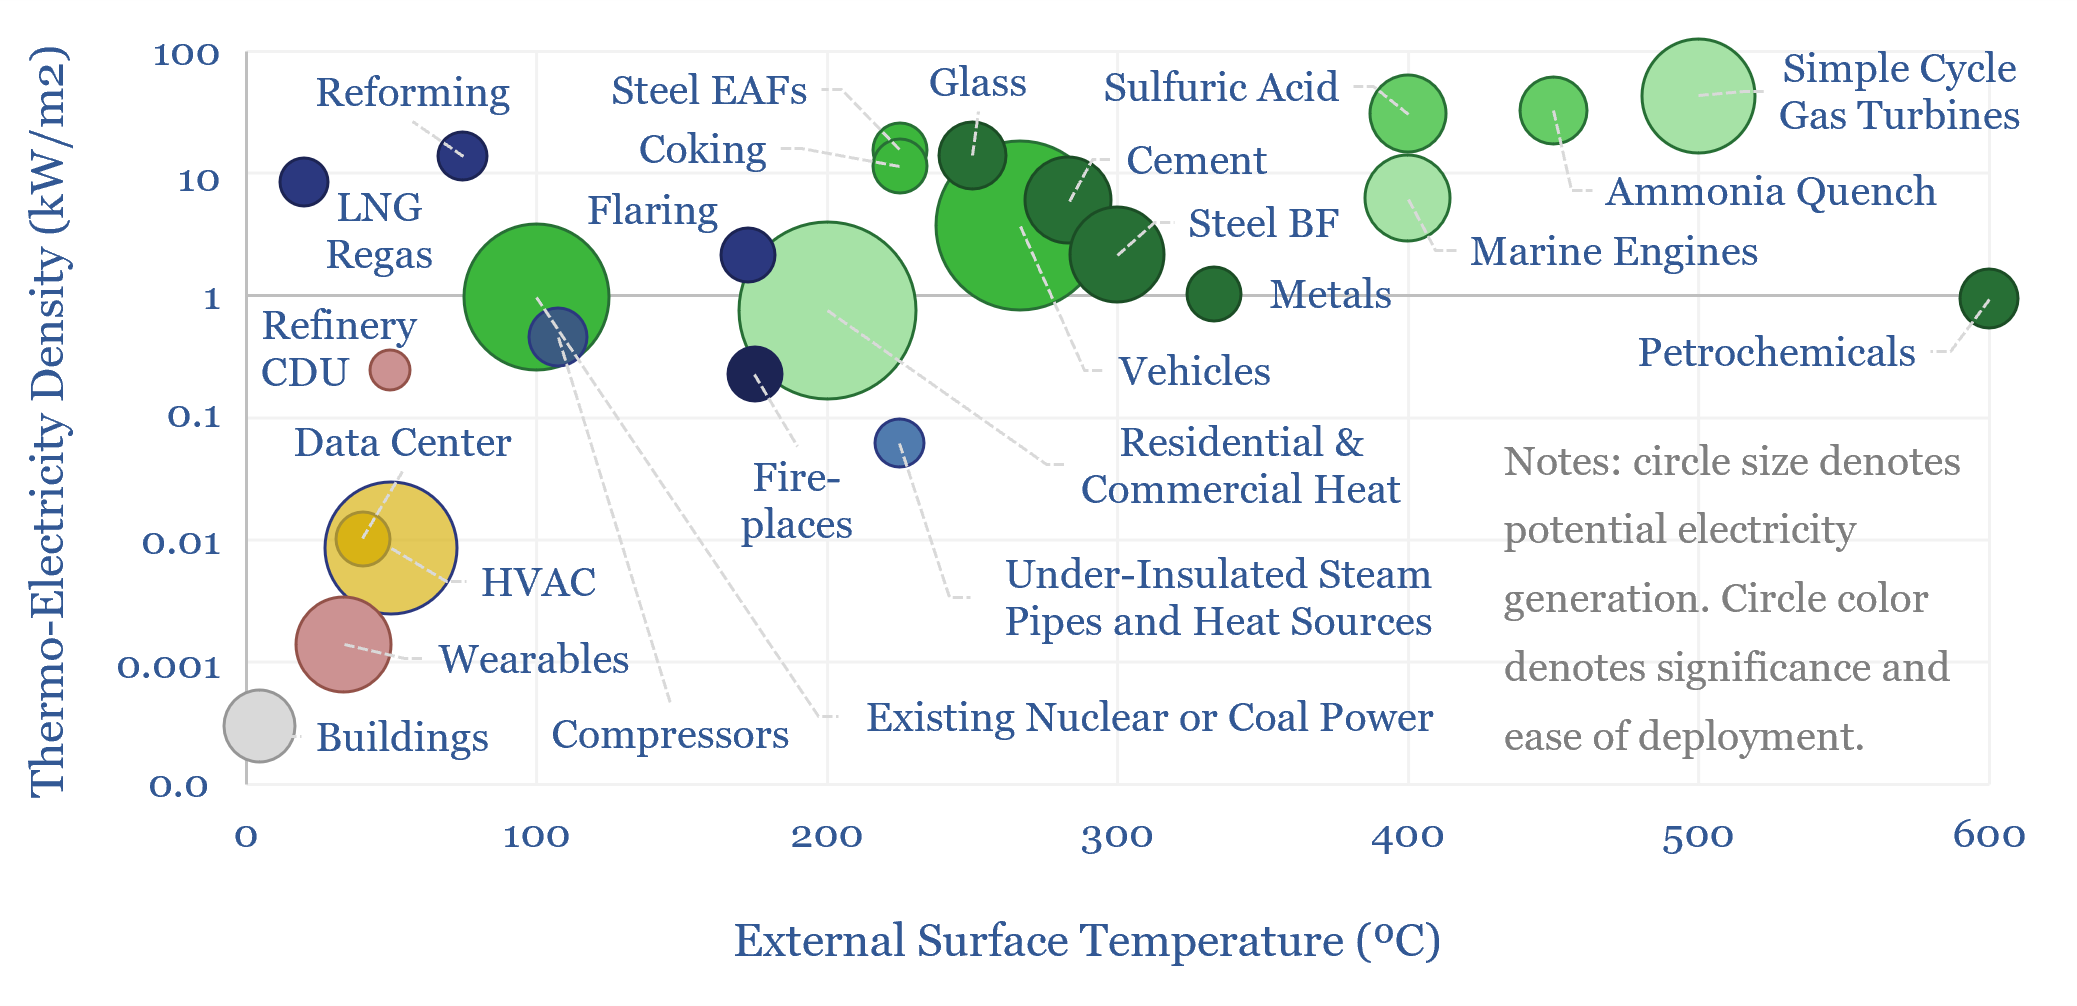
Next-generation thermoelectrics, if discovered by AI, could be a world-changer, converting heat to electricity at 10-50% efficiency, costing $500/kWe. 10,000 TWH of incremental electricity could be generated, worth $500-1,000bn pa. This 17-page report outlines our ‘top ten’ use cases for thermoelectrics.
-
Heat potential: what if AI can load-shift hot water tanks?

Residential heat is 13% of global energy. So what if AI could optimize residential electric heating? This 16-page report finds that load-shifting hot water tanks can unlock 1.5-8.5% additional flexibility in grids and make air source heat pumps the lowest cost option for heat in Europe, eclipsing gas-combi boilers, saving $300 per household per year?
-
The AI energy transition: technologies collide?
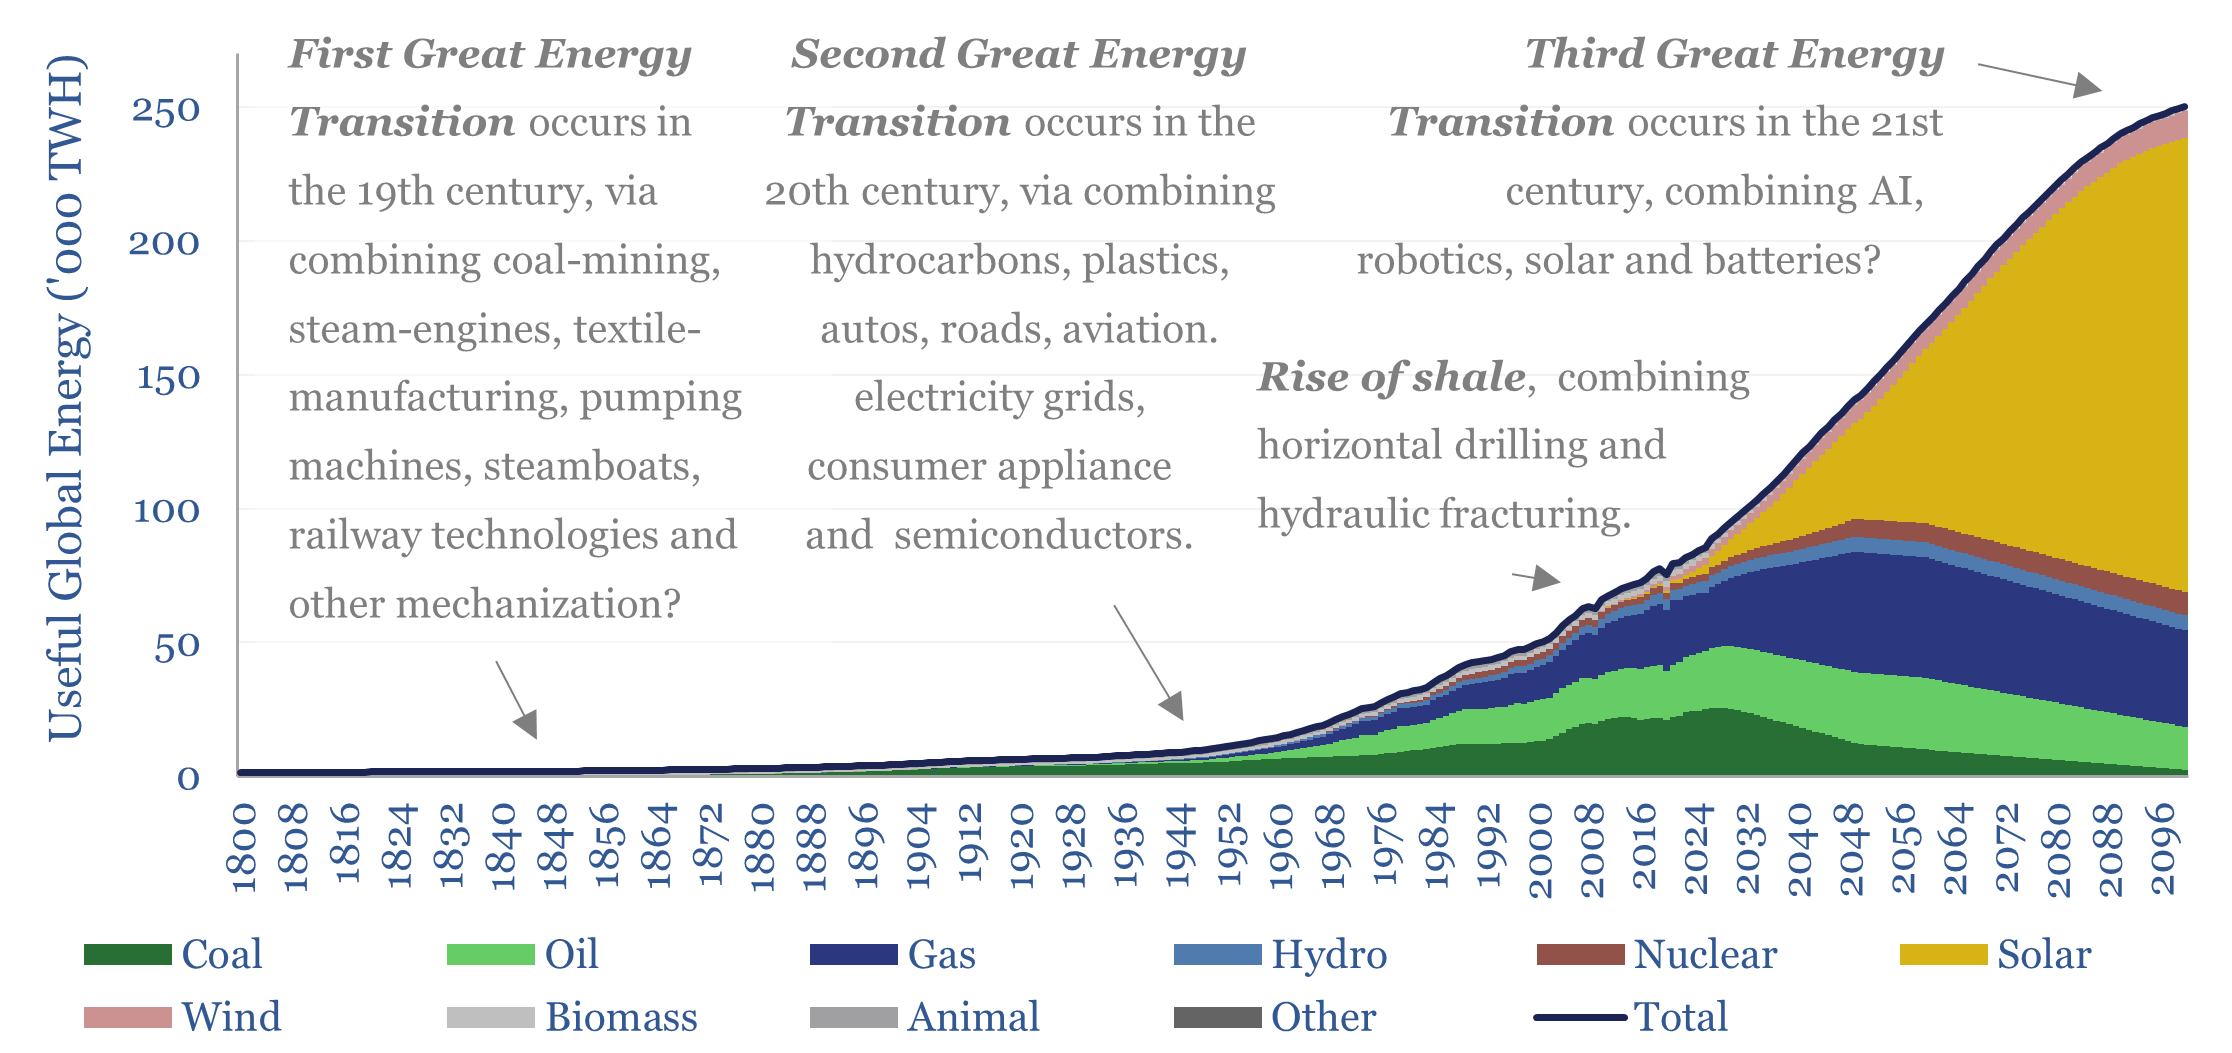
Great industrial leaps often occur when technologies collide. Hence this 20-page report explores how AI, solar, batteries and robotics might all collide together. This is transformative for the world. It represents the next “energy transition”. Hence this also becomes our new roadmap for the evolution of the global energy system.
Content by Category
- Batteries (96)
- Biofuels (44)
- Carbon Intensity (48)
- CCS (64)
- CO2 Removals (9)
- Coal (44)
- Commentary (65)
- Company Diligence (105)
- Data Models (930)
- Decarbonization (163)
- Demand (132)
- Digital (92)
- Downstream (47)
- Economic Model (223)
- Energy Efficiency (76)
- Hydrogen (63)
- Industry Data (311)
- LNG (56)
- Materials (86)
- Metals (90)
- Midstream (45)
- Natural Gas (163)
- Nature (76)
- Nuclear (28)
- Oil (179)
- Patents (39)
- Plastics (44)
- Power Grids (157)
- Renewables (153)
- Screen (139)
- Semiconductors (36)
- Shale (58)
- Solar (73)
- Supply-Demand (53)
- Vehicles (94)
- Video (24)
- Wind (46)
- Written Research (411)