This data-file aggregates power transmission and distribution kilometers by country, across 30 key countries, which comprise 80% of global electricity use. In 2023, the world contains 7M circuit kilometers of power transmission lines and 110M kilometers of power distribution lines. Useful rules of thumb follow below.
What are circuit kilometers? One ‘network kilometer’ of power transmission lines may carry one circuit kilometer, two circuit kilometers or sometimes (rarely) three circuit kilometers, suspended from the same towers. In turn, each circuit kilometer may contain two large conductors (e.g., an HVDC), three conductors (3-phase AC) or sometimes (rarely) six conductors where the 3-phase AC is disaggregated to promote transmission efficiency. This makes the ‘length’ of a transmission line a somewhat debatable concept. But we have aimed to aggregate data on circuit kilometers in this data-file, as we think it is the most meaningful and comparable metric.
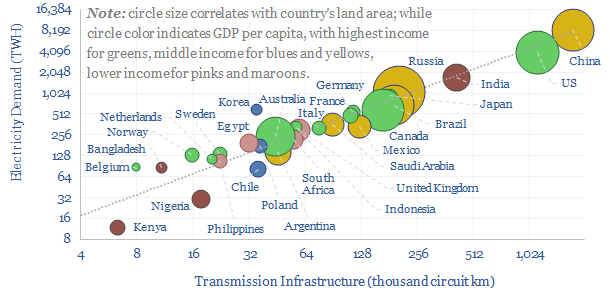
Power transmission per TWH of electricity? A good rule of thumb from the data-set is that each TWH pa of electricity use globally is supported by 225 km of power transmission lines, with an interquartile range of 175-275 km per TWH pa.
Power distribution per TWH of electricity? Another rule of thumb is that each TWH pa of electricity use is supported by almost 4,000km of distribution lines. The cut-off between transmission and distribution is a little bit blurry, but generally we are defining >100kV lines as transmission and <50kV as distribution.
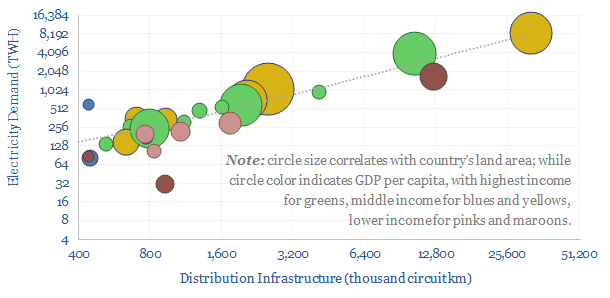
Ratio of distribution to transmission kilometers? The global average country in our sample has 16 km of distribution lines per km of transmission lines, with an interquartile range of 12-24x. Generally, large, developed world countries tend to have a higher share of large-scale transmission, due to greater availability of financing for larger and more efficient grid infrastructure.
How much transmission is needed to build out wind and solar? Using our rules of thumb above, each 1 GW of new, utility-scale renewables might warrant constructing or upgrading around 500 km of transmission lines and 8,000 km of distribution infrastructure? Although the requirements will clearly vary case by case and depend on regional backlogs. A far-offshore wind project clearly has different network impacts from rooftop solar.
Overall, the build-out of renewables and electrification are transformational for power grids (TSE research summary here). And it pulls on the demand for copper and aluminium conductors.
Countries tend to have longer power transmission networks per unit of delivered electricity when (a) population density is lower (b) GDP per capita is lower and (c) average voltages of the transmission system are lower. Correlations are available in the data-file.
We think the best explanation for (b) and (c) is that wealthy countries may have constructed higher voltage lines, which carry more power. Although another theory is that low-income countries are bottlenecked not in transmission, but in distribution?
Countries lying above the trend lines on our charts are most at risk of having ‘over-saturated’ grids and requiring grid upgrades; especially where their position on the charts cannot be explained by a more dense supply-demand base or a higher-voltage network.
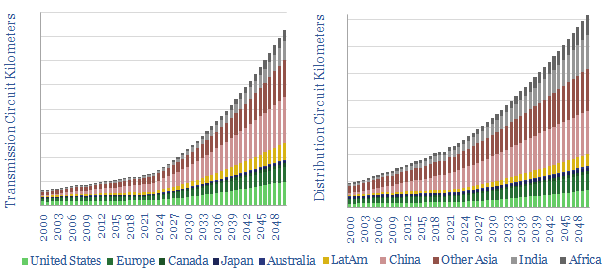
Power transmission circuit kilometers by country-region and power distribution kilometers by country-region are also estimated in the data file, including future projections for the energy transition (chart below, data in the file).
The full data-file contains our best estimates of the transmission infrastructure by country, and distribution infrastructure by country, aggregated from different public sources, company reports and technical papers.