This data-file calculates the power carrying capacity of power cables, plus the resistive losses of power cables. Both are modeled as a function of their voltage, current density, copper and/or aluminium content, resistance and connection type. Underlying data are drawn from data we have tabulated on over 100 conductors, their ratings and costs.
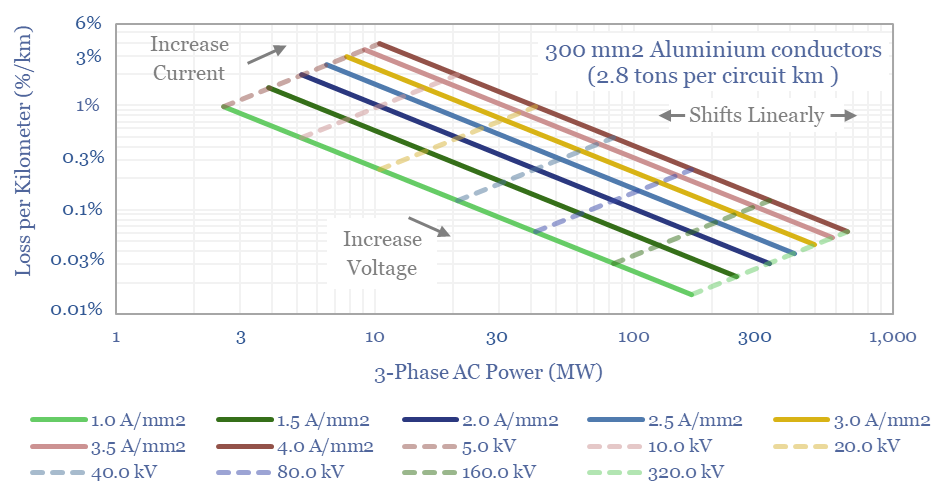
AC power is transmitted in three separate phases, each of which is carried in a separate conducting cable. Hence AC power (in MW) = Voltage (kV) x Current (kA) x sqrt(3). The resistive losses in the overall line (in MW/km) = 3 x Current (kA) ^2 x Resistance (Ohms/km), for a Wye-connected configuration. The loss rate (in %) is calculated by dividing absolute losses (in MW) by AC power (in MW).
For modeling purposes, we recommend breaking down the current (A) as a function of the conductor area (in mm2) and the current density (A/mm2). Generally, efficient conductors should not exceed a current density of 1-2 A/mm2. But higher current densities are possible, if the cables are rated for it and higher losses are tolerable.
A typical transmission line contains 3 x 400 mm2 aluminium conductors, at 150kV and 1.5 A/mm2 current density, thus carrying 150MW of power, while weighing 4 tons/km and losing 1.6% of the power in resistive losses per 100km.
A typical distribution line contains 3 x 200 mm2 copper conductors, at 15kV and 1.5 A/mm2 current density, carrying 8MW, weighing 6 tons/km and losing 0.1% in resistive losses each km.
A typical EV fast-charger requires 100kg of copper cabling, costing $800 in 2019-20 terms and emitting 5 tons of CO2.
A new wind or solar project might require 100 tons of aluminium, costing $260k, emitting 1,000 tons of CO2. But numbers vary…
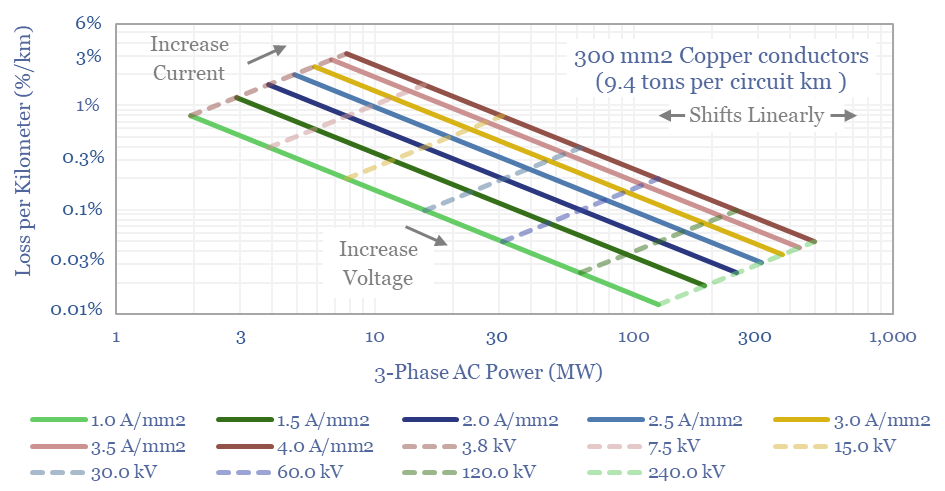
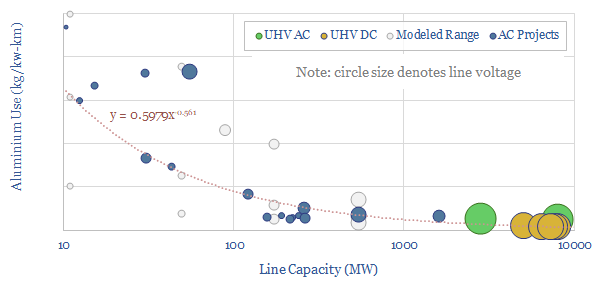
Power capacity and loss rates vary as a function of three key variables. Raising the current density increases both the power carrying capacity and the loss rate (in percent). Raising conductor area increases the power carrying capacity, has no impact on loss rates (for a constant current density), but does require more material (chart below). Raising voltage increases power carrying capacity and lowers the loss rate, but does require more complexity in the form of substations and transformers.
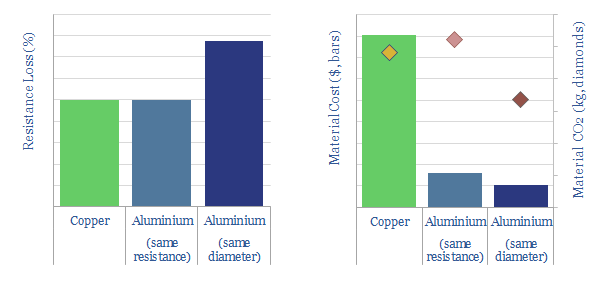
Copper is used in EV cabling because it has low resistance losses. However, copper is heavy, with a density of 8.9 tons/m3. Aluminium cables of the same diameter will have c50% higher resistive losses, but they are also 70% lighter and stronger, which in turn explains why overhead transmission lines will use aluminium cabling instead of copper (full research note on power transmission and minimizing line losses here and here).
Thus a typical new wind or solar farm might require 100 tons of aluminium, costing $260k, emitting 1,000 tons of CO2 (chart below). Again, attempts to decarbonize aluminium could double the costs.
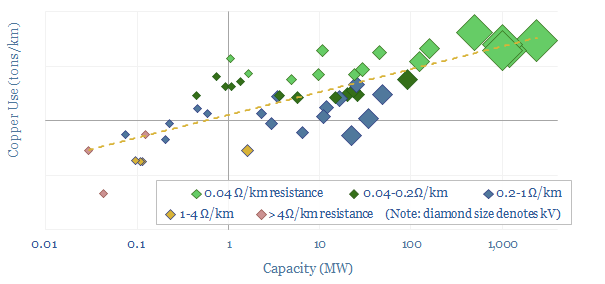
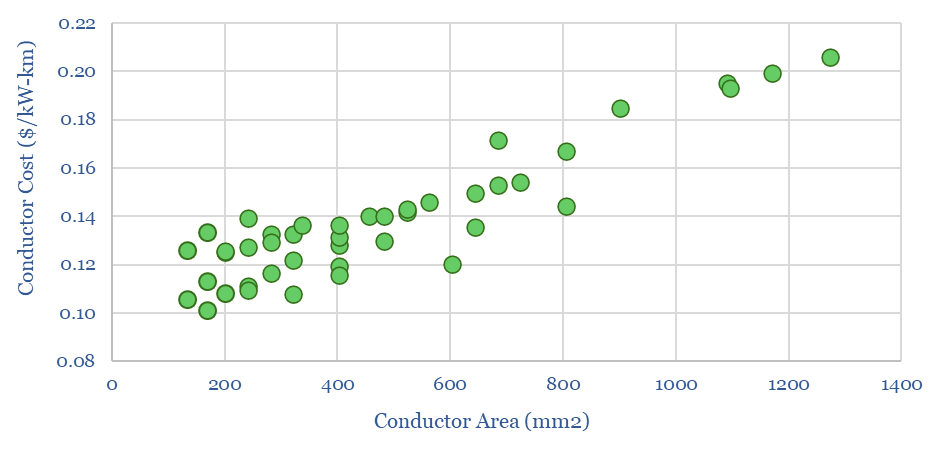
Material costs of conductors are usually around 40% of total conductor costs. Installation and accessories inflate these costs by 2.5x. A good ballpark for conductors on an overhead transmission line is around $0.15/kW-km (chart below).
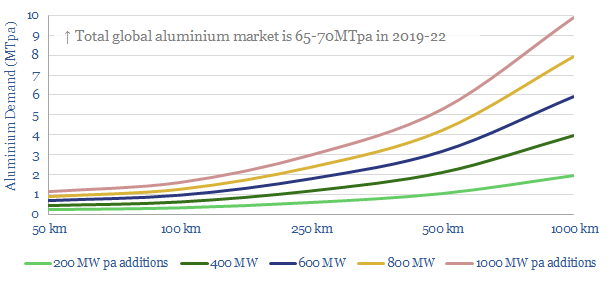
Overall, in the energy transition, we think that the use of aluminium to inter-connect renewables will most likely rise from 0.3 million tons per year (MTpa) in 2021-22 to 3-5MTpa by the 2030s (versus a total global aluminium market of 65MTpa in 2021). The numbers depend on the quantity of renewables being connected, the size of the lines and the distance from production bases to consumption centers.
However, since 2024, we have also been screening alternatives such as advanced conductors and superconducting cables. Advanced conductors carry 2x more current along existing routes, strengthened via carbon fiber cores. Superconducting cables are a kind of magic, which use 99% less copper and aluminium per kVA-km.
The full data-file is linked below, outlining all of our calculations. It allows you to test power cable capacities, loss rates and material usages, and how they change based on voltage (decay function), cable diameter (quadratic function), current density (A/mm2), the power cable distance (linear), copper and aluminium prices (linear) and tolerable resistance losses (decay function). Generally, higher voltage lines, which are larger and use more metals, placed closer to consumers, will be most efficient.