Is the power grid becoming a bottleneck for the continued acceleration of renewables? The median approval time to connect to the grid for a new US power project has climbed by 30-days/year since 2001; and has doubled since 2015, to over 1,000 days (almost 3-years) in 2021. Wind and solar projects are now taking longest to inter-connect, due to their prevalence, lower power quality and remoteness. This data-file evaluates the data, looks for de-bottlenecking opportunities, and wonders about changing terms of trade in power markets.
Accelerating wind and solar are a crucial part of our roadmap to net zero. But we have also been worrying about bottlenecks, especially in power grids. Project developers are increasingly required to fund new power transmission infrastructure, before they are allowed to interconnect, usually costing $100-300/kW, but sometimes costing as much as the renewables projects themselves (data here). If there is one research note that spells out the upside we see in power grids and electrification, then it is this one. We also see upside in long-distance transmission, HVDCs, STATCOMs, transformers, various batteries.
Other technical papers have also raised the issue of rising interconnection times and power grid bottlenecks for wind and solar. And the US’s Lawrence Berkeley National Laboratory has also started tracking the ‘queue’ of power projects waiting to inter-connect. We have downloaded their database, spent about a day cleaning the data (especially the dates), and aimed to derive some conclusions below.
Methodological notes. The raw LBL database contains a read-out of over 24,000 US power projects that sought to inter-connect to a regional power grid, going back to 1995. However, 13,000 of these applications were withdrawn, 8,000 are still active/pending and 3,500 are classed as operational. 2,500 of the projects have complete data on (a) when they applied for permission to inter-connect to the grid and (b) when they were ultimately granted that permission, allowing us to calculate (c) the approval time (by subtracting (b) from (a)). But be warned, this is not a fully complete data-set. And some States, which have clearly constructed large numbers of utility-scale power projects, seemed not to report any data at all. Nevertheless, we think there are some interesting conclusions.
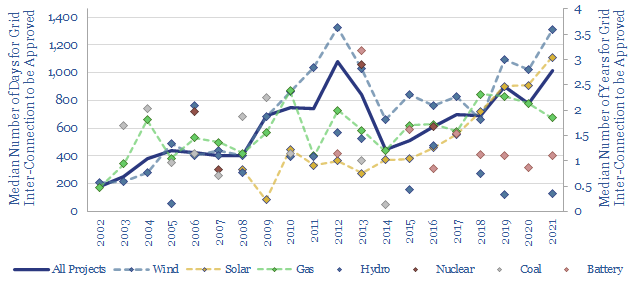
The median time to receive approval to inter-connect a new US power project to the grid has risen at an average rate of 30-days per year over the past two decades and took over 1,000 days in 2021, which is 2.8 years. This has doubled from a recent trough level of 500 days in 2015 (chart below) and a relatively flat level of 400-days in the mid-2000s.
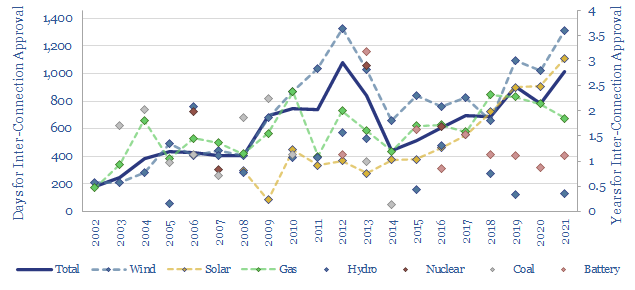
Renewables projects now take longer to receive approval to connect to the power grid. Wind projects have always taken longer to receive approvals. And recent wind projects continued taking 30% longer than the total sample of approved projects in 2019-21. More interestingly, however, solar projects have gone from taking 50% less time to receive grid connection approvals in the mid-2000s to taking 10% longer than average, especially in 2020 and 2021. Why might this be? We consider five factors…
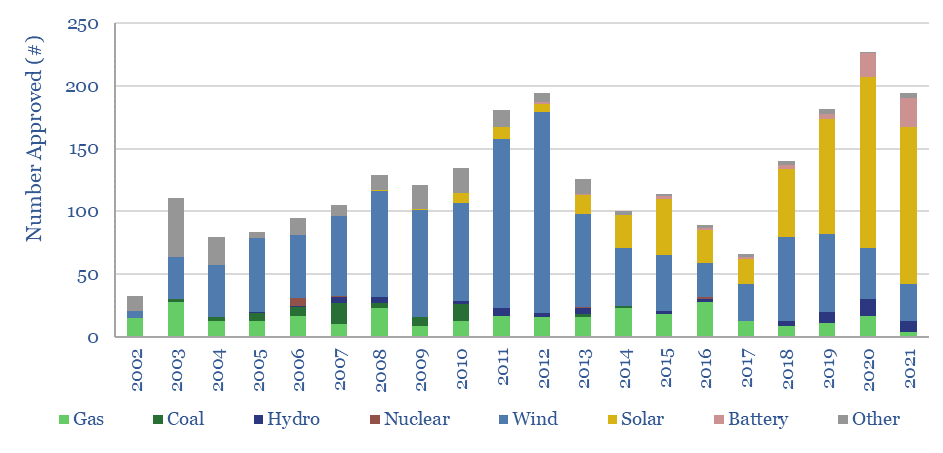
#1. Project quantity is probably the largest bottleneck. The numbers of different projects receiving permission to connect to the grid are tabulated below. A surge in wind projects in 2005-2012 correlates with the first peak in inter-connection approval times on the chart above. And a more recent peak in utility-scale solar, battery and wind projects correlates with the recent peak of approval times in 2020-21. This suggests a key reason it is taking more time to approve new inter-connections is that grid operators are backlogged. It would be helpful to resolve the backlog. And we wonder if the result might be a change in the terms of trade: favoring grid operators more, favoring capital goods companies more, and requiring project developers to be more accommodating?
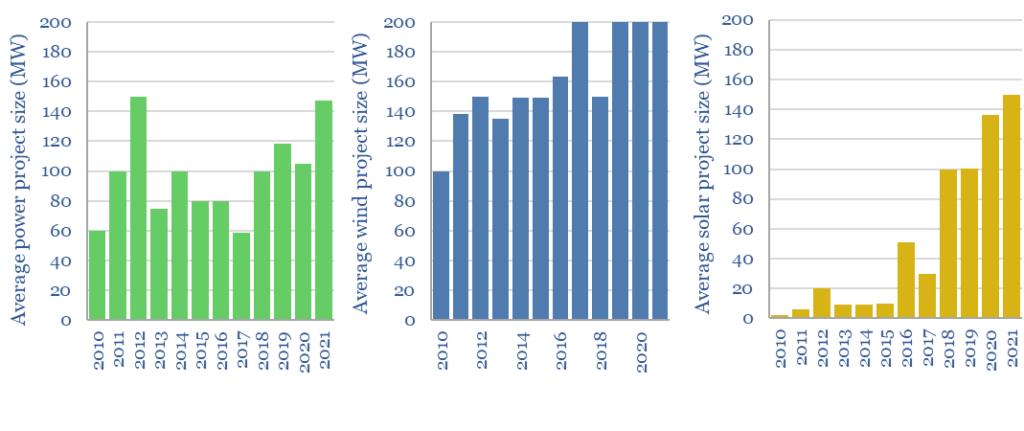
#2. Project sizing does not directly explain inter-connection approval times. The average utility-scale solar project has become larger over time (now surpassing 150MW). But wind projects have always been larger than the average power project seeking approval to connect to the grid. And there are many small gas, coal and nuclear projects that take longer to receive connection approval than large ones. So we do not think there is a direct link between power project size and the time needed to approve an inter-connection. However, there may be an indirect link. It is clearly going to take longer to study the impacts of connecting 10 x 100 MW solar projects (in 10x separate locations), than 1 x 1,000 MW nuclear plant, even though both have the same nameplate capacity.
#3. Connection voltage does not explain inter-connection approval times. The median project in the database is connecting into the grid at 130kV. The median wind project is at 145kV. The median gas project is at 135kV. The median solar project is at 110kV. The median battery project is connecting at 140kV. Although we do think that moving power over longer distances is increasingly going to favor higher voltage transmission and also pull on the transformer market.
#4. Power quality seems to explain relative approval times and increasingly so. Another interesting trend is the difference in interconnection approval times between different types of power projects. Wind and solar projects now take 30% and 10% longer than average to receive approvals. Whereas gas, batteries and hydro now take 15%, 50% and 90% less time than average to receive approvals. We think this is linked to power quality. On a standalone basis, wind and solar may tend to reduce the inertia, frequency regulation, reactive power compensation and balancing of power grids. Whereas gas power plants, batteries and hydro typically help with these metrics (each in their own way). We think this adds evidence in support of our power grids thesis.
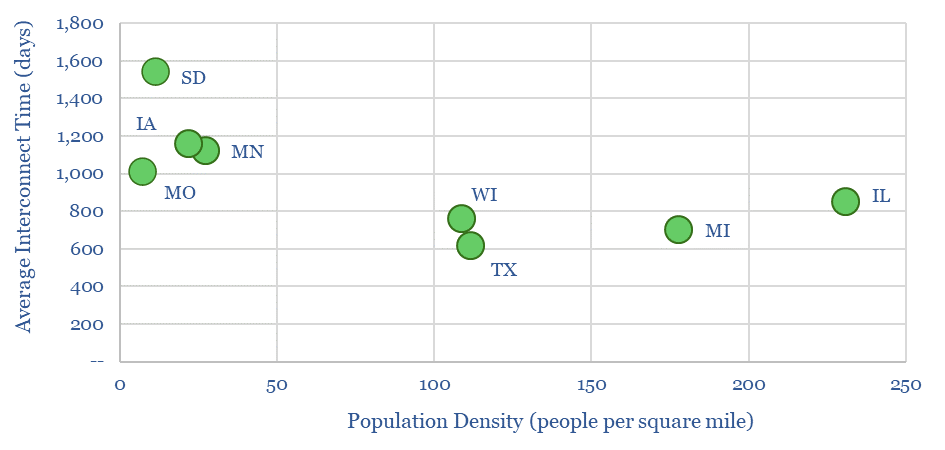
#5. Remote projects take longer to approve, as they will likely require more incremental transmission lines. The shortest interconnection times across all power projects were in Texas, which already has a very large power grid, arguably the best energy endowment and infrastructure in the world. But other more densely populated states (Michigan, Illinois) tended to have 50% lower times to approve inter-connections than some of the least densely populated states (the Dakotas, Iowa, Montana), where we think new power generation likely needs to be moved further to reach demand centers. Location matters for levelized cost of electricity. Again, we think this evidence also supports our power transmission thesis.
Overall the data suggest that there are growing bottlenecks to inter-connect renewables to power grids; especially in areas with a surge of activity, where power quality is increasingly important, and in more remote areas that require new transmission infrastructure. We think this trend will continue. It would be helpful to debottleneck the bottlenecks, to sustain the upwards trajectory of wind and solar. But we do think the terms of trade are shifting in favor of grid operators, power electronics, transmission infrastructure, developers that can use their own power and consumers that can demand shift.