This 20-page note quantifies the statistical distribution of the short-term volatility of solar power plants, by evaluating second-by-second data, for an entire year. Solar output typically flickers downwards by over 10%, around 100 times per day. We want to ramp solar in the energy transition. But how can industrial processes truly be ‘powered by solar’? Buffering the volatility creates opportunities for gas and nuclear back-ups, inter-connectors, supercapacitors, smart energy and power electronics?
Fleetwood Mac released their classic hit, ‘Little Lies’, in the winter of 1987. In the song, Christine McVie describes a once-wonderful relationship that has ultimately run its course. There is a reluctance to accept this fact about the future. Hence the song’s chorus pleads “tell me lies, tell me sweet little lies”. The refrain is then hauntingly echoed by Stevie Nicks and Lindsey Buckingham (“tell me, tell me lies!”).
This research note is a statistical analysis of an entire year’s second-by-second solar volatility (our methodology is laid out on pages 2-5). It is a nerdy and numerical topic. Hence without wishing to dilute the importance of this issue, we are going to draw some inspiration from Fleetwood Mac in our chapter headings.
For example, should solar power keep ramping up forever, to over 50% of future power grids? Or might solar slow down, after running its course, and ramping to 20-30%? And are analysts like us, who want to see solar capacity additions ramp up by 3-5x in the energy transition, wilfully asking to be told sweet little lies about overcoming short-term volatility issues? Our goal is to use data and find genuine, objective answers to these questions.
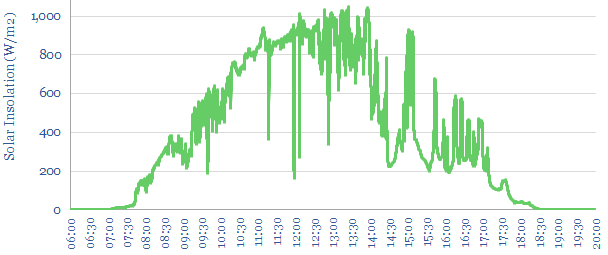
Variability. The best day, a typical day and the worst day of second-by-second solar volatility are presented on pages 6-9. For example, the chart above shows the second-by-second solar output at a typical-good day, with relatively little short-term volatility.
The statistical distribution of different days’ solar volatility is plotted in candlestick charts and marimekko charts on pages 10-11. There is volatility in the volatility itself.
“Powered by solar”. Can we power typical industrial processes purely from input feeds like the ones we have shown in our chart above, and throughout this report? Issues that need to be overcome are discussed on pages 12-15. They include annoyingness, lost output, mission-critical loads, damaged work-in-progress and faster degradation rates at industrial machinery.
Overcoming volatility. We want to ramp solar as much as possible as part of our ‘roadmap to net zero‘. We think a future grid with 20-30% solar are optimal, which involves a 3-5x acceleration in the pace of annual solar deployments. However, smoothing the short-term volatility, we think, is also going to create concomitant opportunities (page 16).
The best opportunities to de-bottleneck short-term solar volatility include diversified and resilient power grids, gas and nuclear back-ups, super-capacitors, inter-connectors, smart-energy, demand shifting and power electronics. The merits, drawbacks and costs (in $/kW) of these different solutions are presented on pages 17-20.
This note into the short-term volatility of solar (i.e., second-by-second) aims to complement our other research into the long-term volatility of solar (i.e., year-by-year). It is interesting that building out power grids and inter-connectors helps to resolve both issues.