This data file assesses US vehicle ownership over time. Improving fuel economy has been muted by rebound effects, such as greater mobility and larger vehicles. Oil prices influence the types of vehicles being purchased, their masses and their fuel economy. EV ownership has also been rising and is cross-plotted against incomes and other variables.
US fuel economy over time versus Rebound Effects?
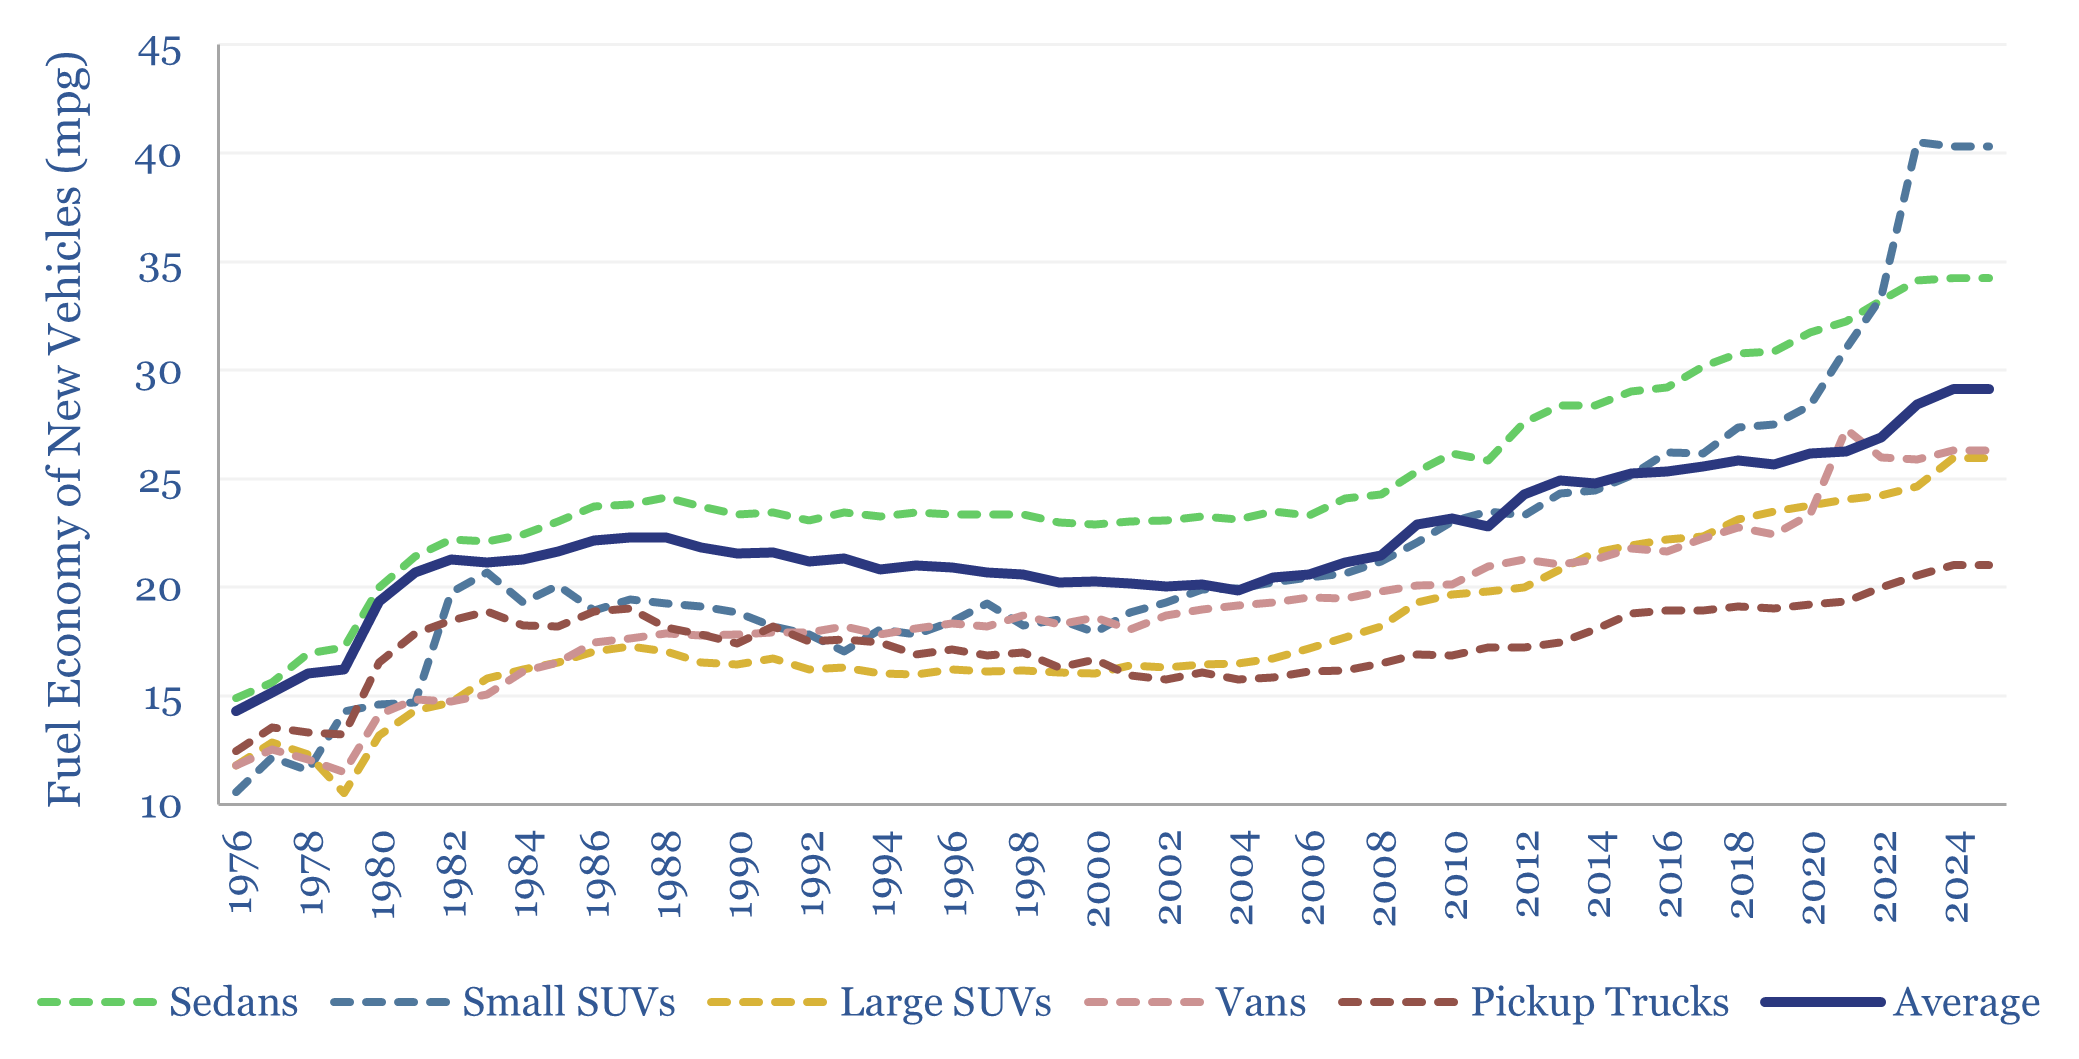
The fuel economy of new passenger cars (i.e., sedans) in the United States has doubled over the past half-century, from 15mpg in 1976 to 37mpg in 2025 (+145%, +1.9% pa, yellow line below), yet total US gasoline demand has increased from 7Mbpd in 1976 to 9Mbpd in 2025 (+25%, +0.5% pa, data available from the EIA).
First, the US population has grown from 220M people in 1976 to 335M in 2023 (+58%, +0.9% pa). Hence on a per capita basis, gasoline demand has actually fallen by 20% (-0.5% pa).
Second is timing. The weighted-average combustion vehicle in the world has a current age of 12-years and an expected service life of 20-years (data here). It takes time for more efficient vehicles to displace the older and less efficient fleet, and we think this explains c14% (0.2% pa) of the 1976-2025 delta between new vehicle fuel economy and gasoline demand, as is represented by the dark blue line below.

Increasing mobility. Vehicle miles driven per capita has increased by 47% from 1976 to 2026 (0.8% pa). We also think that the rise of aviation (data here) has displaced what would have been car travel in the past, as aviation accounted for c8% of a typical person’s domestic mobility in 1976, doubling to c20% in 2025 (chart below). Total mobility has increased by 50% since 1976 (+0.9% pa)

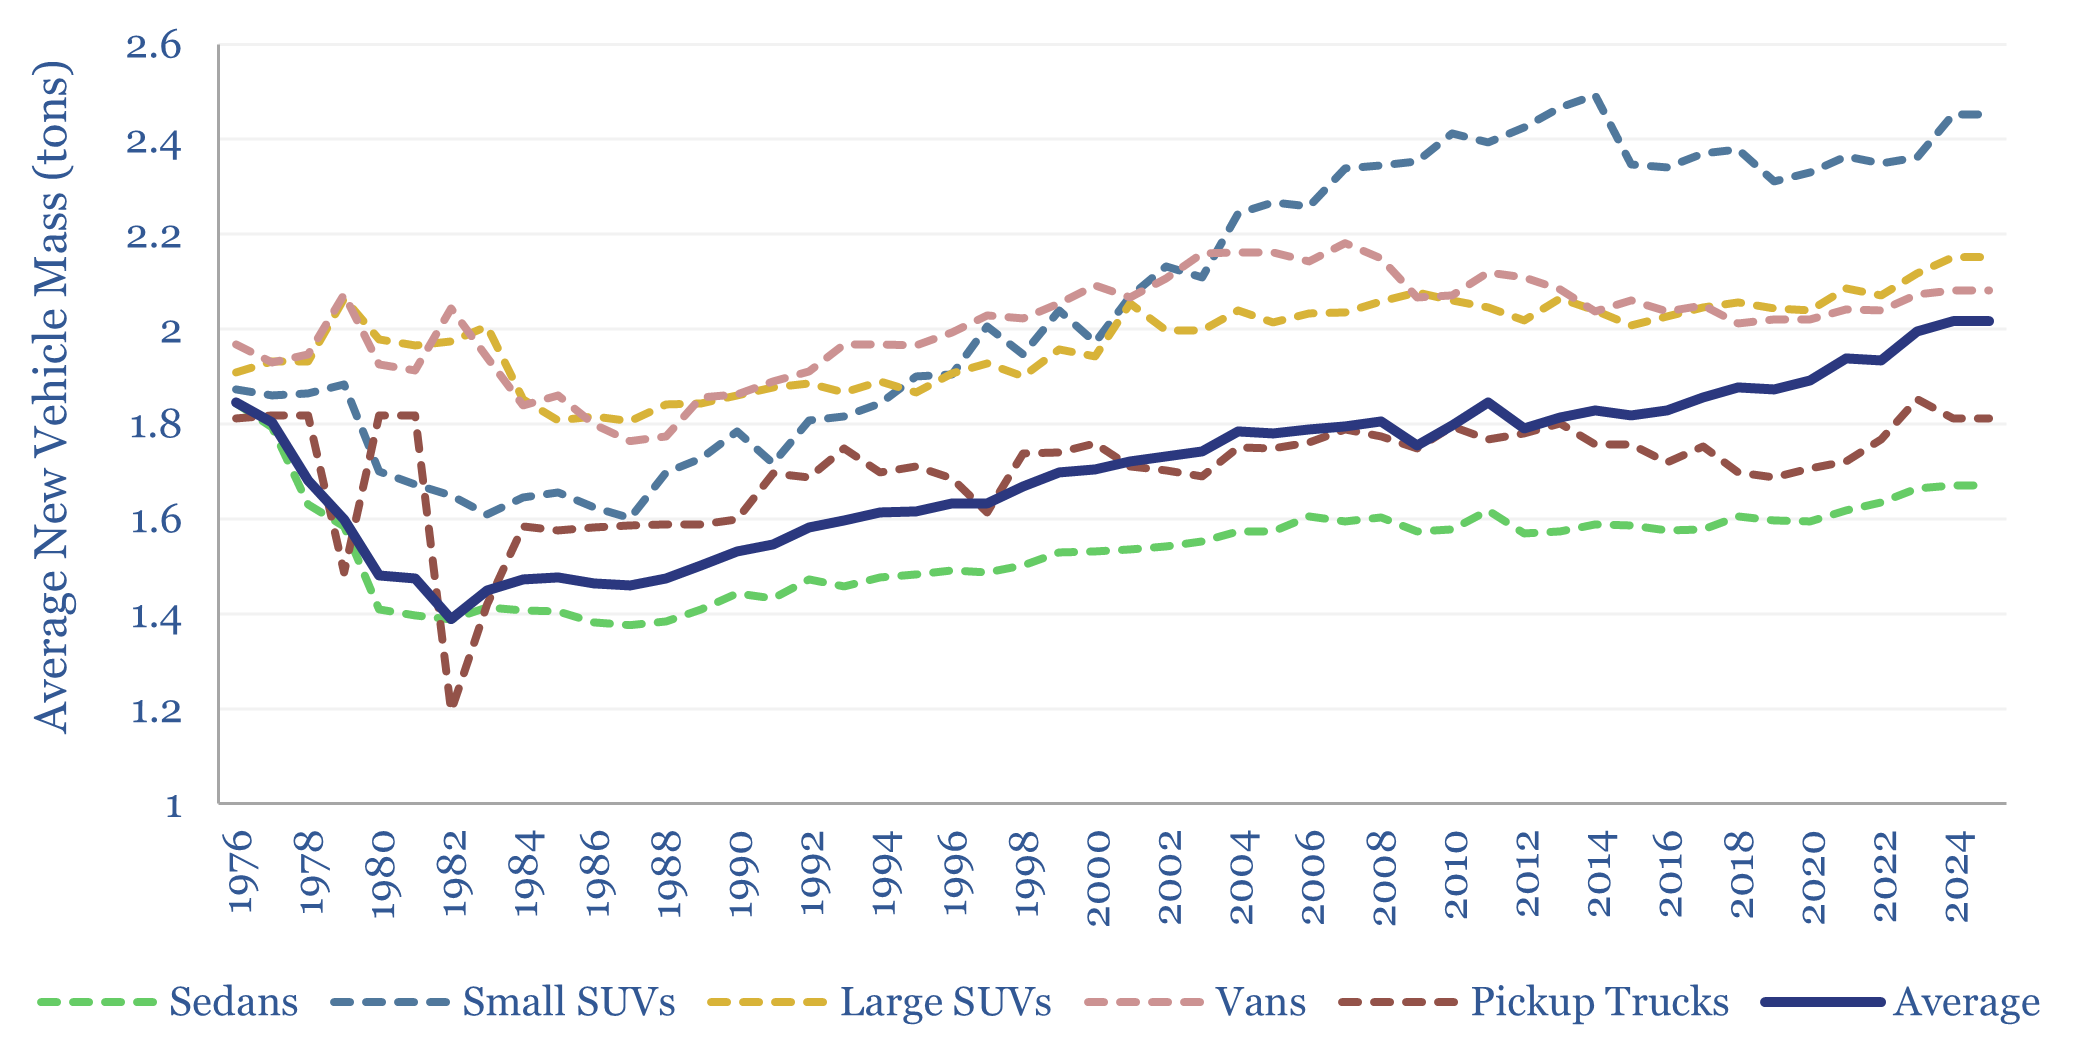
The vehicle mix has also shifted away from small and efficient sedans towards larger and less efficient SUVs and trucks. The average vehicle has grown from 1.4 tons at trough in 1982 to a new peak of 2.0 tons in 2025 (chart below). This actually makes the improvement in vehicle efficiency even more impressive. The fuel economy of a vehicle is a function of its mass and cross sectional area.
A wide gap remains between the fuel economy of different vehicle types. Sedans achieve 34 mpg in 2025, while large SUVs achieve 27 mpg, and pickups achieve 26 mpg (chart below). We also see a large rise in electric vehicle sales and their fuel economy versus other vehicle types is summarized here.
How do vehicle purchasing decisions vary with oil prices?
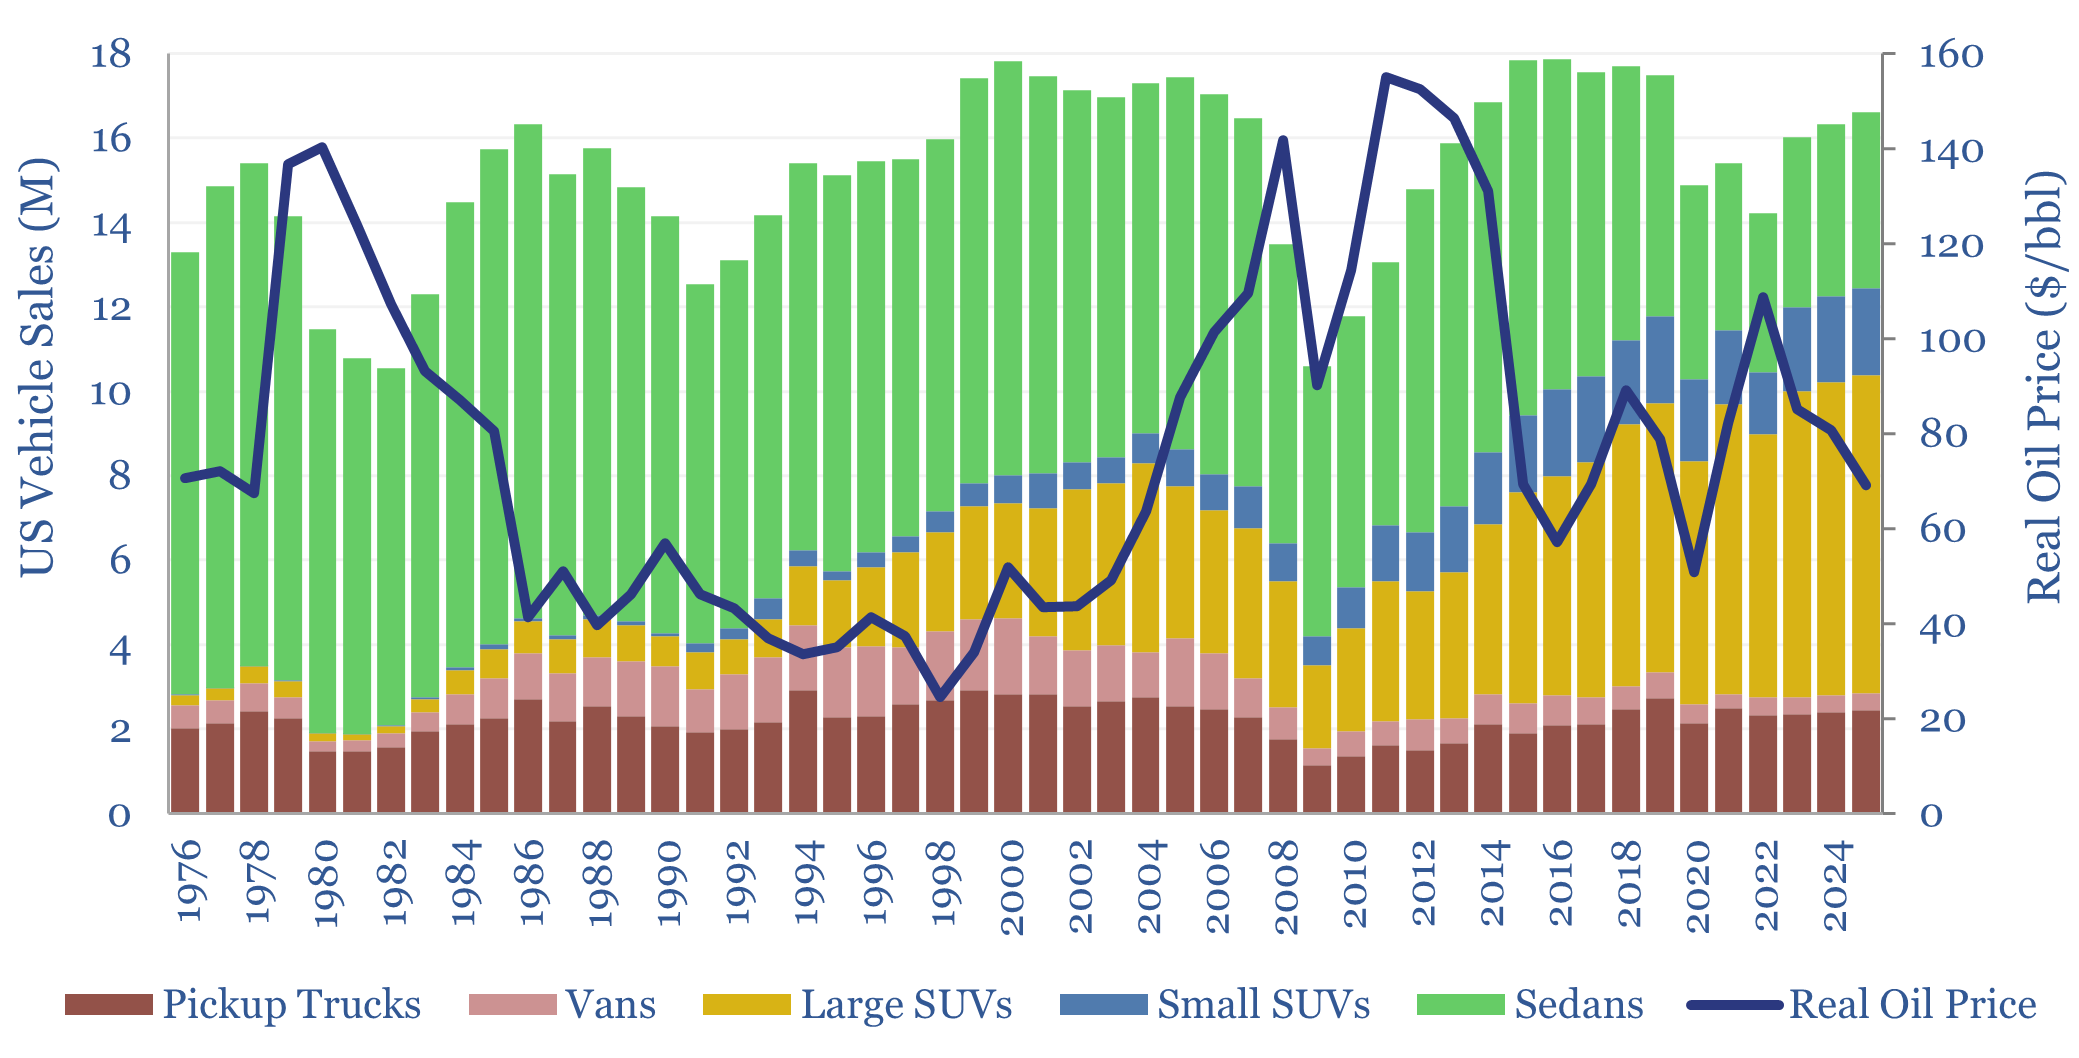
How do vehicle purchasing decisions vary with oil prices? Real oil prices below $40/bbl have seen a -0.8% annual deterioration in the fuel economy of the aggregate US vehicle purchase, due to greater shares for SUVs and trucks. Conversely, real oil prices above $80/bbl have seen a c2% annual improvement in fuel economy, as consumers preferred to purchase a greater share of more fuel-efficient sedans and other vehicles.
Please download the first data-file for data into vehicle types over time, fuel economies and their relationship with oil prices and mobility. Some of the data are tabulated from EPA disclosures. We have also written a separate article summarizing all of our vehicle research.
Electric vehicle ownership cross-correlations?
Electric vehicle ownership trends are tabulated in the second data-file linked below. Specifically, the US FHWA undertakes a National Household Travel Survey every four years. The latest instalment in 2022 surveyed 7,893 US households, which own 14,684 vehicles, with 40-50 data-fields available This allows us to cross-plot Electric Vehicle Ownership – both battery electric vehicles and PHEVs – against metrics such as income, ICE ownership, residence types and urban/rural locations.
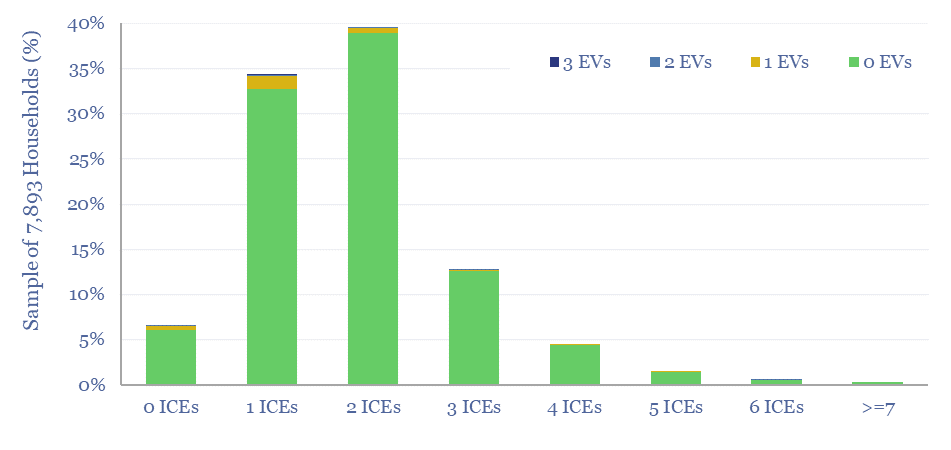
The EV ownership numbers support recent TSE research suggesting EVs may be owned in addition to ICEs, stoking vehicle value chains, but also potentially causing EVs to saturate?