We have aggregated the power output and power drops across a month of second-by-second wind data, from a 25MW onshore wind farm in Germany (12 x 2MW turbines). We want to use the data to understand the typical second-by-second volatility of wind power, and what kind of power smoothing will be needed to ramp wind power in the energy transition.
As background, our recent research has evaluated the feasibility of powering real-world grid loads using solar power using a similar data-set quantifying the second-by-second volatility of solar power.
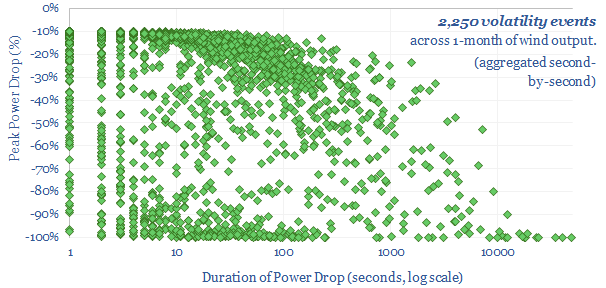
We were hoping that the second-by-second volatility of wind power would be less volatile. However, if anything, wind power is more volatile than solar. Volatility events for wind and solar are similarly frequent, but for wind, they tend to be deeper and last longer.
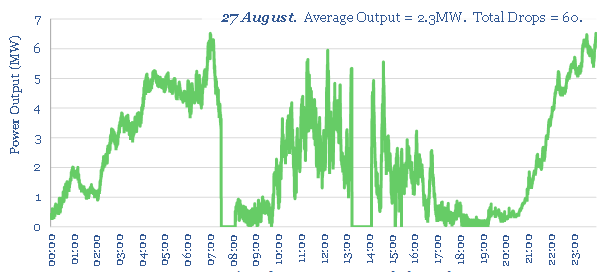
In the average day, the onshore wind farm that we assessed saw 75 power volatility events, where output fell by over 10% from its trailing ten-minute average level (example below). 40% of these volatility events lasted less than 10-seconds. 80% of the volatility events lasted less than 60-seconds.
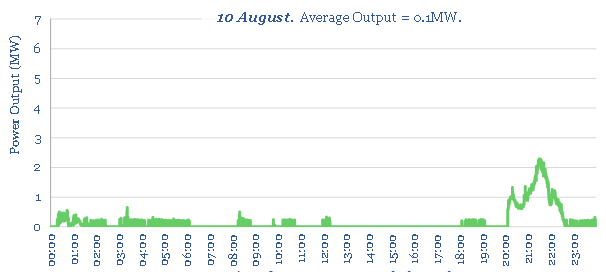
What is challenging is that the remaining 20% of volatility events (by number) could often last for hours or even days (see below). Indeed, our data-set includes a four-day timeframe with effectively zero wind power generation (examples in the data-file). By contrast, the sun does tend to rise every day, and generates some power even on cloudy days in the dead of winter.
Wind volatility is also more binary than solar volatility, as is visible in the first chart above. Some striking numbers are that solar output tends to drop off by over 90% from its trailing ten-minute average level an average of 0.02 times per day (i.e., very rarely). Whereas wind output dipped by over 90% below its trailing ten minute average level, an average of 10 times per day (i.e., the wind can stop blowing, entirely, and this occurs relatively often).
Arguably, our data-set is also under-estimating volatility. Some days in our data-file showed very few volatility events, simply because wind output was precisely zero for several consecutive hours (example above). Yes, from a purely statistical perspective, this means that a wind power plant can produce the exact same power output for several hours at a time. But so can a potato.
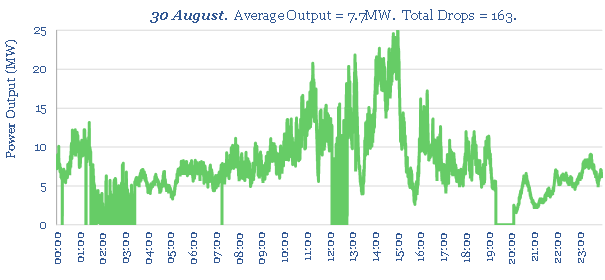
On the other hand, some of the days with high wind output were significantly more volatile than the average day in our sample. For example, the chart below shows a day where output reached nameplate capacity of 25MW. But this day had 163 ‘volatility events’.
We clearly want to ramp both wind and solar power up as much as possible in the energy transition. But powering real world grid loads with the volatile output from both wind and solar is going to create opportunities and challenges in power grids. We think the best solution that is going to emerge is in power infrastructure, inter-connecting large areas, with resilient and long-distance transmission lines.
Definitions. Our wind analysis defined a “power drop” as a >10% reduction from the trailing 10-minute average wind power being generated at the asset. The power drop’s duration is defined as the number of seconds until output returns to 90% of that previous 10-minute average power output. The average power drop is the average reduction in power output during the duration of the power drop, compared to the prior trailing ten minute average. And the peak drop is the maximum reduction in power output during the power drop, compared to the prior trailing ten minute average.
Data sources. It is surprisingly hard to find good, second-by-second data for large, modern wind farms. However, this analysis has been based on an excellent technical paper and underlying data-set into short-term volatility of renewables. Source: Anvari, M., Lohmann, G. Wächter, M., Milan, P., Lorenz, E., Heinemann, D., Tabar, M. R. & Peinke, J. (2016). Short term fluctuations of wind and solar power systems. New J. Phys. 18, 063027.