We have aggregated the power output and power drops across an entire year of second-by-second solar data, using a publicly available data-set from the NREL, measured across c15 weather stations, in a 500m x 1,500m array in Hawaii. We want to use this data-site to understand the typical second-by-second volatility of solar output from a solar plant.
Hence, we restricted our analysis to the time between 10am and 4pm each day, when the sun is clearly ‘up’, and to ensure we are not simply measuring the power drops due to the sun setting. Then we aggregated all of the second-by-second volatility and power drops.
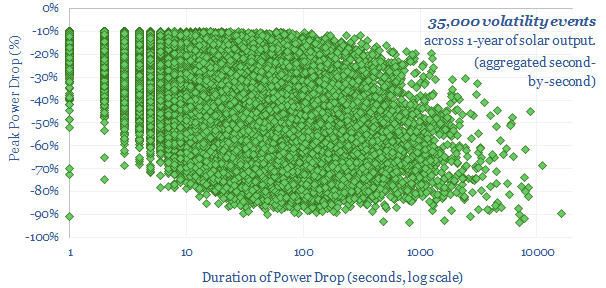
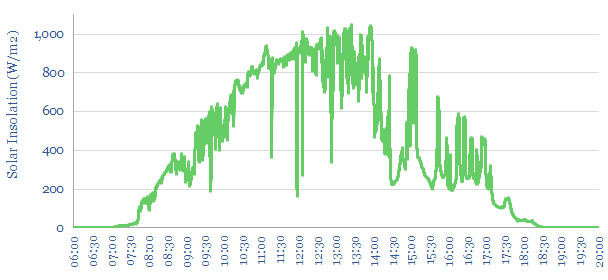
The typical second-by-second volatility of solar power is surprisingly high, with around 100 noticeable fluctuations per day on average, ranging from 1 – 10,000 seconds, and varying by 10-90% peak to trough. The main cause is clouds. For example, a typical day of second-by-second solar output is plotted below.
Distribution of solar volatility. Around 50% of the second by second power drops exceed more than 30% of the array’s prior output, and around 10% exceed 70% of the array’s prior output. Around 50% of the power drops exceed 10-seconds, 4% exceed five-minutes, and 0.1% exceed 1-hour.
Distribution across different days. The average day will see 100 power drops, although this varies by day. The best days are totally clear, and see a completely smooth output profile. Top quartile days see <45 power drops. Bottom quartile days see over 135 power drops. And the worst day, frankly, are hellish — they would struggle to power most modern industrial processes, even with the help of batteries.
Definitions and methodology. Specifically, we have defined a “power drop” as a >10% reduction from the trailing 10-minute average solar energy hitting the solar array. The power drop’s duration is defined as the number of seconds until solar output returns to 90% of that previous 10-minute average power output. The average power drop is the average reduction in power output during the duration of the power drop, compared to the prior trailing ten minute average. And the peak drop is the maximum reduction in power output during the power drop, compared to the prior trailing ten minute average.
This data-file contains a read-out of all 35,000 power drops that took place across the NREL measurement site over the course of the year: their average magnitude, duration and when they occurred. It also contains some charts, showing the statistical distribution of the solar volatility. And it contains an overview of the methodology (and VBA scripts) we used to parse 365 x 8MB input data-files from the NREL.
Data source: Sengupta, M.; Andreas, A. (2010). Oahu Solar Measurement Grid (1-Year Archive): 1-Second Solar Irradiance; Oahu, Hawaii (Data); NREL Report No. DA-5500-56506. http://dx.doi.org/10.5439/1052451