
Global plastic is estimated at 530MTpa in 2025, rising to 1GTpa by 2050. This data-file is a breakdown of global plastic demand, by product, by region and by end use, with historical data back to 1990 and our forecasts out to 2050. Our top conclusions for plastic demand, by region, by product, by fate, are below.
Global plastic demand is estimated at 530MTpa in 2025. For perspective, the 100Mbpd global oil market equates to around 5bn tons per year of crude oil, showing that plastics comprise over 10% of total global oil demand.
Global plastics markets are challenging to track. Our numbers aim to capture all materials made by cracking hydrocarbons, including 85MTpa of textile fibers. But different data-sources use different definitions. And thus compiling numbers in this data-file has required more guesswork/triangulation than in other TSE SD models.
Our outlook sees increasing demand for polymers, most likely rising to 1GTpa by 2050. Polymers are crucial inputs for new energies. And for high-grade insulation, both thermal and electrical, and as used across the AI/robotics ecosystem. Other plastics are used for light-weight composites, which lower the energy consumption of transportation technologies.
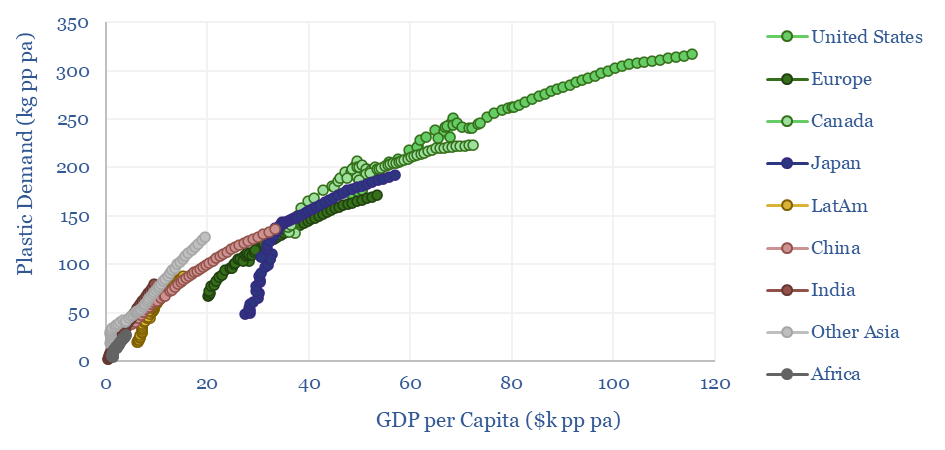
Global plastic demand by region. The top billion people in the developed world comprise 12% of the world’s population, but 40% of the world’s plastic demand. We see developed world plastics demand running sideways through 2050, while emerging world demand doubles from 300MTpa to 700MTpa (charts below).
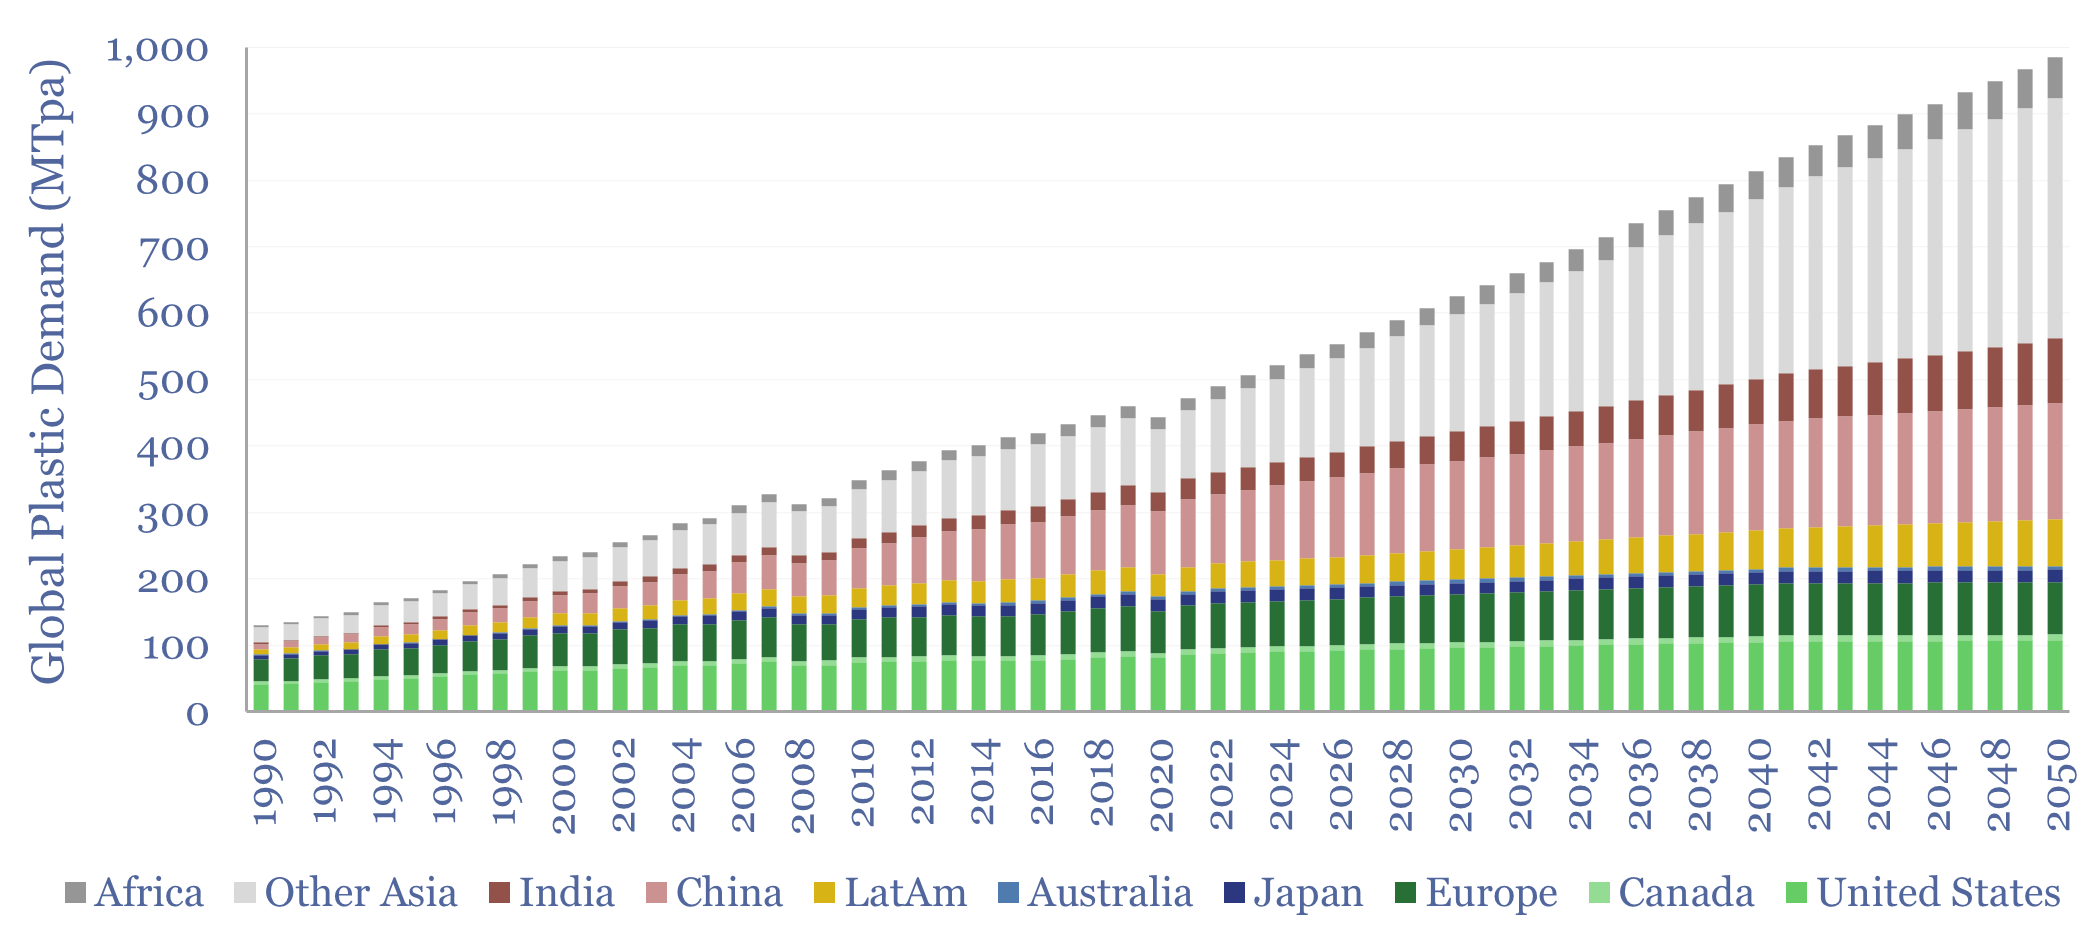
Global plastic demand CAGR? Our numbers are not aggressive and include a continued deceleration in the total global demand CAGR, from 7.5% pa growth in the twenty years ending in 1980, to 6% pa in the twenty years ended 2000, to 3.3% pa in the twenty years ended 2022 and around 2.5% pa in the period ending 2050. This is a classic decline in the commodity intensity of incremental GDP.
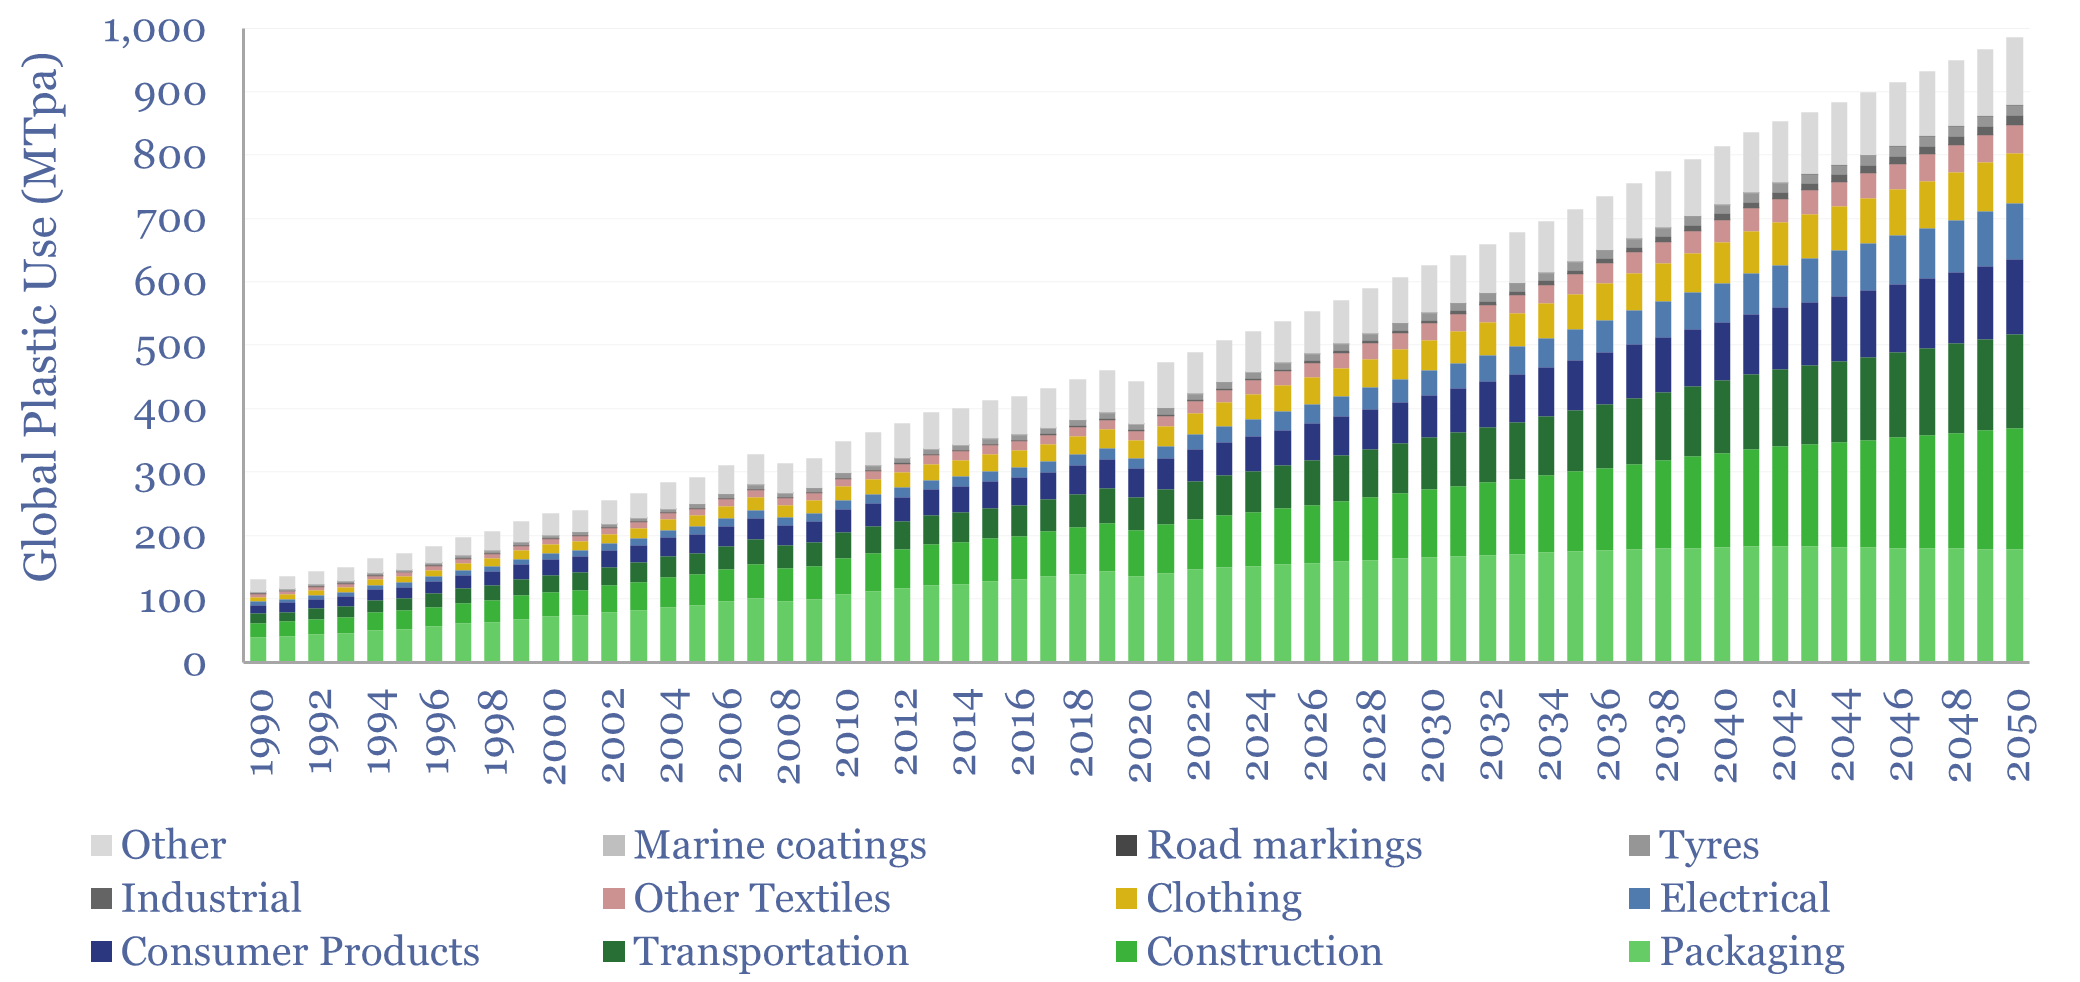
Plastic demand by end use is broken down in the chart below. Demand is growing fastest for electrical products, rising +5.7% pa in the past decade, maintaining c5% pa to 2050. Second are textiles, +4.5%. Slowest growing is packaging, +2% pa in the past decade, <1% pa to 2050. Premiumization is also occurring, as demand is growing fastest for more advanced plastics, such as elastomers (+7.2% in the past decade), polyurethanes (+3.7% pa), and other inputs that support additive manufacturing, but slowest for simple HDPE (+1% pa).
We had hoped that the rise of EVs would create a glut of naphtha, allowing for cheaper feedstocks and higher margins. But this has not happened yet. Transport fuel demand is re-accelerating. And also in 2026, we see NGL feedstock availability tightening as shale production declines.
Decarbonizing plastic production has also been a topic in our research, modeled from first principles at an ethane cracker, naphtha cracker, for making plastic products and screened across petrochemical facilities. All of our plastic recycling research is linked here. After a challenging pathway to de-risking this technology, we see front-runners emerging, such as Agilyx, Alterra and Plastic Energy.
Please download the model to stress-test your own variations. Underlying inputs are drawn from technical papers, OECD databases and Plastics Europe. The forecasts are our own.