
Global gas supply-demand is predicted to rise from 400bcfd in 2023 to 650bcfd by 2050, in our outlook, as a complement to wind, solar, nuclear, and as global coal resources mature from the 2030s onwards. This data-file quantifies global gas demand and supply by country, across heating, power and industry.
Global gas production doubled in the c30 years from 1990-2019, rising at a 2.5% CAGR. Our forecasts are that global gas demand will continue growing at 1.9% pa, reaching 650bcfd by 2050, contributing to our long-term energy market supply-demand balances.
Global gas consumption by region and over time is also estimated in the data-file, declining from 155bcfd to 140bcfd in the developed world by 2050, but doubling to over 500bcfd in the emerging world, with the largest gains needed in China, India and other Asia (chart above).
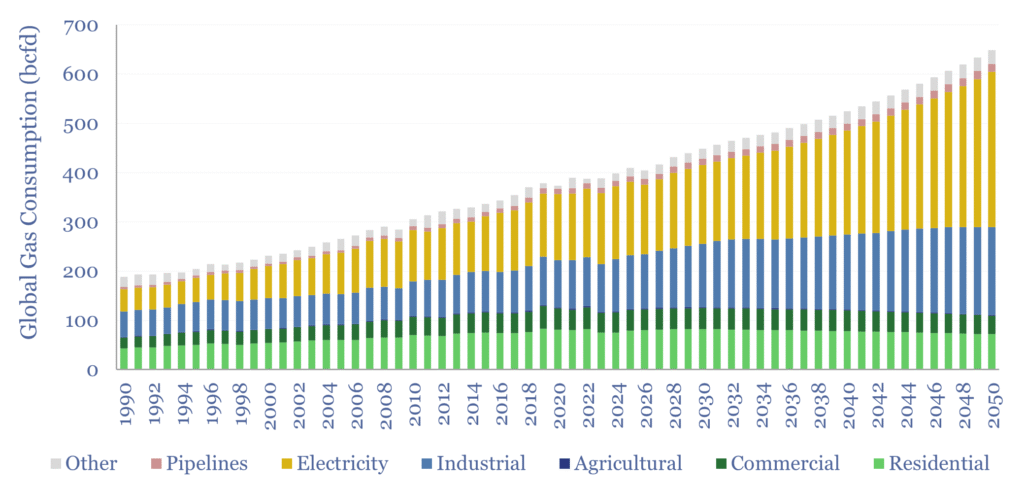
Global gas consumption in 2025 was c35% electricity generation, c25% industrial, c20% residential heat, c10% commercial heating, while the remainder was for agriculture, pipelines and transport (chart below). Our data-file breaks down the global gas market by end use within each of ten major regions.
A fascinating feature of gas markets is their seasonality. Global gas demand will rise >2%, to surpass 400bcfd in 2025, but seasonality means Jan-2025 reached 515bcfd, while May-2025 troughed at 335bcfd, for a 50% spread. In hot industrial countries, peak monthly demand is 10-15% higher than trough monthly demand, in the US/Canada/Japan it is c60% higher, and in Europe it is 140% higher. This underpins the demand for gas storage.

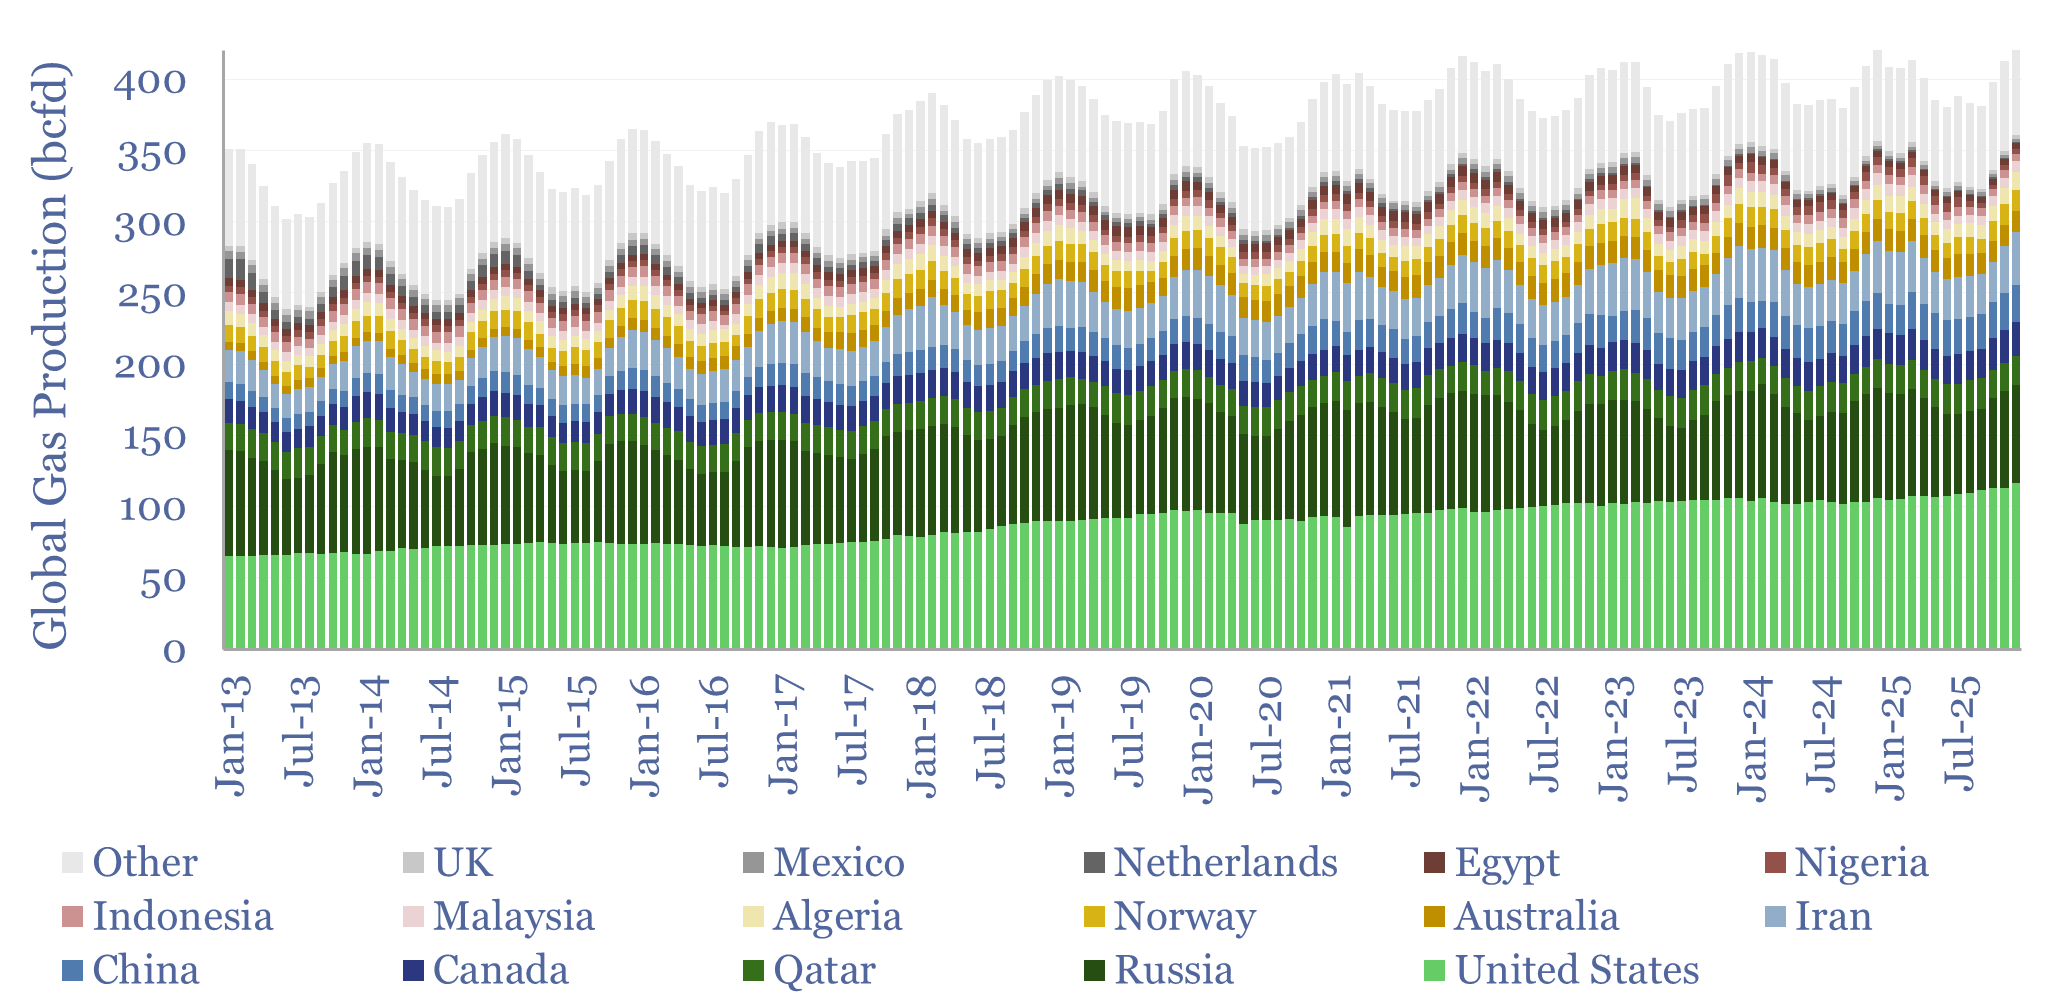
Another fascinating feature of gas markets is their flexibility, shown by plotting monthly gas production by country over time (chart below). In the Northern Hemisphere, production runs 6% higher than the annual average in December-January and 6% lower than average in June-August, as producers consciously flex their output to meet fluctuations in demand. Gas output does not show volatility, but voluntarity!
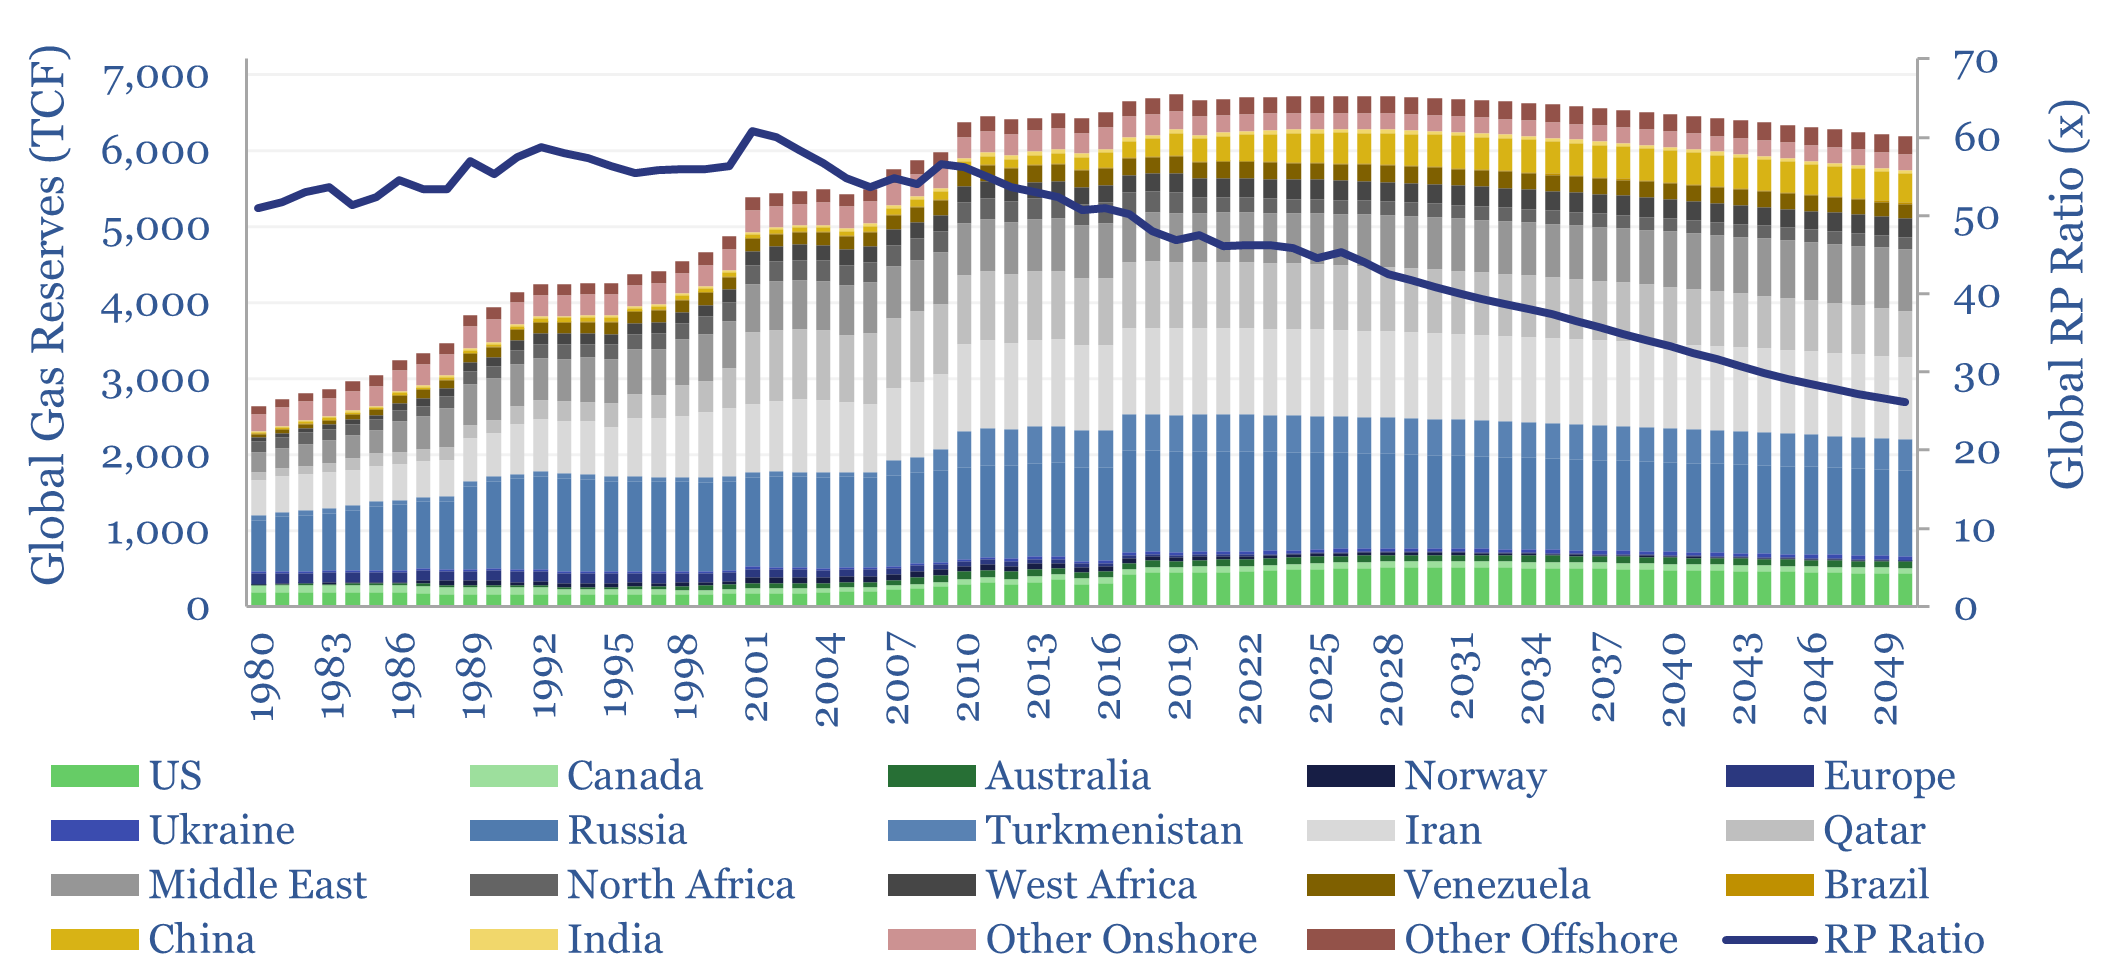
Amazingly, from 1990-2019, global gas reserves increased from 4,000 TCF to 7,000 TCF, for a reserve replacement ratio of 190%, although the numbers have been cyclical and have fallen below 100% in recent years (chart below).
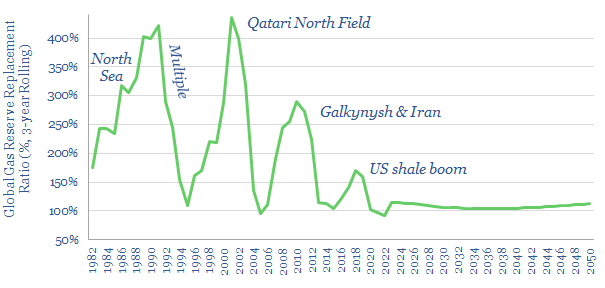
On our numbers through 2050, a reserve replacement ratio of 90% is needed, while the ‘reserve life’ (RP ratio) will likely also decline from around 45-years today to 25-years in 2050. Please download the data-file for reserve numbers and production numbers by country.
Onshore resource extensions are seen primarily coming from shale, with continued upside in the US, and vast new potential in the Middle East, North Africa and possibly even European shale as a way of replacing Russian gas.
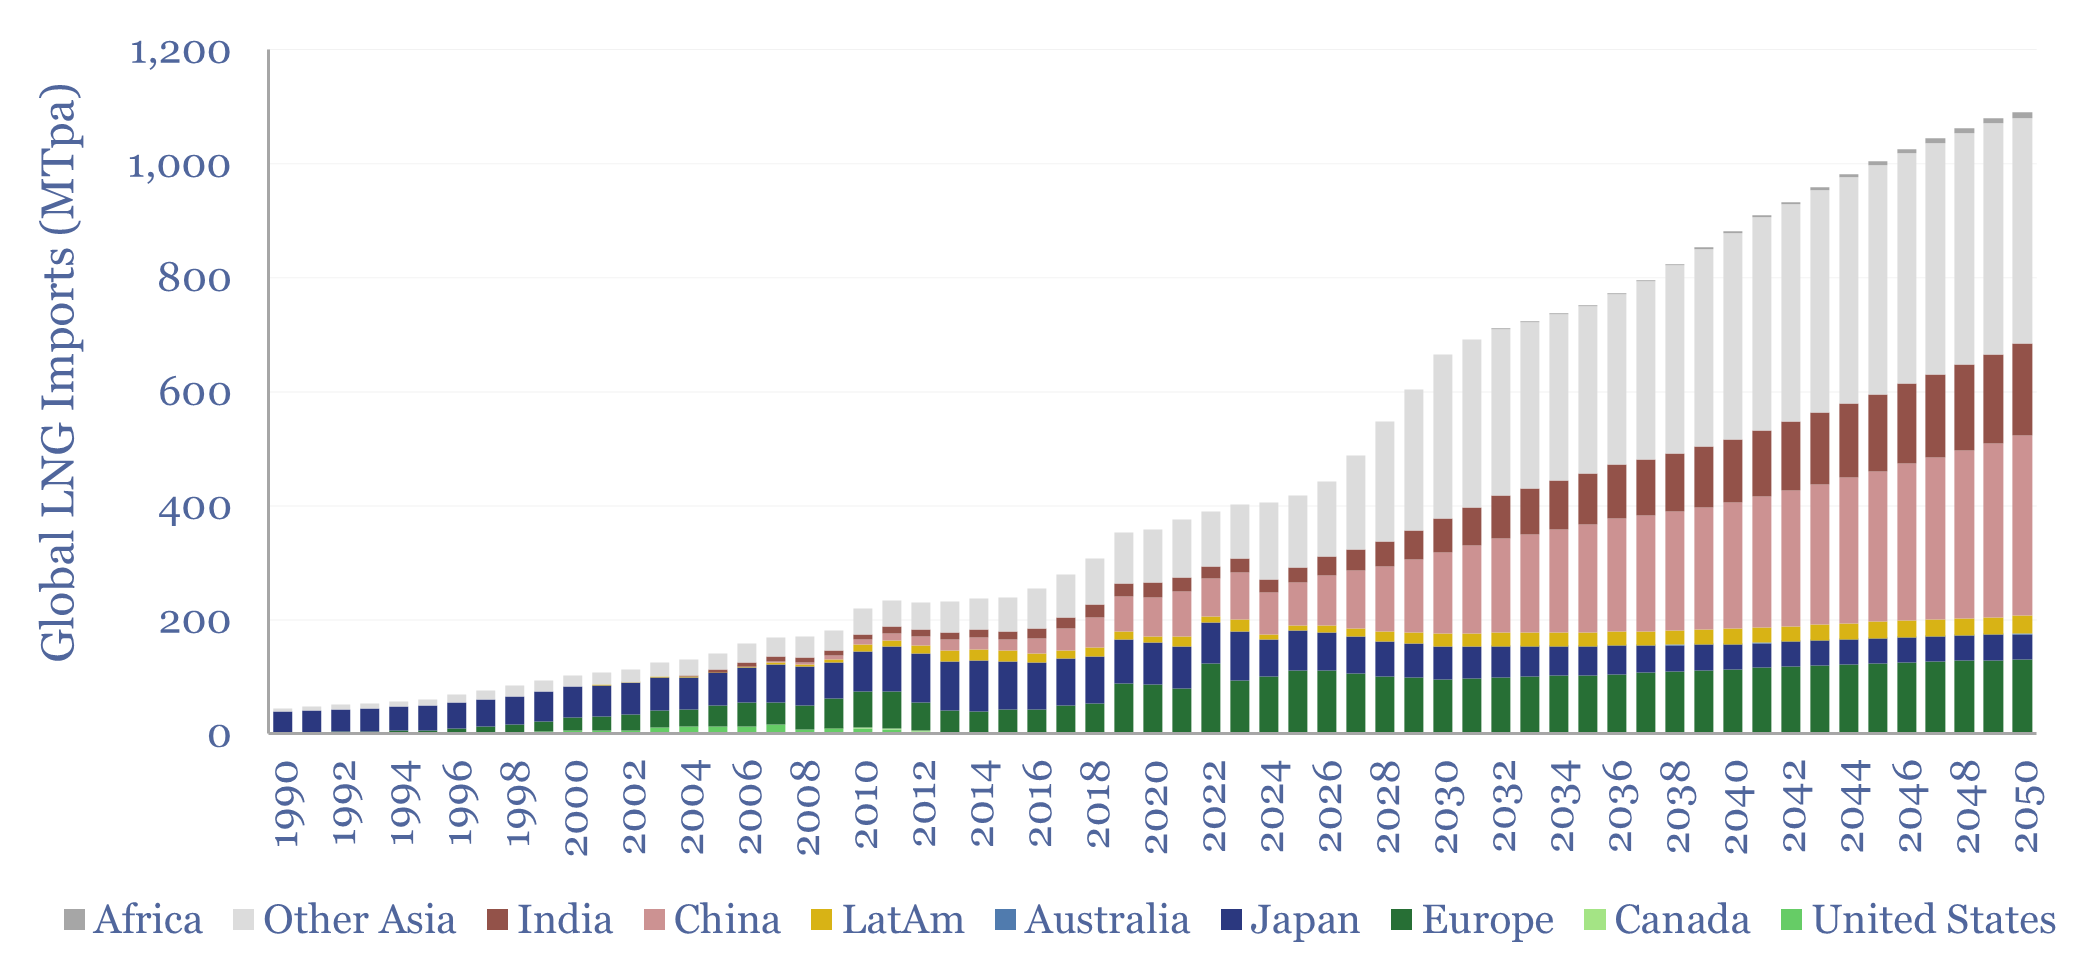
Global LNG demand would almost need to treble to meet this ramp-up, linking to our model of global LNG supplies. Within today’s LNG market, 25% flows to Europe, 20% to Japan, and 55% to the emerging world. By 2050, the emerging world would be attracting 80% of global LNG cargoes, with the largest growth in China and India.
Our best guesses for how a doubling of global gas production might unfold are captured in this model of global gas forecasts by country/region. We no longer see coal-to-gas switching occurring primarily in the name of global decarbonization, but because of coal resource depletion in Asia.