Global energy market model for the energy transition?

This data-file is a global energy market model for the energy transition. It contains long-term energy supply-demand forecasts by energy source; based on a dozen core input assumptions. Total useful energy consumed by human civilization rises from 70,000 TWH pa to 120,000 TWH pa by 2050. 25% of demand is met by wind and solar. Another 10% is nuclear and hydro. The remaining 65% must come from decarbonized fossil fuels, which means phasing out coal, 300 TCF pa of natural gas, and 85Mbpd of oil, combined with CCS and nature-based CO2 removals, as part of the roadmap to net zero.


Global useful energy use stood above 70,000 TWH in 2021, having risen at 2.5% per year in the past decade. It will continue rising to above 120,000 TWH pa by 2050, per our breakdown of global energy demand by region.
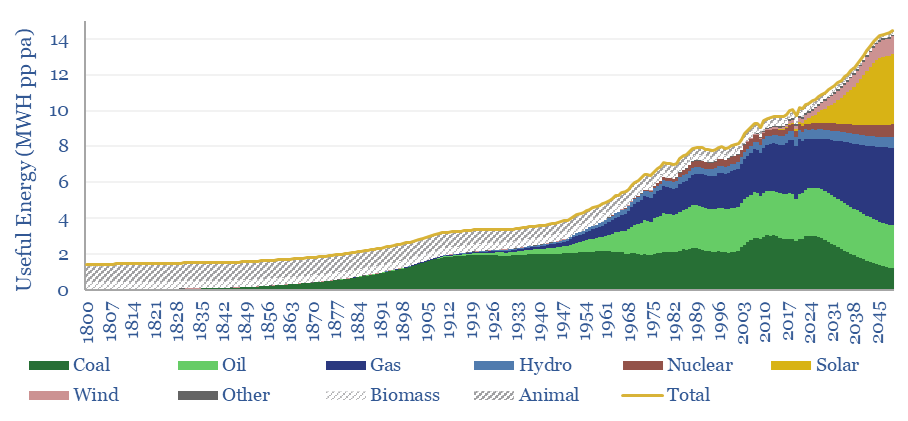
 Improving the availability of useful energy has been a remarkable driver of human progress since the Industrial Revolution.

Long term energy demand per person per year in MWH pp pa rises from 9 MWH to 12 MWH by 2050
Useful energy demand per global person rises from 9 MWH pp pa in 2019 to over 12 MWH pp pa in 2050, although this still leaves 4bn people in the emerging world with 60-80% less useful energy per capita than today’s top 1bn in the OECD.

Wind and solar comprised 10% of all global electricity by 2021, of which two-thirds is wind, one-third is solar; making up 13.5% of OECD electricity and 8% of non-OECD electricity.

Ramp renewables first. By moving Heaven and Earth, it will be possible to overcome renewables bottlenecks and accelerate renewables to provide 30,000 TWH of useful energy in 2050, or 25% of all global energy. An incredible ramp-up.

Another 10% of 2050’s energy can come from nuclear and hydro. We see an outright ‘nuclear renaissance‘ underpinning 2.5x growth from nuclear through 2050.

What about the other 65%? It is simple arithmetic. Almost 10bn people on Planet Earth will collectively be consuming 120,000 TWH pa of useful energy by 2050. 25% can come from wind and solar. 10% from other renewables. But the remaining 65% must come from somewhere, or the result will be devastating energy shortages.

(What about efficiency gains, e.g., ramping electric vehicles? Our numbers above are already being quoted on a ‘net useful energy’ basis, after deducting efficiency losses from primary energy suppliers. I.e., they are already net of efficiency factors. Interestingly, gross numbers for primary energy supplies per capita already peaked in 2019 at around 21 MWH in 2019, which is seen slipping back to 20 MWH pp pa by 2050).

Primary energy demand per global person has alraedy peaked at 21 MWH pp pa in 2019 and likely falls back to 20 MWH pp pa by 2050
Primary energy demand per global person has already peaked at 21 MWH pp pa in 2019, and likely falls back to 20 MWH pp pa by 2050, as part of our modelling.

Phasing out coal. Given the need for fossil fuels in the world’s future energy system, we should clearly prefer the cleanest and lowest carbon fuels possible, which are inherently easier to decarbonize via CCS and nature-based solutions. This means phasing out coal by 2050, with a CO2 intensity of 0.37 kg/kWh-th.

Natural gas is the crucial fuel for the energy transition. Natural gas is the lowest carbon fossil fuel, with 54% of its combustion energy coming from hydrogen in the methane molecule (CH4). Hence gas ramps by 2.2x to 300 TCF per annum in our model.

Oil demand moves sideways, rising gently to a peak of 104Mbpd in 2030, which is driven by the emerging world, then slowly declining back to 85Mbpd in 2050.

Electricity comprises 40% of the world’s total useful energy, with 28,000 TWH generated in 2021, and the remaining non-electric energy is used for heat, motion, materials. Our numbers require electrification to accelerate to 60% of 2050 energy.

This scenario is compatible with reaching “net zero” and limiting global warming to 2C. However, the fantasy of “perfect energy” must not de-rail implementation of sound energy policies. Delivering this roadmap above requires pragmatism, progress and the willingness to deploy large amounts of capital.

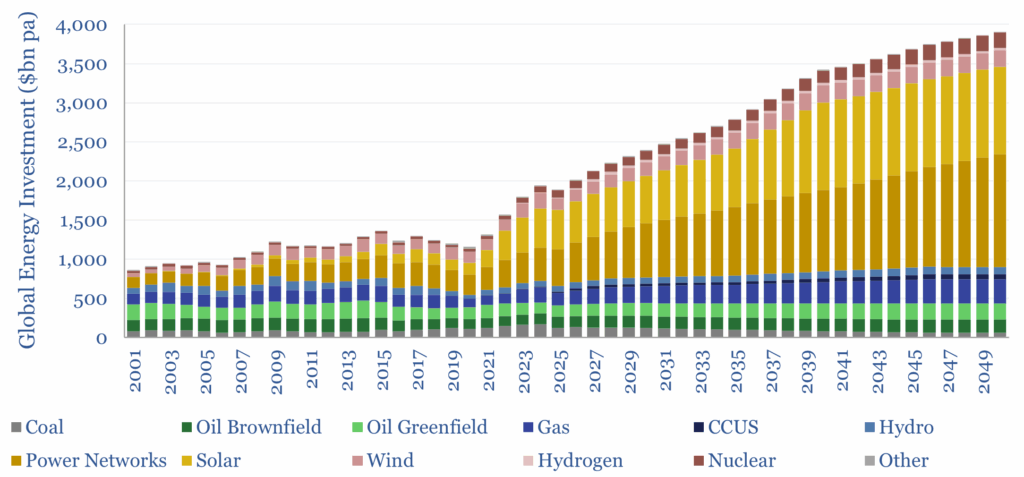
Total global investment in energy steps up from around $900bn pa in 2019 to over $4trn pa by 2050. A 5x step-up in the capital investment into wind and solar is required, and by 2040, these two energy sources must themselves attract over $1.5trn pa of spending. Capex requirements are modeled out in the data-file.

Total primary and new energies capex steps up in the energy transition from around $1trn pa to $4trn pa, across wind,  solar, oil, gas, power networkds and CCS

You can also ‘flex’ different assumptions, to see how it will affect future oil, coal and gas demand, as well as global carbon emissions. For analysts that enjoy sensitivity analysis, future energy scenarios, and stress-testing models.

Other inputs include our modelling of wind and solar capacity additions, a long-term oil demand model, gas market models, coal supply forecasts and an increasingly favorable outlook on nuclear.

Annual data are provided back to 1750 to contextualize the energy transition relative to prior transitions in history.

A fully decarbonized energy market is possible by 2050, achieved via game-changing technologies that feature in our research. To stress test different energy supply scenarios, please download our global energy market model.

Copyright: Thunder Said Energy, 2019-2024.