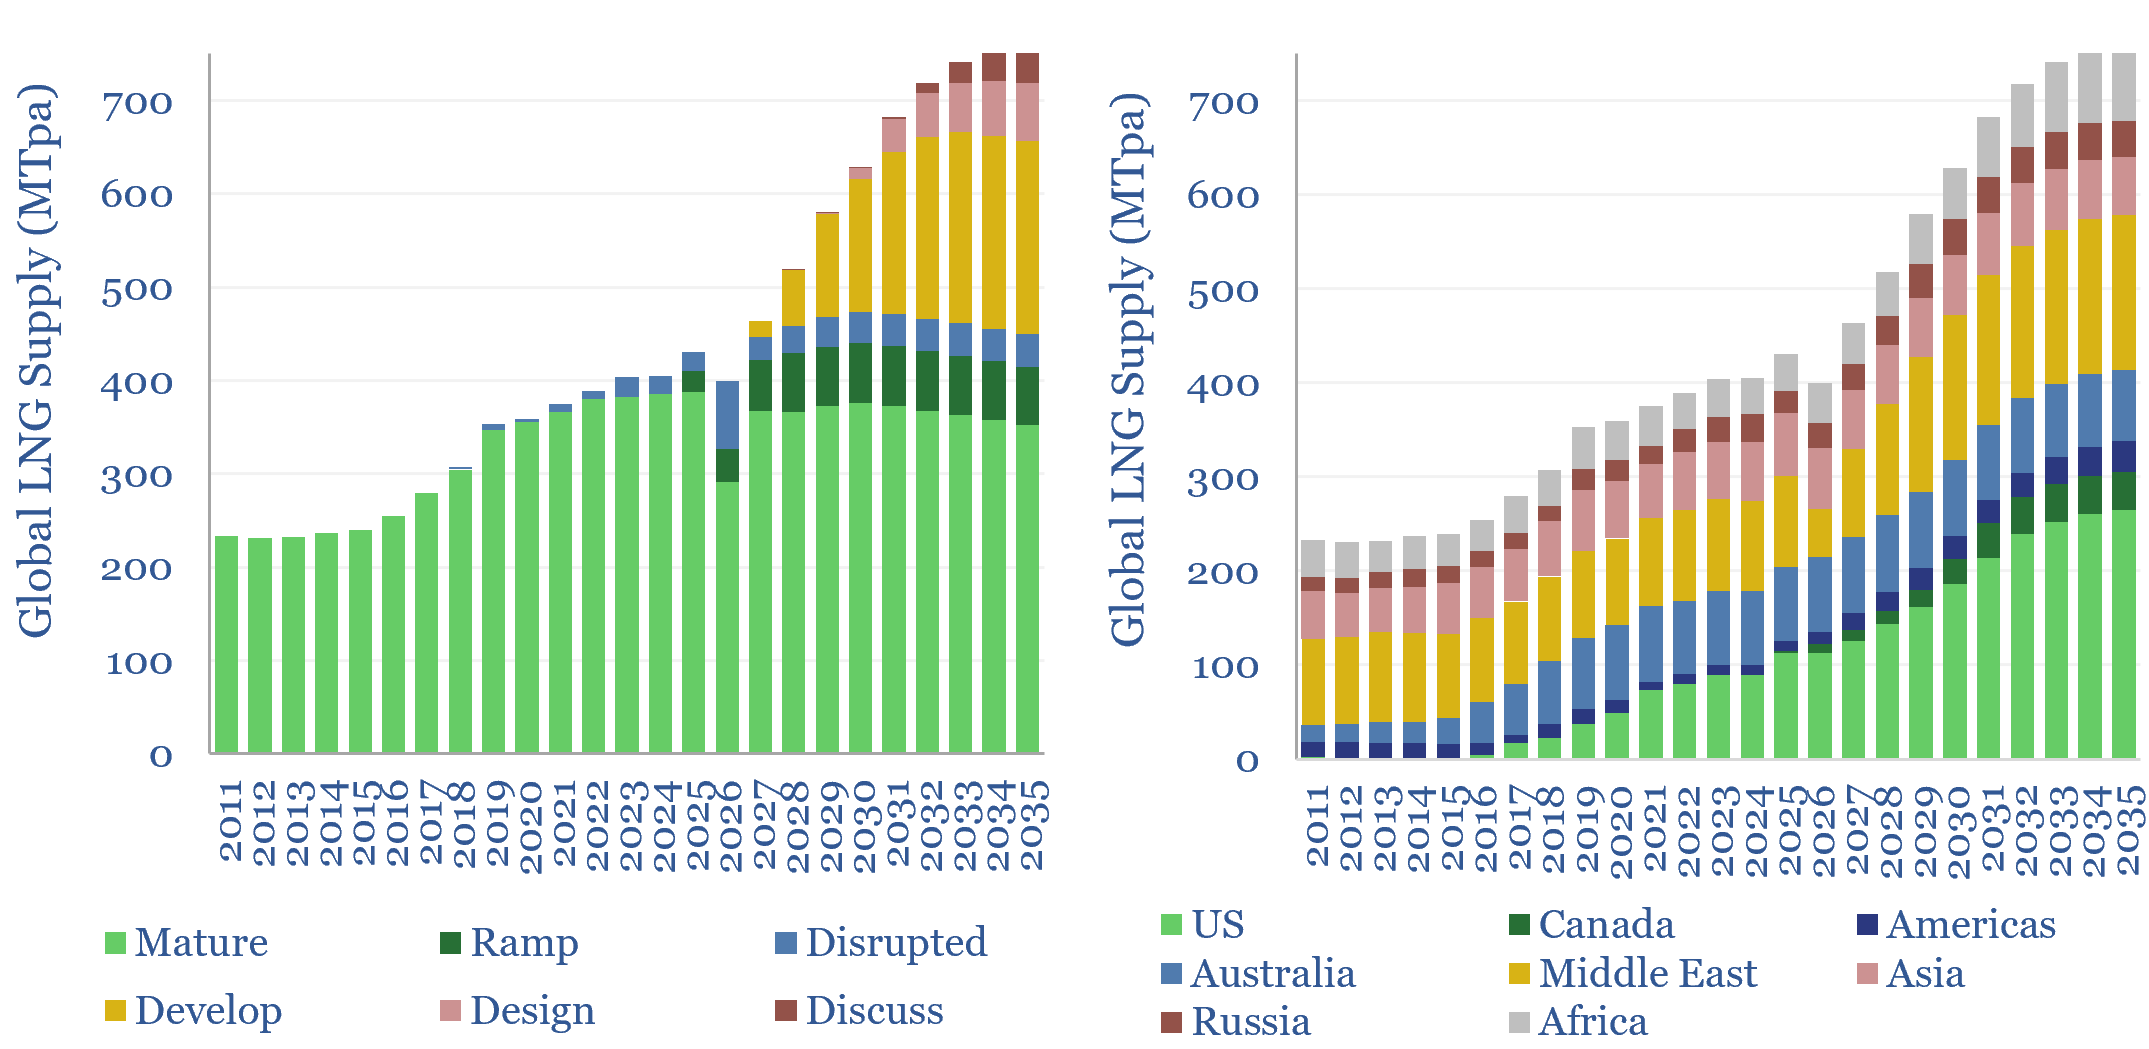
Global LNG output ran at 430MTpa in 2025. This model estimates global LNG production by facility across 200 LNG facilities and projects. Our latest forecasts are that global LNG demand will rise at a 6% CAGR, to reach 760MTpa by 2035, for an absolute growth rate of +30MTpa per year. There is a construction boom underway.
Global LNG production in 2025 ran at 430MTpa, of which 26% was from the United States, 19% was from Qatar and 18% was from Australia, as the three largest producers. Over the past decade, global LNG production has risen at +17MTpa each year.
This data-file breaks down global LNG production by facility, across each of 200 LNG plants and projects, assessing recent news flow, and then estimating their production in each year from 2018-2035. For pre-FID facilities, we ascribe a ‘risking factor’, according to their likelihood of being built.
Delays and disruptions are prevalent across our project-tracking. Out of 70 projects that we were tracking in 2024, 40% saw delays. Out of 70 projects that we were tracking in 2025, 32% were delayed and 16% were cancelled. And then conflict in the Persian Gulf in 2026 has lead to the largest LNG supply disruption in history, prompting a new focus on security of supply. This matters for our energy balances in Europe, China and Japan.
US LNG almost surpassed 110MTpa in 2025, as charted below, and will likely double to 200MTpa by 2030. Our notes and risking on each project are in the data-file. But a major theme for 2026, amidst falling shale oil output, which in turn means falling associated gas, may be the need to source marginal US gas from higher cost resources, inflating the marginal cost of global LNG to maybe $10/mcf.
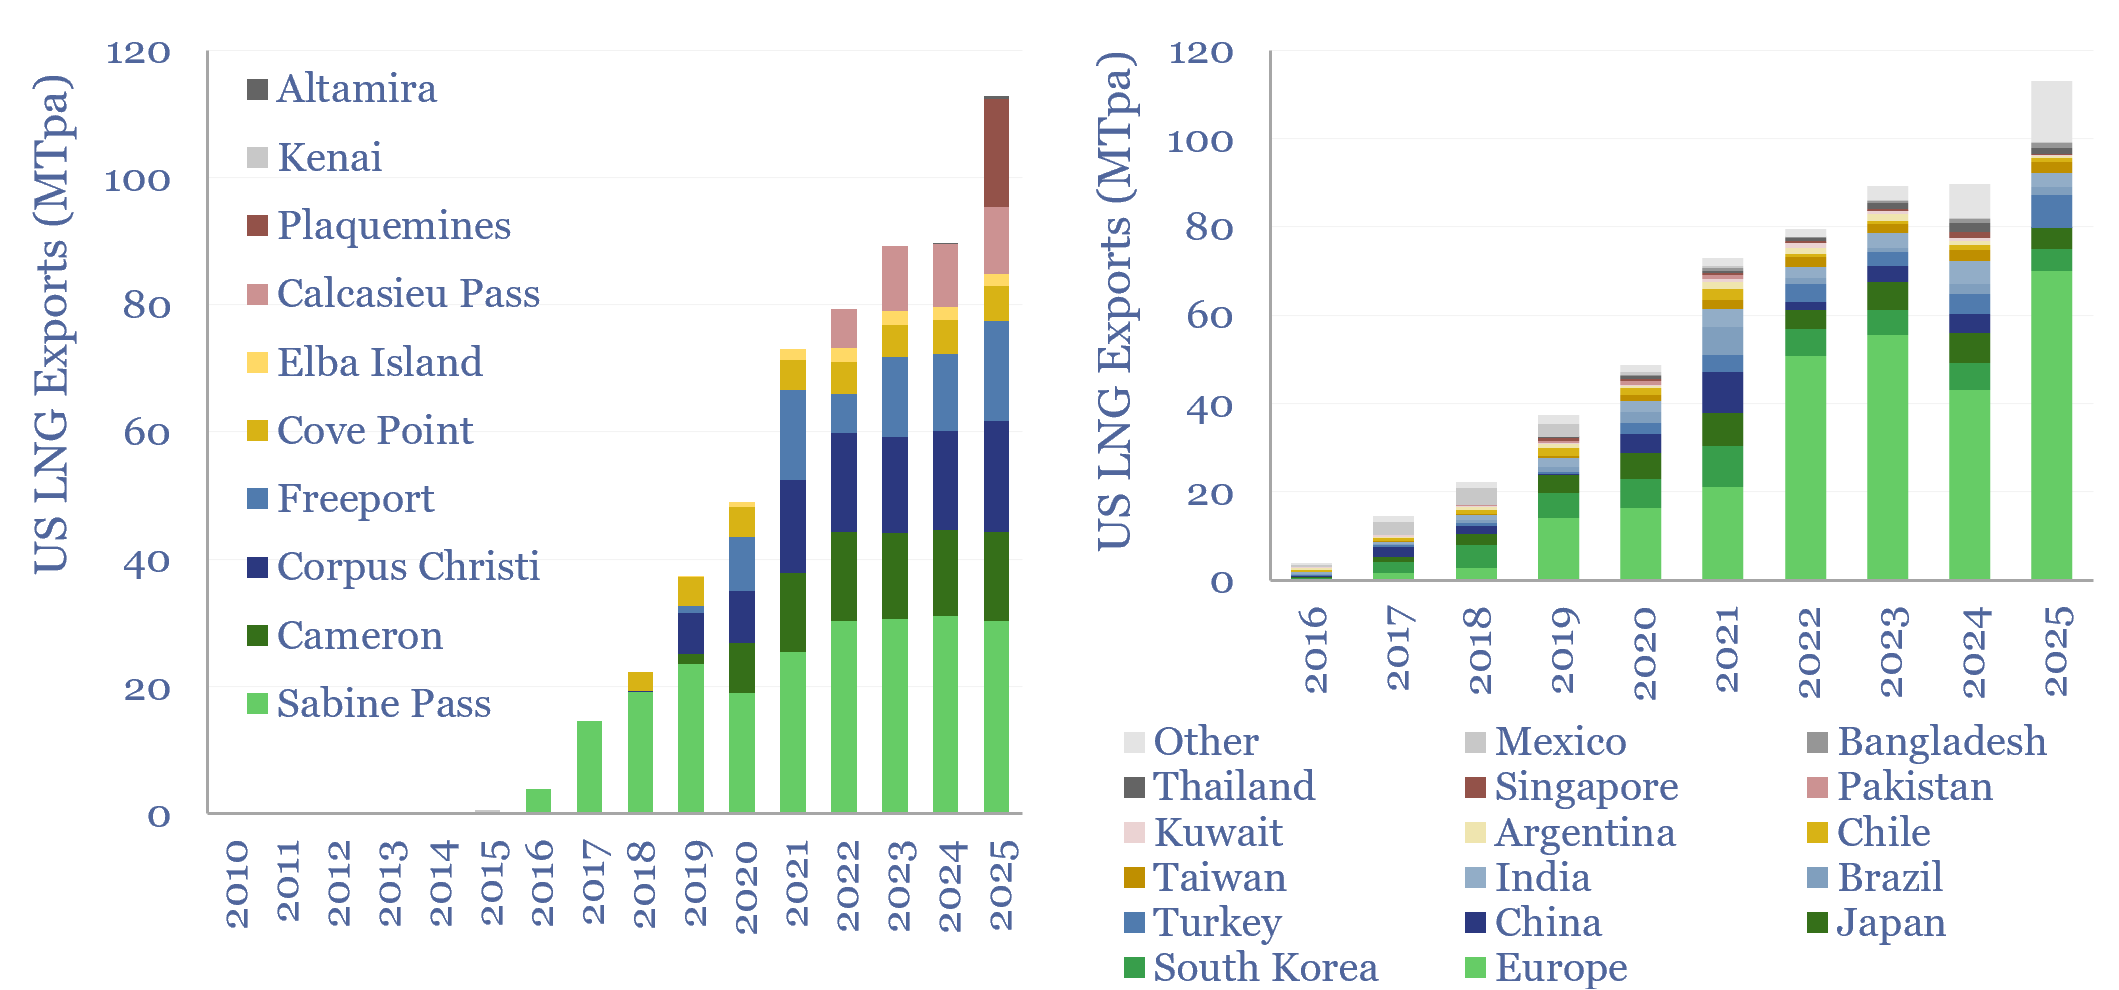
Our 2026 model updates make us wonder whether diversification is going to start emerging as a perceived benefit, in a crowded project pipeline. Hence we have seen renewed momentum in some international projects, highlighting Asian buyers’ interest in diversification: e.g., in Mozambique, Tanzania, Papua, Timor, Argentina, Oman. LNG liquefaction economics are modeled here.
Looking out longer term, we see potential for the global LNG industry to reach 1,100MTpa by 2050 as part of the energy transition. This would take LNG from 10% of global gas a decade ago, through 13.5% of global gas in 2023, to 25% of global gas in 2050. However, while we previously saw caution over signing long-term contracts and value in volatility for the LNG industry, we now see buyers craving less volatility and more stability, in order for LNG to achieve this ascent.
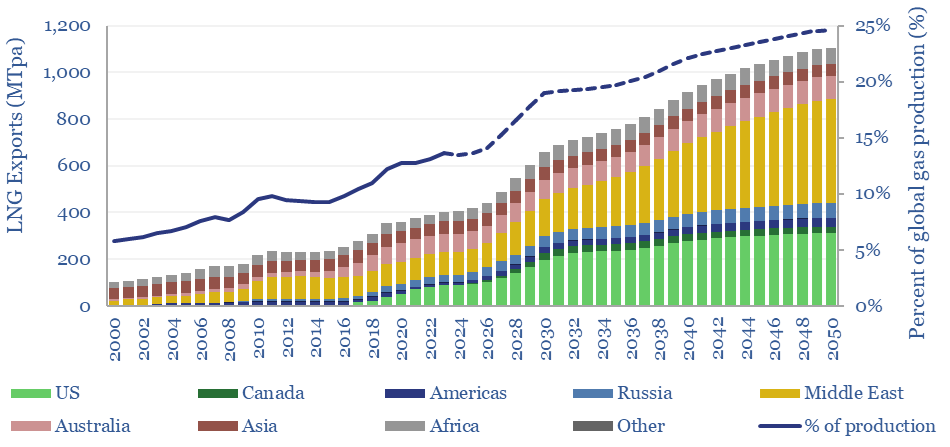
Ultimately the quest for security of supply, including via diversification, contributes to an ongoing building boom. We see global LNG capex rising from $25bn pa in the past decade to $50bn pa in the next decade, and $60bn pa in 2026-30, which particularly benefits the LNG supply chain.
Global LNG production by facility: model mechanics. This data-file of global LNG supplies works by assigning a “risking level” to each upcoming project. You can flex the output in the ProjectByProject tab to stress test “firm” supplies, various risking levels, and a “best case” production scenario. As a historical record, we have also ‘frozen’ all of our forecasts from 2022, 2023, 2024 and 2025 in the dark grey tabs. The main database covers our supply forecasts across 150 LNG facilities and projects, other project parameters, and detailed notes.