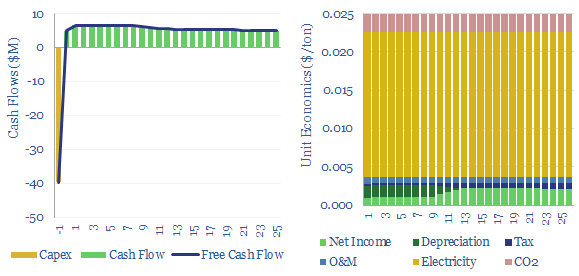
Fans and blowers comprise a $7bn pa market, moving low-pressure gases through industrial and commercial facilities. Typical costs might run at $0.025/ton of air flow to earn a return on $200/kW equipment costs and 0.3kWh/ton of energy consumption. 3,000 tons of air flow may be required per ton of CO2 in a direct air capture (DAC) plant.
Fans and blowers comprise a $7bn pa global market, moving large volumes of air for industrial and commercial purposes, at pressure closer to atmospheric pressure (up to 1.11x pressurization for a fan, up to 1.2x pressurization for a blower).
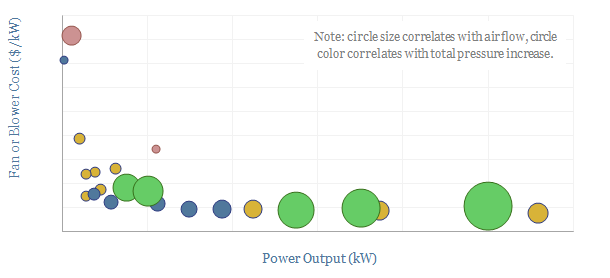
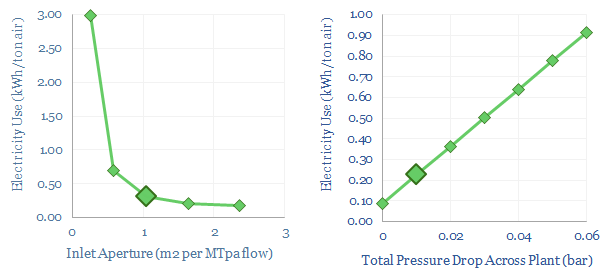
A good rule of thumb is that moving 1 ton of air through an industrial facility ‘costs’ 2.5 cents, using 0.3 kWh/ton of electricity and in order to re-coup a return on a $200/kW investment (as aggregated from equipment providers, chart below).
However, these numbers can all vary, rising considerably when there is more resistance in the system, and fans/blowers must work to overcome larger total pressure drops. The simple energy economics are that power consumption (in Watts, aka Joules per second) is a product of air flow (in m3/second) x the total pressure increase imparted to the air (in Pa, aka J/m3). In turn, the dynamic pressure rise is a square function of flow velocity.
The economic costs and energy costs of blowers and fans might sound small, but note that a direct air capture (DAC) plant will need to move something like 3,000 tons of air per ton of CO2 that is captured, which could cost $75/ton and 300-900kWh/ton of electricity just circulating air through the plant.
As a comparison, compressors typically step up gas pressures from 2-100x depending on the application, with costs around $850/kW in a $140bn pa global market today.
Underlying data into the capex, energy consumption and volumetric flow rates are tabulated in the tabs overleaf, simply aggregating public disclosures across companies supplying fans and blowers.