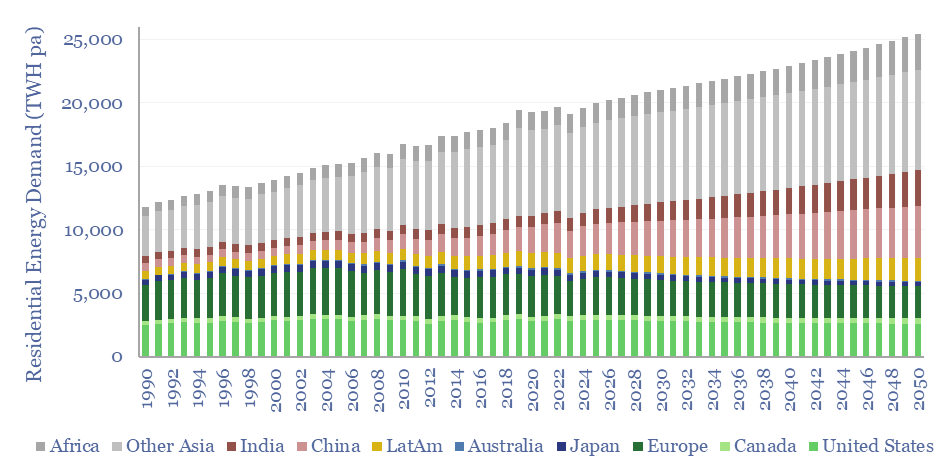
Global residential energy demand runs at 2.5 MWH pp pa, of which c40% is from electricity, 40% is gas, c13% is biomass and c7% is oil. In our gas and power models, electrification rises to 65% by 2050, to help renewables reach 50% of global electricity. Heat pumps improve efficiency and lower primary demand in the developed world.
This data-file also compiles a more granular time-series of US residential energy consumption over time, based on periodic surveys conducted every 3-7 years by the US EIA.
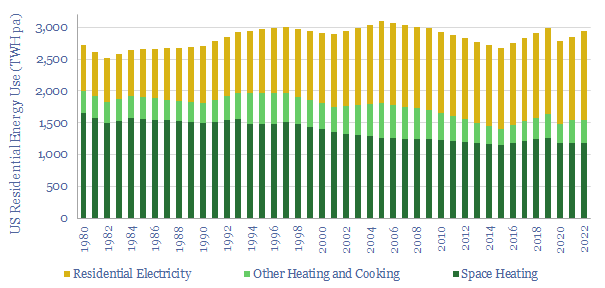
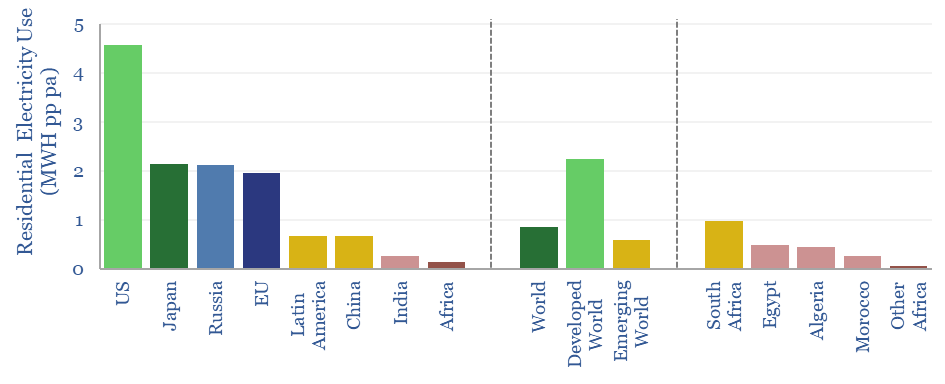
US residential energy consumption is around 3,000 TWH per annum, equivalent to 9 MWH per person per year, up on 1980 in absolute terms, but down 30% since 1980 in per capita terms.
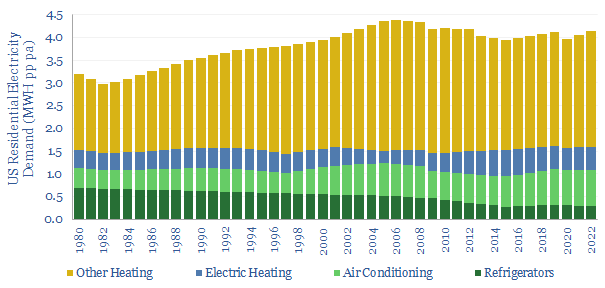
US residential electricity consumption has increased from 3 MWH pp pa in 1982 to 4 MWH pp pa in 2022.
Efficiency gains are visible in categories such as refrigeration, where electricity consumption has fallen from 0.7 MWH pp pa in 1982 to 0.3 MWH pp pa in 2022.
On the other hand, new categories of demand, such as air conditioning and other appliances, have more than offset the efficiency improvements in individual devices such as refrigerators.
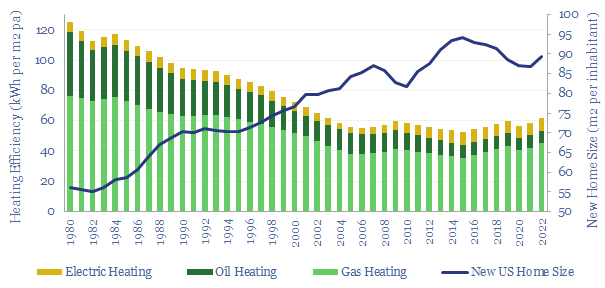
Heating demand for houses has halved from 120 kWh per m2 of living space per annum in 1980 to 60 kWh per m2 of living space per annum in 2022, due to improving insulation.
However, rebound effects are also visible in this category, as new single-family homes have become 60% larger over the same timeframe.
Finally, the data-file contrasts residential electricity consumption in the US versus other geographies. Statistically, a hot tub in the Alps consumes more electricity per annum than an African village of 40 people.
Data are aggregated in the Excel file as a useful reference running back to 1980. For more, please see our research into rebound effects and Jevons Paradox and our overall US energy supply demand model.