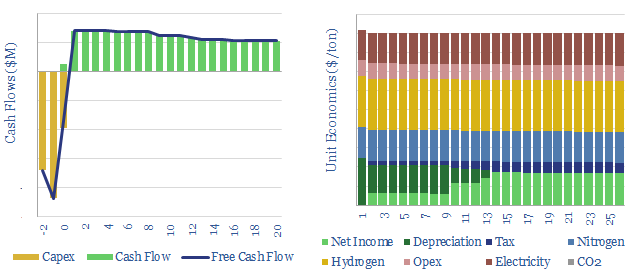
This data-file captures ammonia production costs and energy economics, starting from inputs of hydrogen and nitrogen, using the Haber-Bosch process. Our base case is $400/ton NH3 and 2.4 tons/ton CO2 intensity. This matters as fertilizer production thus explains over 1% of global CO2 emissions.
Ammonia production via the Haber-Bosch process was first demonstrated at scale in 1914, reacting N2 with H2 in a dedicated facility, at 300-500C temperatures and 10-20Mpa pressures, using a reduced magnetite (Fe3O4) catalyst.
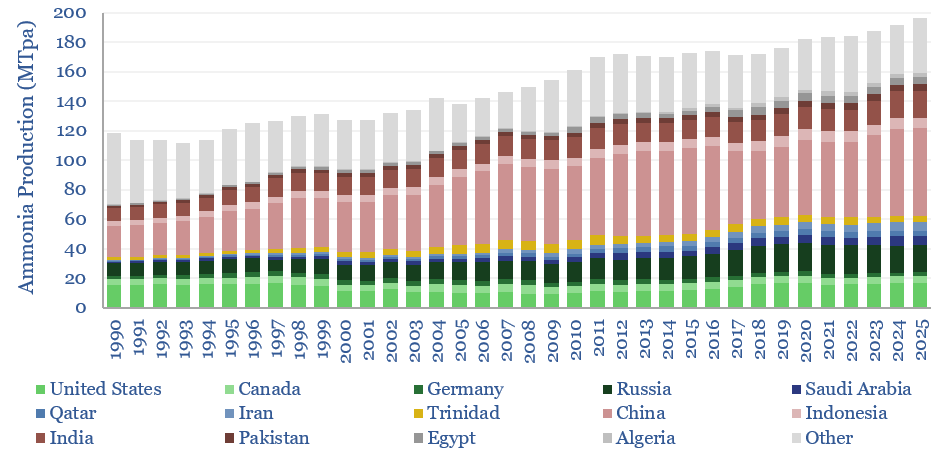
Global production of ammonia has grown by 60x since WWII, and 1.5% per annum over the past thirty years, to reach 185MTpa in 2022. Thus it explains over 1% of global CO2 emissions. The ammonia is mainly converted into nitrogen fertilizers, such as urea, and other chemical derivatives such as nitric acid. Global production by country is disaggregated in the data-file.
The data-model captures the energy economics. Base case ammonia production costs are $400/ton NH3, in order to earn a 10% IRR at a newbuild facility, costing $650/Tpa in capex, and drawing on grey hydrogen inputs costing $0.8/kg.
Ammonia production costs can be stress-tested in the data-file, including by varying the ammonia price ($/ton), nitrogen price ($/ton), hydrogen type (grey, blue, green), hydrogen price ($/kg), material losses (%), electricity usage (kWh/ton), electricity prices (c/kWh), CO2 prices ($/ton), capacity (kTpa), utilization rates ($), capex costs ($/Tpa), other opex ($/ton) and tax rates (%).
Ammonia production costs can realistically range from $200-1,000/ton, depending on how these variables are stress-tested, with the upper bound describing a facility that is impacted by gas shortages and forced to pay $20/mcf for input gas. Natural gas price sensitivity is stress-tested in a backup tab in the model.
CO2 intensity of ammonia production averages 2.4 tons per ton, in a new facility fueled by natural gas heat and power. This is our base case for grey ammonia, built up line-by-line in the data-file. Although emissions from coal-fired facilities will be higher. And there are opportunities emerging to decarbonize ammonia.
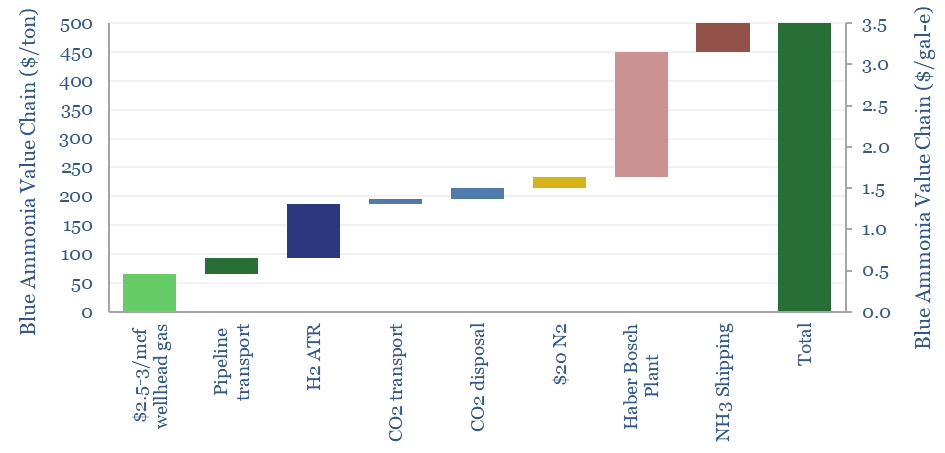
Blue ammonia. There is a growing opportunity in blue ammonia, which reduces total CO2 intensity by approximately 80% across the entire value chain. We have compiled a separate database of blue ammonia projects. And written a deep-dive report into where we see the best blue ammonia opportunities.
Costs of blue ammonia may be similar to grey ammonia, around $500/ton, if plants are located in areas of low feedstock costs. The data-file contains a detailed build up (below) of blue ammonia production costs, aggregating across our models of gas production, gas distribution, hydrogen production, nitrogen production, ammonia synthesis (this model), CO2 transportation, CO2 disposal and ammonia shipping. Hence you can flex the input variables and test sensitivities.
Green ammonia is also an option, although after reflecting the CO2 embedded in wind and solar projects, and the need for higher-carbon electricity to maximize utilization rates, we are not sure whether CO2 intensity is materially lower than blue ammonia. Costs are however around 4x higher than base case ammonia (e.g., in the range of $1,500/ton). This matters for affordability in regions where ammonia prices are crucial to food security.
Ammonia can be used as a fuel, although we would note challenging combustion characteristics.
Please download this data-file to stress test the costs of ammonia production, blue ammonia production, and a database of blue ammonia projects.