This data-file captures a sample of 30MTpa of blue ammonia projects from 1980 to 2030, including their location, companies, timings (year of FID, year of start-up), their sizes (in MTpa), their CO2 reductions (in %), their capex costs (in $M, where disclosed) and the implied capex costs ($/Tpa). We have also summarized each project with 3-10 lines of text.
The concept. Blue ammonia means that a portion of the CO2 emitted while generating ammonia is captured and sequestered. Specifically, a concentrated stream of CO2 is released when reforming natural gas into hydrogen, which in turn is an input for the Haber-Bosch reaction, which produces ammonia.
We have recently written a 12-page deep-dive report, outlining where we see the best opportunities for blue ammonia (note here), across fertilizers, feedstocks and fuels. The report draws on this screen of blue ammonia projects.
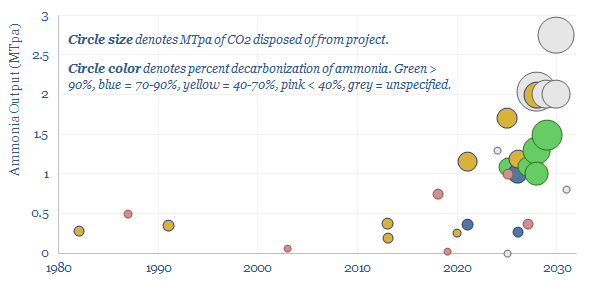
The history is that ten past projects, going back to 1982, have produced blue-ish or blue-grey ammonia. However, the average of these projects is small (0.3MTpa) and only captures c50% of the CO2 released from gas reforming. One limitation has been the use of SMRs for gas reforming, whereas ATRs should allow higher rates of CO2 capture in the future (note here).
A growing interest in blue ammonia will see 20 further projects progress before 2030. The average of these is 4x larger, at 1.2 MTpa and aiming to capture c75% of the CO2 released from gas reforming. The most ambitious projects are above 2MTpa and/or planning to capture >90% of the CO2. The average capex costs associated with these upcoming projects is also tabulated in the data-file. And the economics can be stress-tested here.
80% of the future project pipeline is in the United States, and the majority of these projects have emerged in the past 12-months (chart below).
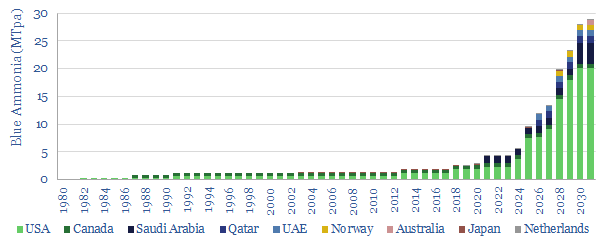
This suggests a very sharp acceleration in interest. We think the causes are reforms to 45Q regulation, as part of the Inflation Reduction Act, which effectively doubles IRRs on new projects; and the need to export more gas (in a low carbon form) from the US to geographies that may have persistent gas shortages.
This also explains the constellation of companies that feature in our data-file, from large Energy Majors, to industrial gas companies, and a group of engineering and energy service companies that will perform underlying works for this $50bn project pipeline.