How many jobs are created by different types of energy? This data-file aggregates the labor intensity of different energy sources, which average 50-150 workers per TWH, on an ongoing basis. Another rough rule of thumb is that each $1bn of capex requires 1,000 peak construction workers, although some project categories are materially more labor intensive than others.
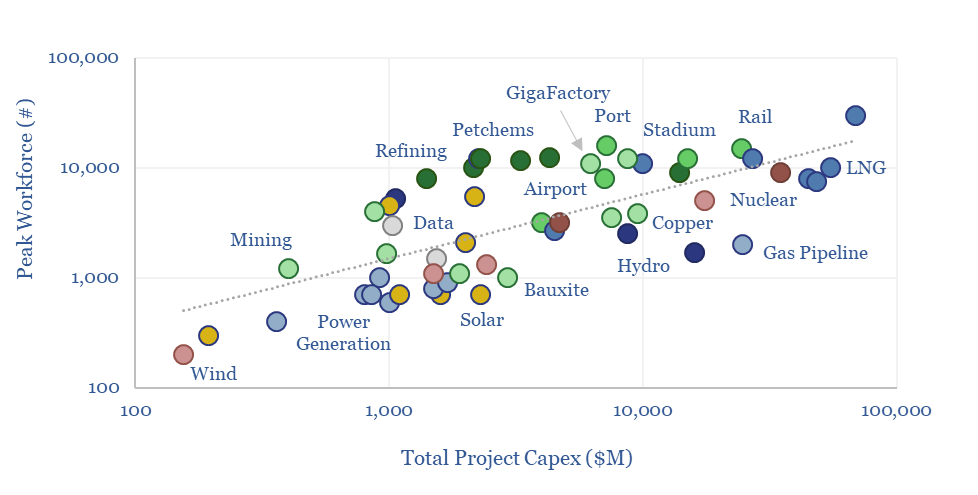
The average megaproject in our database costs $6bn and uses a peak workforce of 5,000 employees, which at $100k pp pa, explains $1.5bn of capex. World-scale construction companies manage this labor force and earn a further margin for their efforts, bringing construction to c40% of a typical project’s costs.
Larger projects do tend to use more people, but the R-squared is only 33%. Project parameters have a large impact.
Wind, solar and gas generation projects are logistically easiest. The average GW-scale project here has cost $1,160/kW and required about 1,000 people. It uses highly specialized equipment, and less labor.
Global LNG projects are hardest. The average 10MTpa-scale mega-project cost $30bn (including upstream) and required 7,000 people. They require both specialized equipment and have huge labor demands.
Traditional infrastructure mega-projects are most labor-intensive, possibly employing 10,000+ people to build airports, railways, Olympic stadia. Refining and chemicals, surprisingly, are the category plotting furthest above the trendline, screening more like giant infrastructure projects than other energy categories.
Direct labor intensity of different energy sources tends to vary between 50-250 workers per TWH of useful energy. The gas industry is among the most efficient power sectors, providing 100 jobs per TWH of useful energy. Oil-fired transportation is less efficient at 140 workers per TWH, rising to 800 per TWH if you include service station staff. Underlying data are sourced from the US Bureau of Labor Statistics.
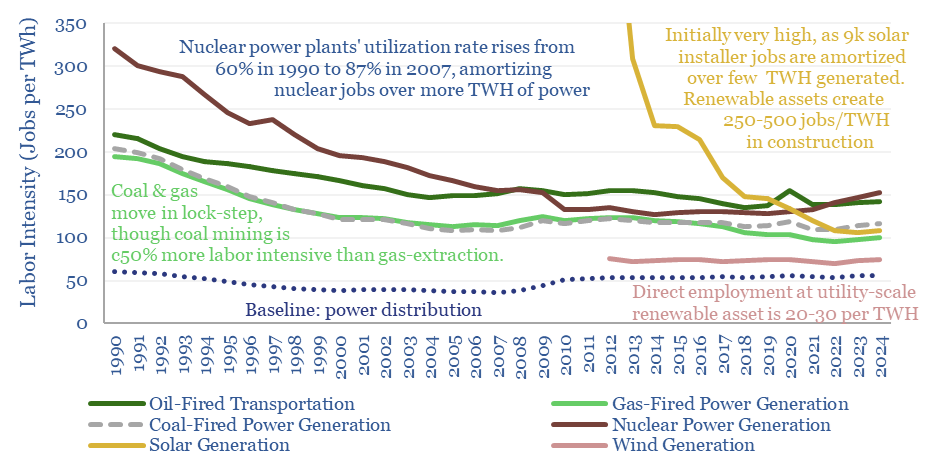
Renewables have a jagged profile. A typical wind or solar project creates 250-500 jobs per TWH during the construction phase, but only just 20-30 during the operational phase. In the short-run, expanding renewables creates jobs, but in the long-run, it destroys them?
One observation is that different stakeholders often have different ambitions over labor intensity of different energy sources. Investors and consumers often prefer less labor-intensive projects, as they are more economical. However policymakers seem to prefer more labor-intensive projects, in order to promote employment.