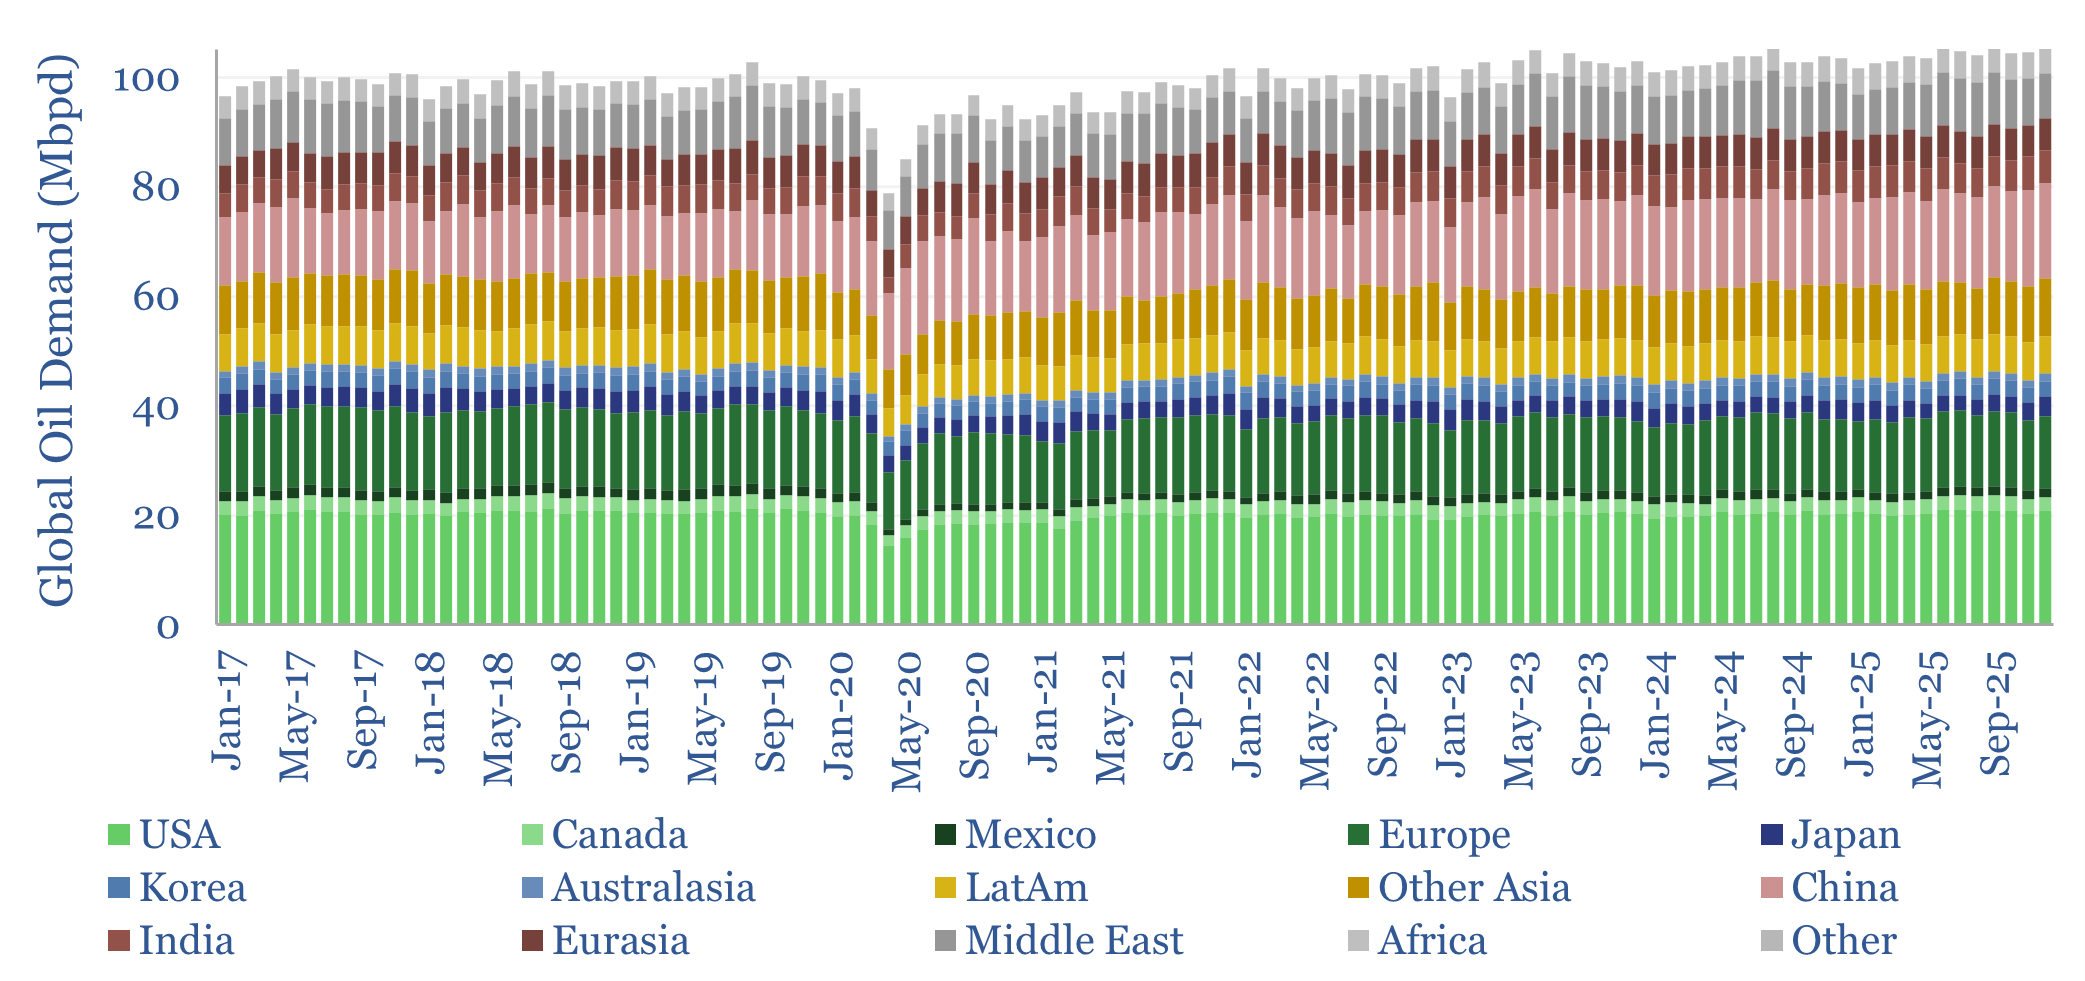
This data-file breaks down global oil demand, country-by-country, product-by-product, month-by-month, across 2017-2025. Global oil demand ran at 104 Mbpd in 2025, for +1.0 Mbpd of growth. For perspective, global oil demand rose at +1.2Mbpd per year in the 30-years from 1989->2019, so there is not much evidence, on face value, that “peak oil is nigh”.
This data-file is a breakdown of oil demand, month-by-month, across 120 countries/regions, and 12 oil products, from 2017 to 2025, based on the helpful online resource, JODI. We have compiled and cleaned the data as a reference for TSE clients.
Overall, global oil demand fell by -22Mbpd at trough in April-2020, during the COVID Crisis; and by -9Mbpd YoY in 2020 overall. Indeed, in 2020, many commentators were thus stating that 2019 would have been the all-time peak for fossil fuels, that demand would never recover to pre-COVID levels, and that the world should therefore “stop investing” in hydrocarbons.
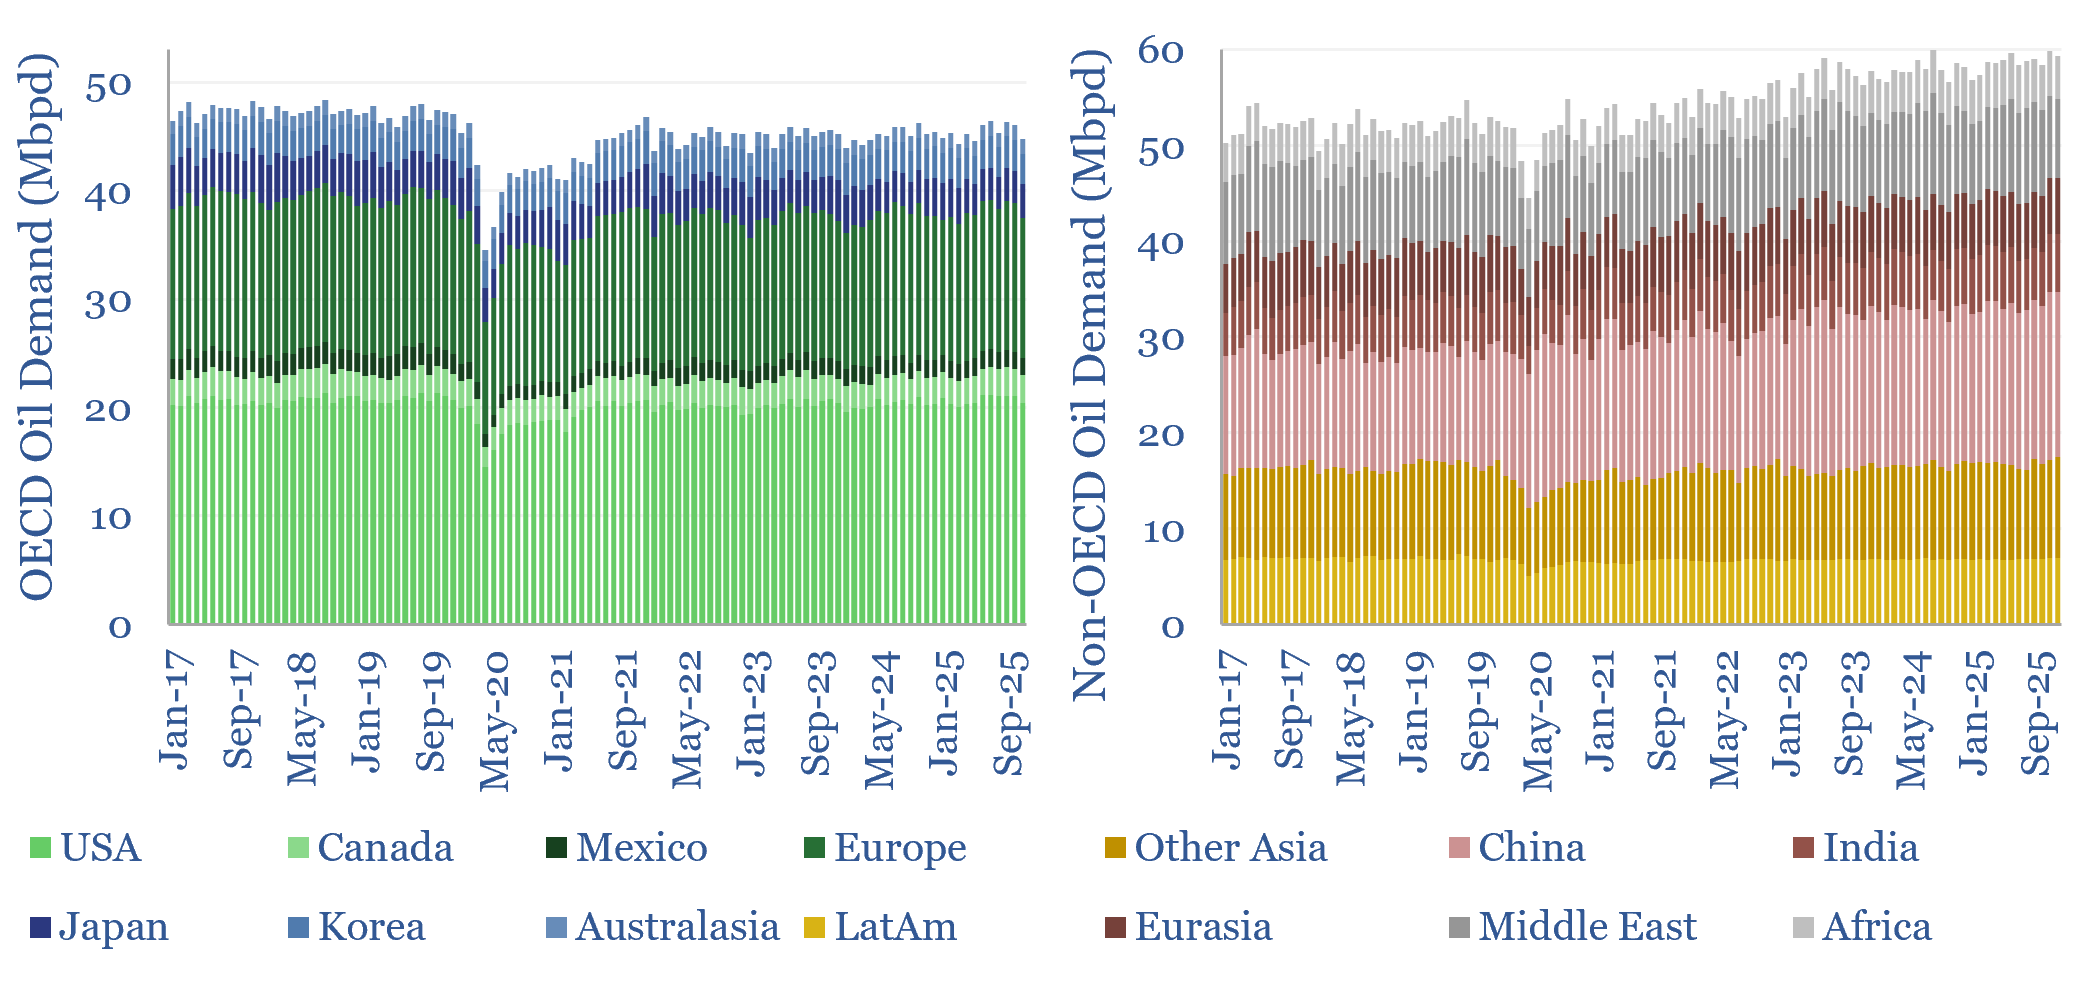
Yet in 2025, global oil demand again made another new all-time high, of 104Mbpd, which is around 4.5Mbpd higher than 2019 levels; of which +6.2Mbpd has been driven by the emerging world, while the developed world has declined -1.6Mbpd. It is worthwhile to dive into the numbers in further detail.
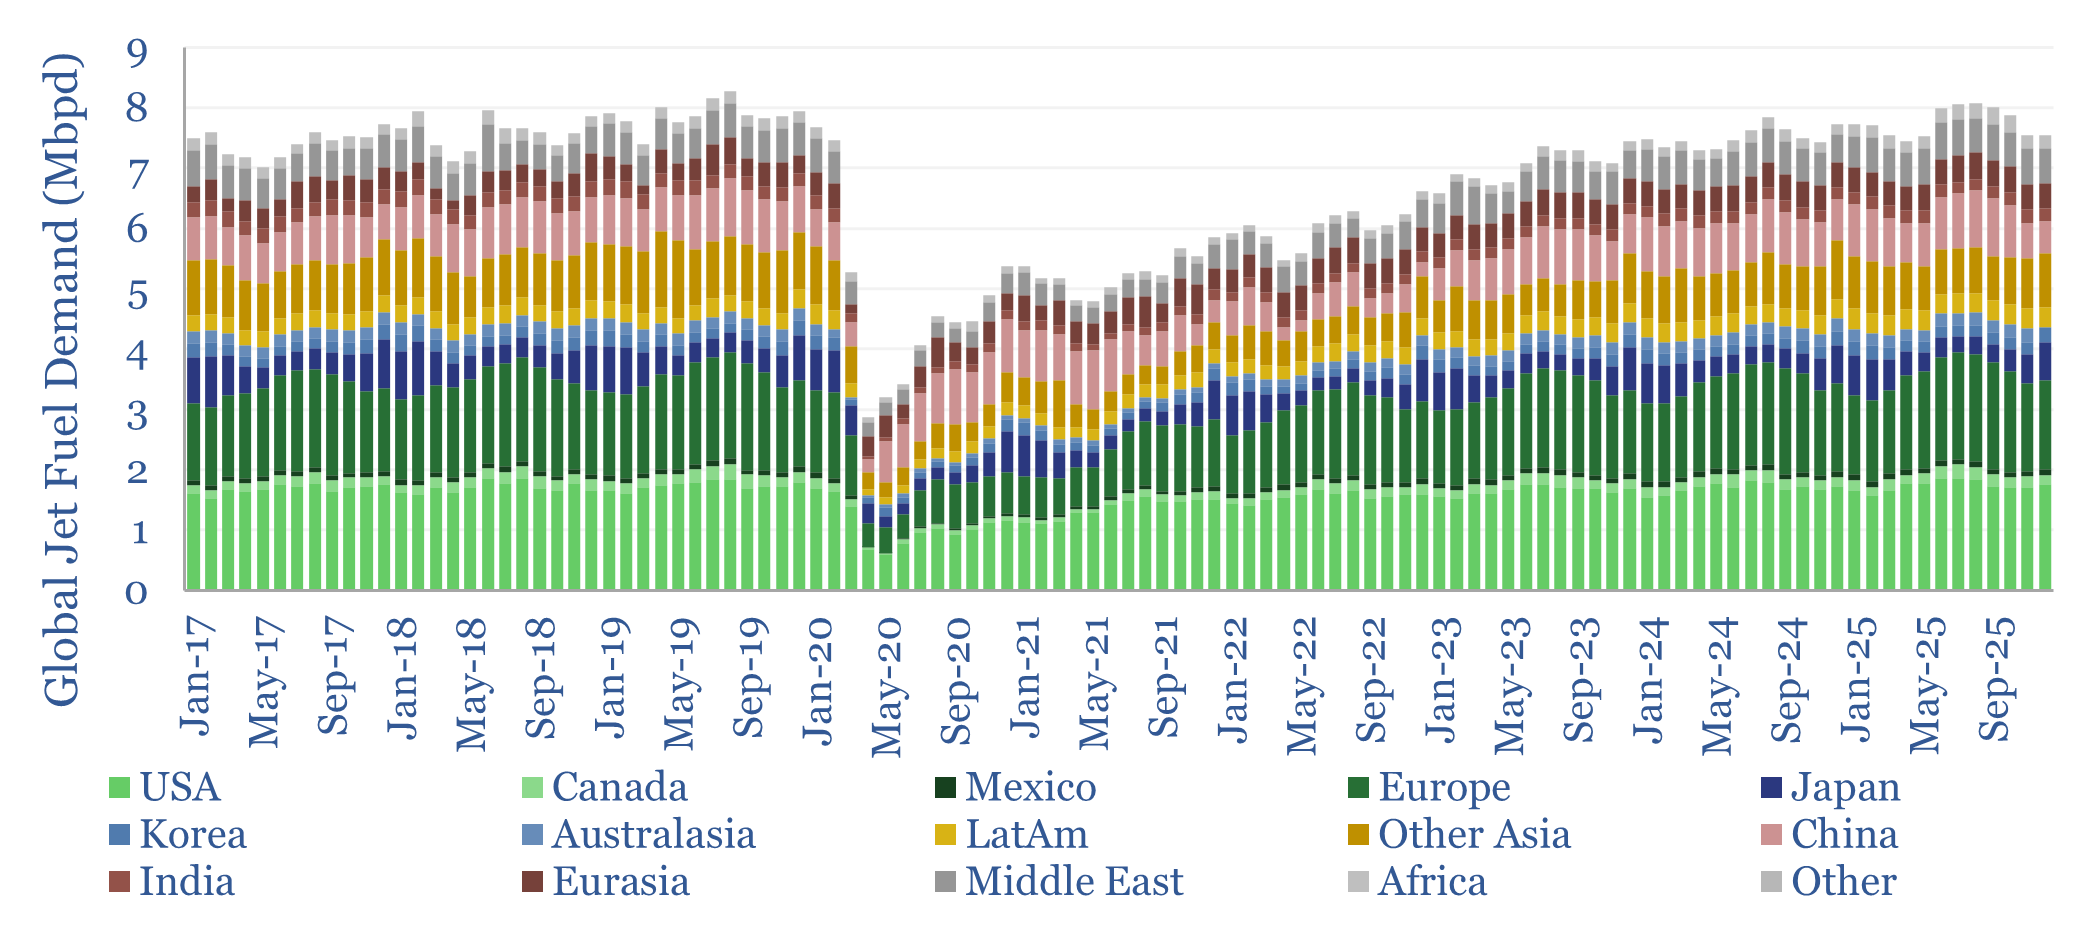
Jet fuel demand rose by +0.3Mbpd in 2025, with gains in almost every country/region in our database. For perspective, global jet fuel demand rose +0.2Mbpd in the 10-years from 2009->19 and we project +0.25Mbpd/year of growth ahead from 2025->35, in our forecasts for global jet fuel demand by region.
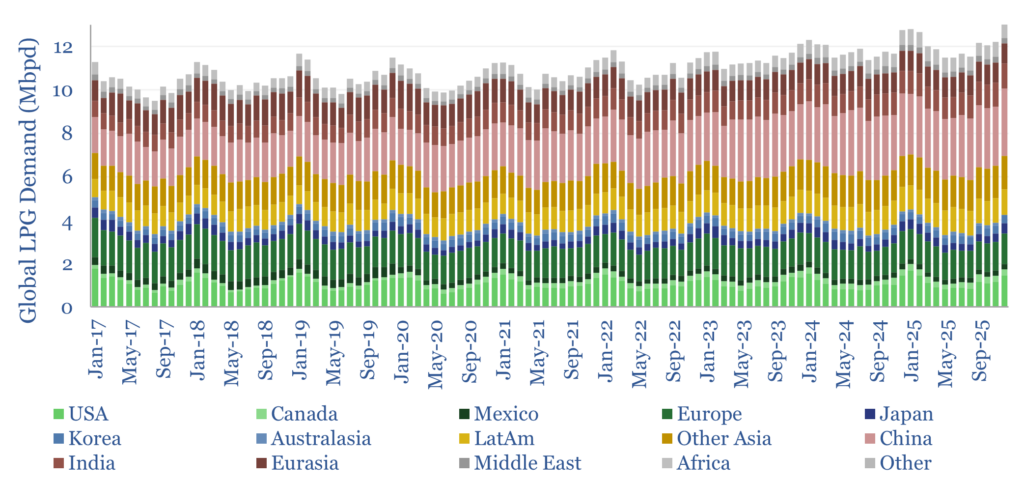
LPG demand, which is mainly for heating, also grew rapidly in 2025, rising +240kbpd YoY. This was driven by the US, India, LatAm, Africa, China and other Asia, while LPG demand fell in Europe and developed Asia.
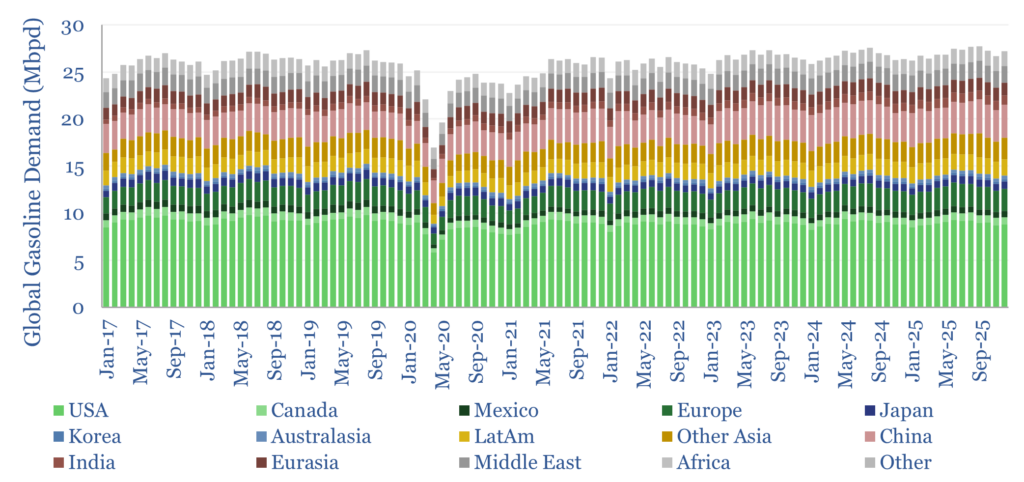
Road transportation fuels – gasoline and diesel – rose +0.3Mbpd in 2025, with gains across both the OECD and non-OECD. In the OECD we are attributing this effect to slower electric vehicle sales and suburbification. But staggeringly, demand for transportation fuels fell by -170kbpd YoY in China, which led the world in EV deployments.
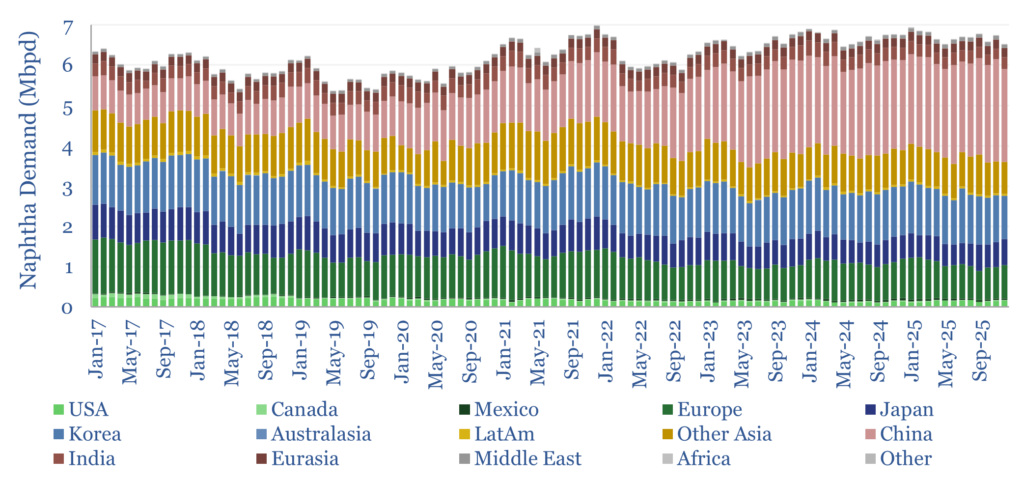
Naphtha use for petrochemicals was flat YoY in 2025, compared to a 20-year average of +90kbpd/year. We think the feedstocks for growing plastic demand are embedded in NGL and “other” categories, but likely grew by as much as +1Mbpd/year in 2025, especially in the US and China. Our forecasts see plastic demand growing +0.15Mbpd/year in the next decade. Please see our forecasts for global plastic demand in the energy transition.
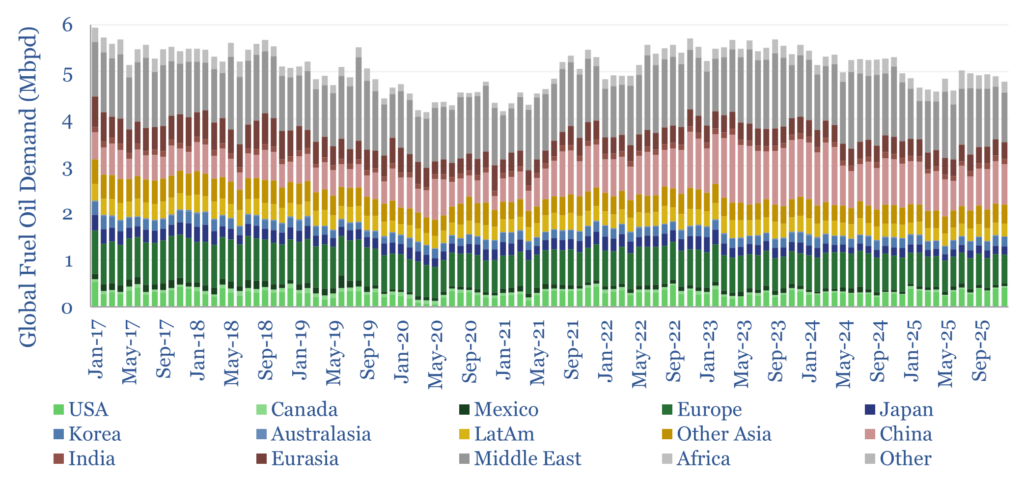
Global fuel oil demand also declined by a staggering -420kbpd YoY, especially in the Middle East and China. The world added +520GW of solar in 2025. One possible interpretation of the numbers is that c25% of this directly displaced fuel oil-fired power generation.
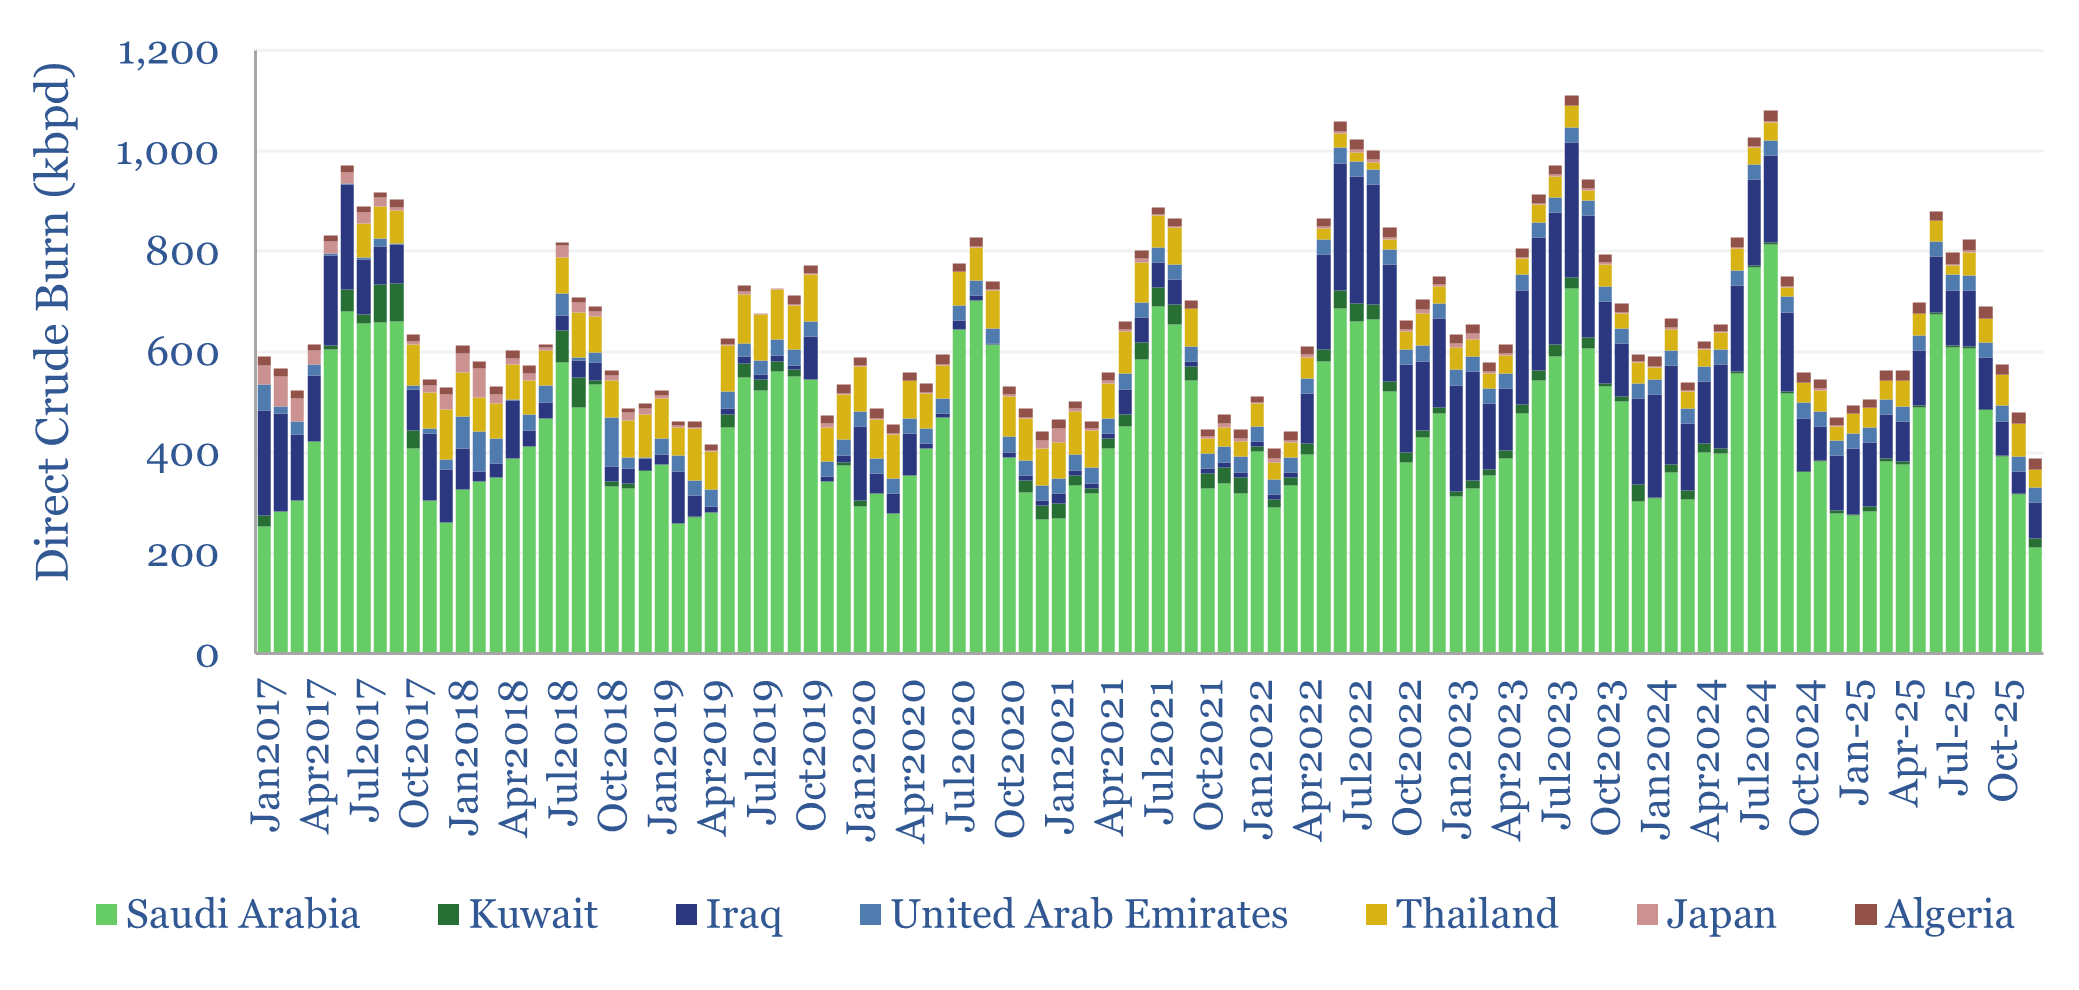
“Energy addition, not transition” is a phrase that has resonated with us recently. We are massively bullish on the potential for solar energy to transform human civilization. Yet Saudi Arabia’s direct crude burn for power generation remained at 425kbpd throughout 2025.
However, there is some uncertainty in this data-set, as the original data-source (JODI) only covers 80% of the oil market. We estimate the remaining countries by taking a proxy from “analogous countries” (the methodology is described in our original report here). There is always some guesswork involved, including for the ever-elusive “other products” category, which can be particularly erratic, especially in countries such as China.
Full details are in the data-file. Our long-term oil demand forecasts are updated here.