The flue gas of a typical combustion facility contains c7% CO2, 60ppm of NOx, 40ppm of SOx and 2ppm of particulate dusts. This is our conclusion from tabulating data across 75 large combustion facilities, mainly power generation facilities in Europe. However, the range is broad. As a rule of thumb, gas is cleanest, biomass and coal are worse, while some diesel-fired units are associated with the lowest air quality in our sample.
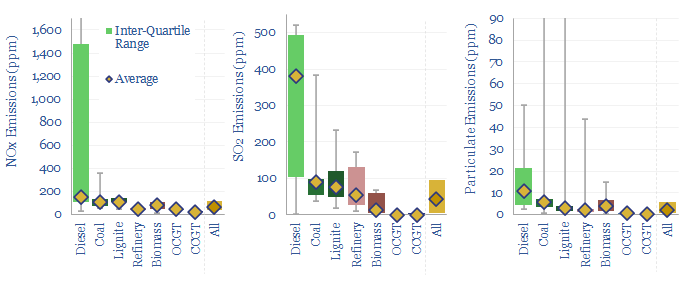
Sulphur oxides (SOx) cause acidification, in the air, in rain and in natural habitats. Hence limits are placed on the sulphur emissions in the exhaust gases of large power facilities. The limits are typically 50-250ppm in Europe, 120ppm in the US and 75-300ppm in China. We think European coal plants emit 20-400 ppm of SOx, with an average of 85ppm, which has been reduced by installing gas scrubber units in recent years. Emissions from natural gas plants are effectively nil.
Nitrogen Oxides (NOx) cause ground-level ozones and smogs to form, which can contribute to respiratory problems. Thus limits in the exhaust gases of large power plants are 60-130ppm in Europe, 90-120ppm in the US and 75-150ppm in China. We think the average coal plant in Europe emits NOx at 110pm. The numbers are highest for large diesel plants averaging 160ppm, high for biomass plants averaging 80ppm, and lowest for gas turbines averaging 25ppm at CCGTs.
Particulates and dusts are combustion products that become airborne and are later deposited on buildings, machinery, natural habitats or worst of all inhaled. Dusts are limited to 3-9 ppm in the emissions of large power plants in Europe, 17ppm in the US and 22ppm in China. The average coal plant emits at 9 ppm in Europe, due to the installation of electrostatic precipitators and other exhaust gas treatments. Again, biomass and diesel plants can have high particulate emissions. Gas fired power plants seem to have particulate emissions well below 1ppm.
Underlying data on different power plants are broken down in this data-file. Note that European databases report estimated SOx, NOx and particulate emissions for large combustion facilities in tons, but we have applied our own back-of-the-envelope conversion factors, to translate the data into ppm and mg/m3 emissions intensities.