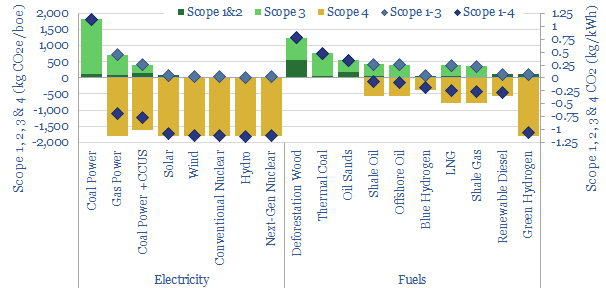
This database aims to calculate the Scope 1, 2, 3 and Scope 4 emissions of different energy sources, fuels and decarbonization investments, on a bottom up basis. The numbers vary vastly, from -1.25 kg/kWh to +1.25 kg/kWh, and offer a more constructive view for funding decarbonization initiatives.
Specifically, we take examples in coal, oil, gas, biofuels, wind, solar, nuclear, hydrogen, CCUS, EVs, heat pumps and forestry. Next we calculate the Scope 1&2 CO2 emissions involved in producing the energy product. Then we calculate the Scope 3 CO2 emissions involved in using the product. Finally, we deduct the Scope 4 CO2 emissions that are avoided via using this energy product versus the most likely counterfactual.
For example, generating 1 MWH of power from coal emits 1.15 tons of CO2. Generating that same 1 MWH of power from natural gas emits 0.45 tons of CO2, resulting in a net saving of 0.7 tons of CO2. Thus $1bn invested in natural gas power plants, debatably, will save over 100MT of total CO2 over the lifetime of the plant. This is actually more than the 40MT of total lifetime CO2 that will be saved by investing $1bn into wind or solar.
Looking at the numbers in these terms is instructive, as it will promote an ‘all of the above’ approach to decarbonizing global energy.
Decision-makers may wish to use numbers in the data-file to illustrate the Scope 1-4 CO2 associated with investment decisions and production. In many cases, there is a good argument that energy investments will offer net CO2 reductions on a Scope 1-4 basis.
The file calculates full Scope 1 – Scope 4 emissions of different energy sources, in kg/boe, kg/kWh, tons/ton, tons/$bn and TWH/$bn metrics for all the different energy products. We are also happy to help TSE subscription clients explore bespoke cuts of the data. We have also published back-up research on the philosophy of CO2 accounting.