This data-file aggregates granular data into US gas transmission, by company and by pipeline, for 40 major US gas pipelines which transport 45TCF of gas per annum across 185,000 miles; and for 3,200 compressors at 640 related compressor stations.
This data-file aggregates data for 40 large US gas transmission pipelines, covering 185,000 miles, moving the US’s 95bcfd gas market. Underlying data are sources from the EPA’s FLIGHT tool.
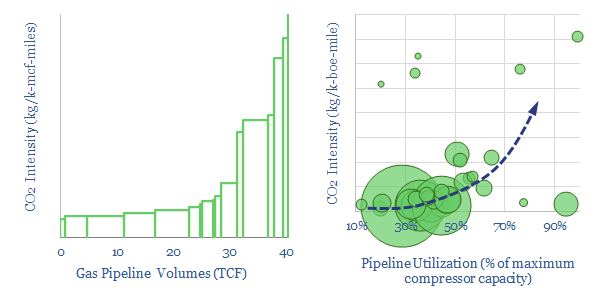
Long-distance gas transmission is highly efficient, with just 0.008% of throughput gas thought to leak directly from the pipelines. Around 1% of the throughput gas is used to carry the remaining molecules an average of 5,000 miles from source to destination, with total CO2-equivalent emissions of 0.5 kg/mcfe. Numbers vary by pipeline and by operator.
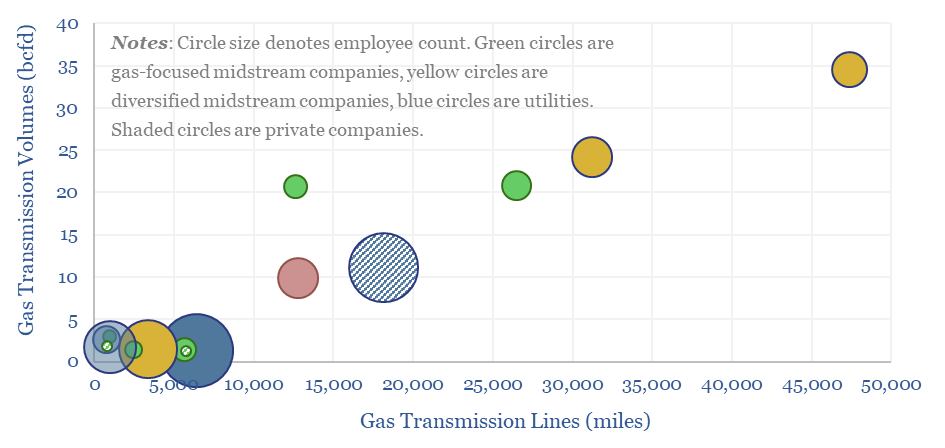
Five midstream companies transport two-thirds of all US gas, with large inter-state networks, and associated storage and infrastructure.
The largest US gas transmission line is Williams’s Transco, which carries c15% of the nation’s gas from the Gulf Coast to New York.
The longest US gas transmission line is Berkshire Hathaway Energy’s Northern Natural Gas line, running 14,000 miles from West Texas and stretching as far North as Michigan’s Upper Peninsula.
Our outlook in the energy transition is that natural gas will emerge as the most practical and low-carbon backstop to renewables, while volatile renewable generation may create overlooked trading opportunities for companies with gas infrastructure.
In early-2024, we have updated the data-file, screening all US gas transmission by pipeline and by operator, using what are currently the latest EPA disclosures from 2022. The data-file also includes gas market volumes across 670 entities, based on Ferc 552 disclosures.
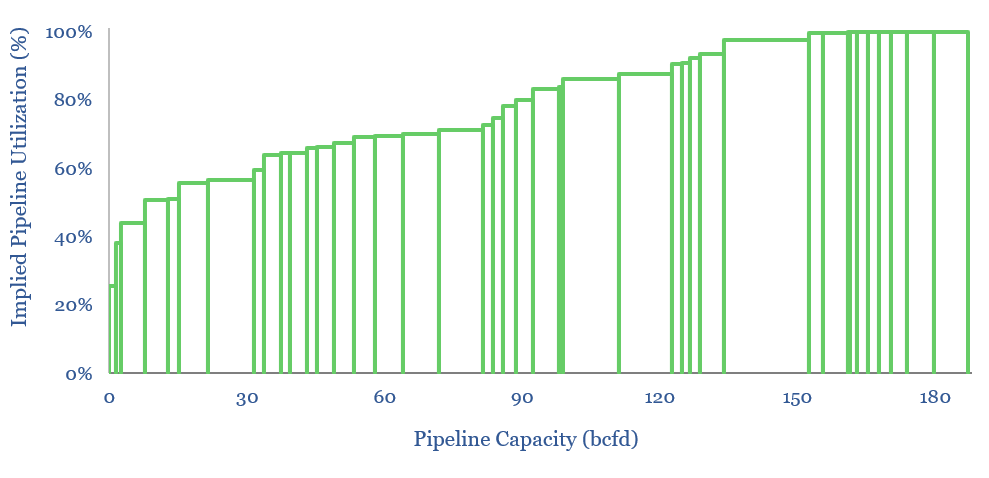
Our recent research into power grid bottlenecks and the rise of AI also leaves us wondering whether there will be increasing pipeline utilization ahead for the US gas transmission network. Hence we have also broken down capacity utilization by pipeline in the file (chart below).
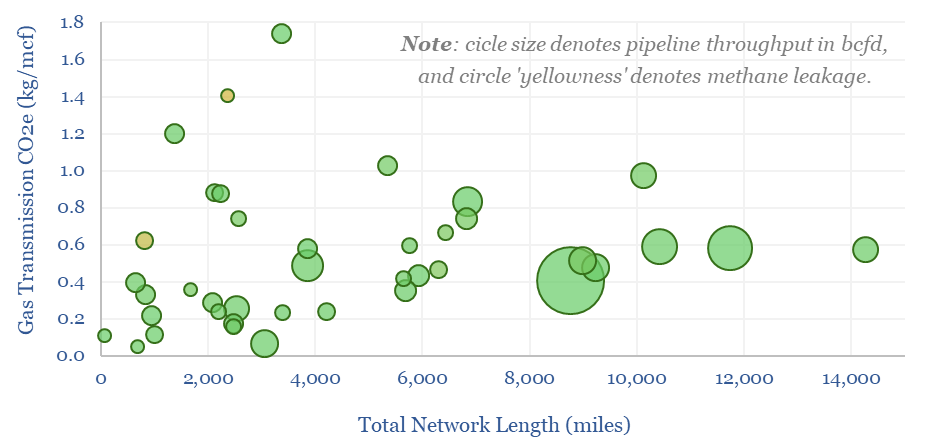
Previously, we undertook a more detailed analysis, matching up separately reported compressor stations to each pipeline (80% of the energy use and CO2e come from compressors), to plot the total CO2 intensity and methane leakage rate, line by line (see backup tabs).
US gas transmission by company is aggregated — for different pipelines and pipeline operators — in the data-file, to identify companies with low CO2 intensity despite high throughputs.