
This data-file tracks Marcellus shale well productivity, by tabulating the monthly output from 13,000 wells across the Pennsylvania Marcellus, from 2015 to mid-2024. Average IP rates across the basin have risen at a 12% pa CAGR, from around 5 mmcfd in 2015 to 19 mmcfd in 2025. However, activity and productivity differ starkly by operator.
This data-file tracks Marcellus shale well productivity, by tabulating the monthly output from 13,000 wells across the Pennsylvania Marcellus, from 2015 to 2025, based on publicly available data from the Pennsylvania Department of Environment Protection.
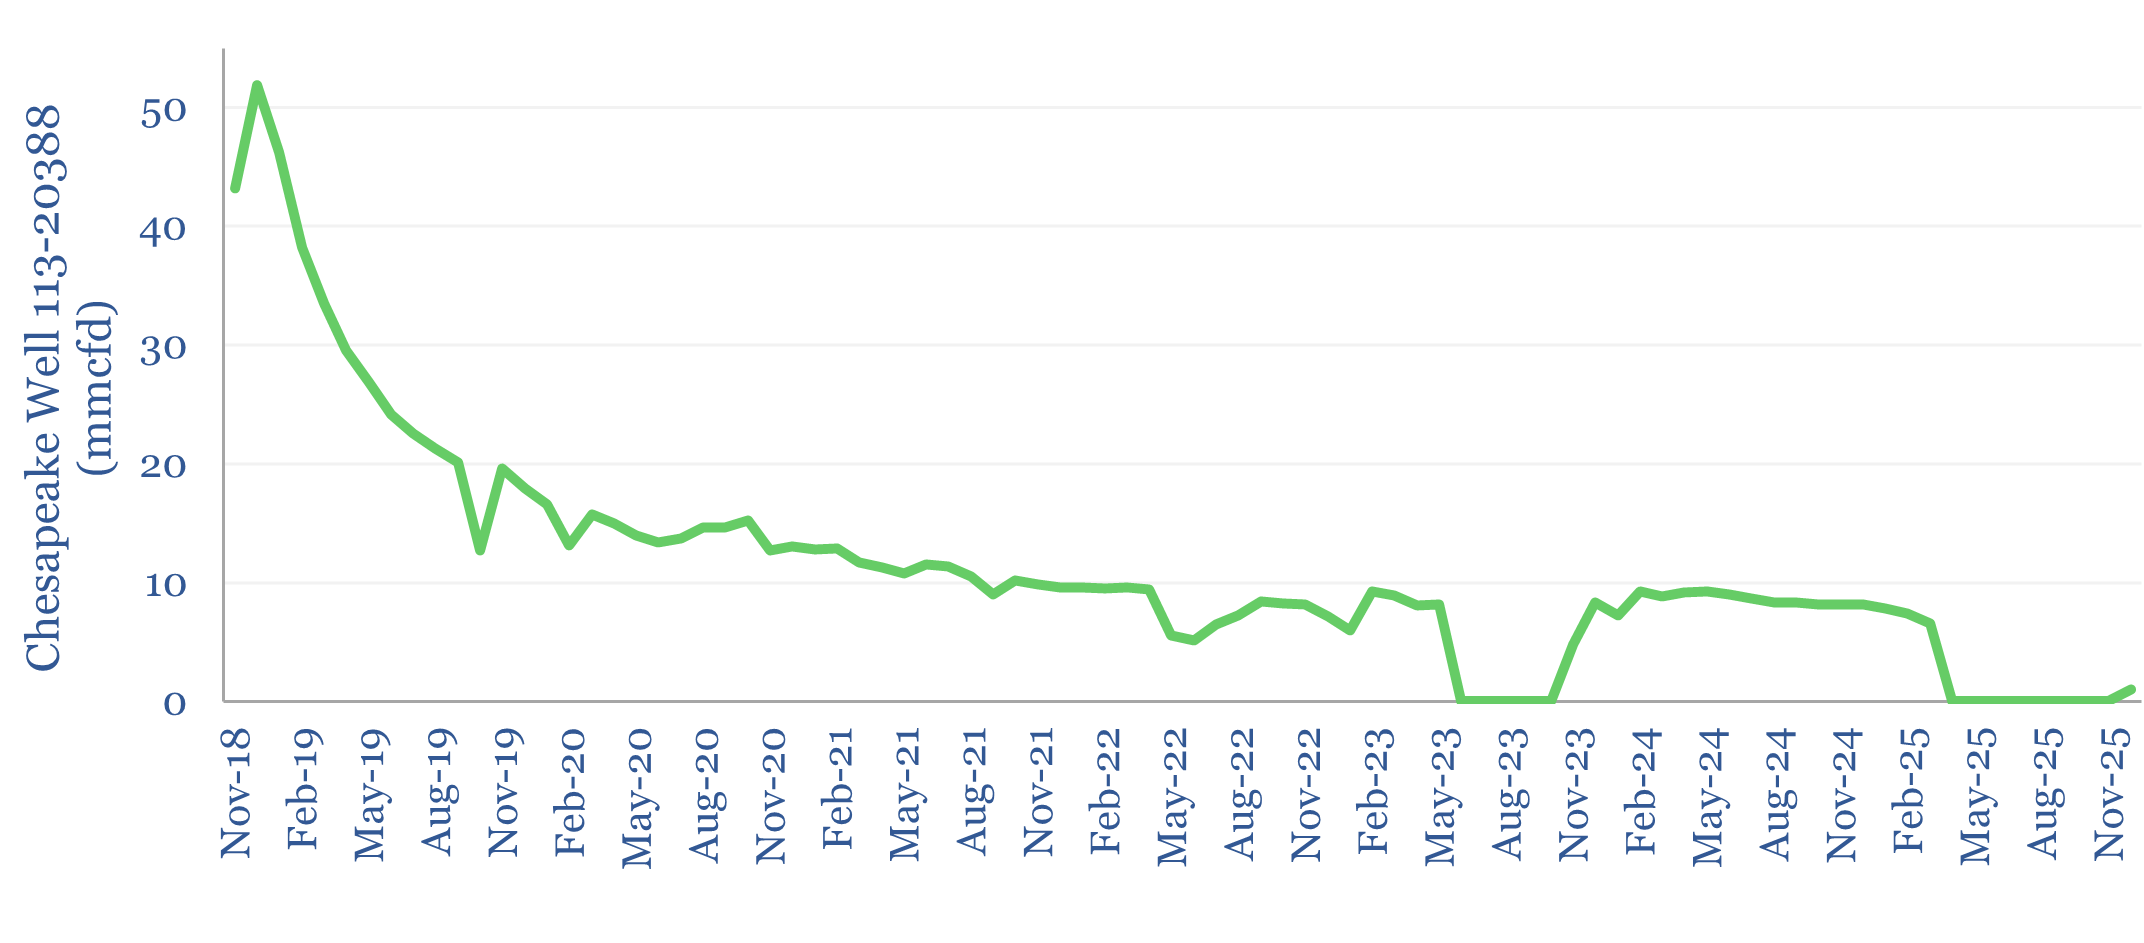
It is a very large amount of data. And it contains some absolute monster wells (example below). Production profiles are available for each of 13,000 wells, and we have also averaged the data into type curves, year by year, which informs our shale gas economics model.
Activity levels have also slowed by 50% over time, with a peak of 850 wells drilled in 2018, slowing to c400 wells in 2024 and 2025. What has enabled activity to slow down is the improvement in well productivity. Average IP rates across the basin have risen at a 12% pa CAGR, from around 5mmcfd in 2015 to 19mmcfd in 2025.
Marcellus production by operator can be tabulated by matching up each well to its operator, and then adding up and averaging the output across all wells. Hence for each operator, we have tabulated production, well stock, activity levels, average well production, IP rates.
The basin has grown more concentrated over time, with the largest six companies accounting for c60% of production in 2015, while the largest four make up c70% in 2025 (including M&A impacts). They are Expand, EQT, Coterra, and Range.
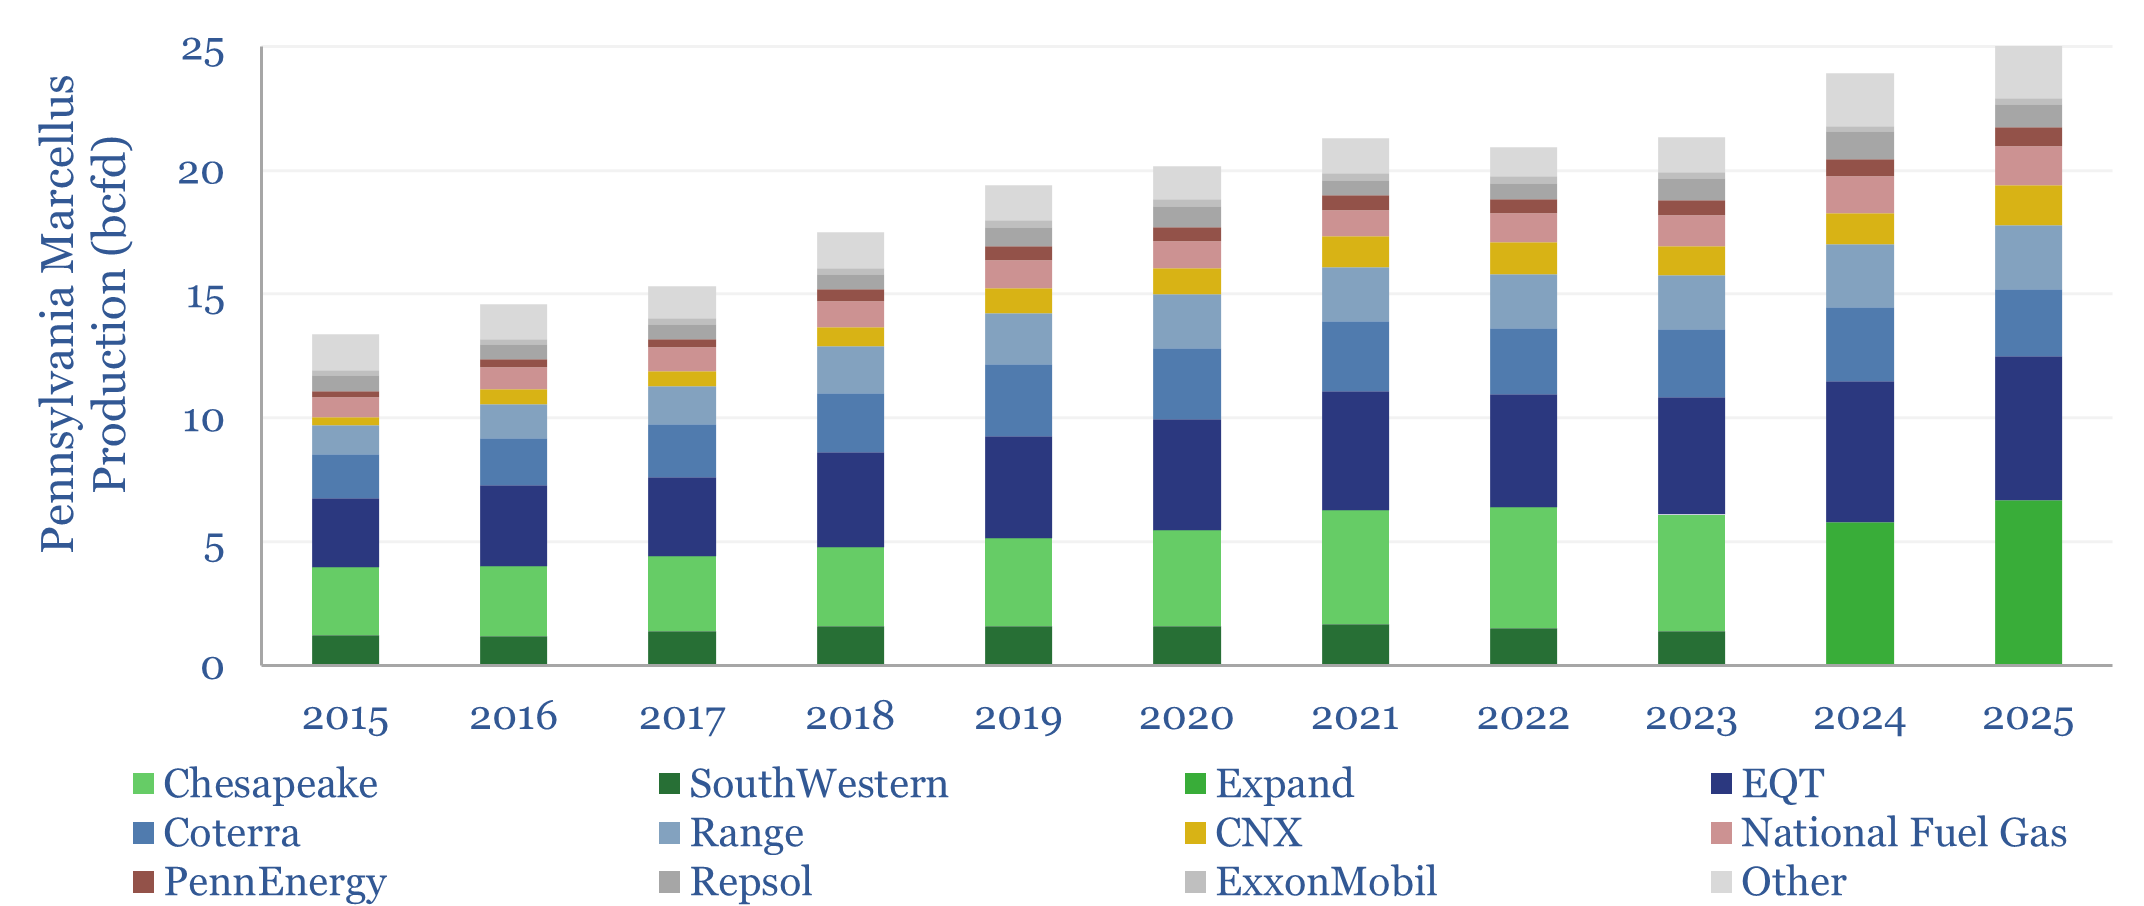
As an example of the consolidation, Rice was purchased by EQT for $8.2bn in 2017. Coterra was formed via the $9bn merger of Cabot and Cimarex in 2021. Chief was acquired by Chesapeake for $2.6bn in 2022. Chesapeake and Southwestern announced a $7.4 billion all-stock merger in January-24, thereafter re-branding as Expand Energy. In late 2024, CNX acquired Apex Energy for $505M. And in 2025 EQT acquired Olympus Energy for $1.8bn.
First tier operators are visible in the data-file. They have come to dominate as the basin consolidated, while they also achieve higher IP rates, and have been able to do more with less. Their IP rates average 30-150% higher than for the tail of c50 smaller producers.
Full data on each producer, and its Marcellus well productivity are in the data-file. We see rising demand for US gas, as part of our medium-term US gas outlook, and as captured in our US energy model.