How do commodities perform in recessions? Industrial metals are usually hit hardest, falling 35% peak-to-trough. Energy price spikes partly cause two-thirds of recessions, then typically trade back to pre-recession levels. Precious metals, mainly gold, tend to appreciate in financial crises. Data are compiled in this file, across recessions back to 1970.
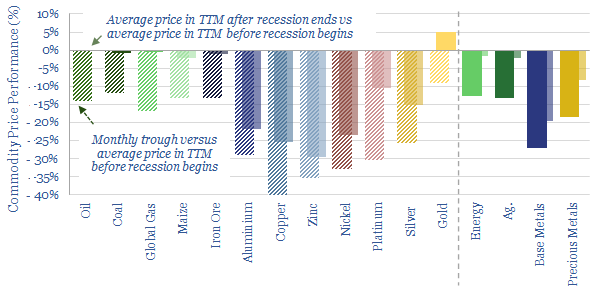
Industrial metals are typically hit hardest, declining 35% peak-to-trough and still trading -20% lower in the year after the recession ended compared to the year before it began.
Energy is more mixed, typically declining -23% peak-to-trough, but in two-thirds of the recessions, energy prices continued spiking for an average of 6-months after the recession started, suggesting that energy shortages were a cause.
Gold is an outlier. In the median average recession, real gold prices have been +5% higher in the 12-months following the end of the recession, compared to the 12-months preceding its start. Other precious metals tended to be 10-15% lower, industrial metals tended to be 20-30% lower, and energy commodities tended to be “flat”.
Each recession is unique, hence while the averages are useful, we think it may be even more useful to delve into the underlying tabs of this data-file, to review individual commodities in individual recession contexts.
The Great Recession of 2008-09 has become an archetype for asset price performance during recessions, for those of us who lived through it. However, in commodity terms, it was unusually severe. Six of the twelve commodities in this data-file experienced their worst peak-to-trough decline of any recession, while another three of the twelve experienced their second worst declines.
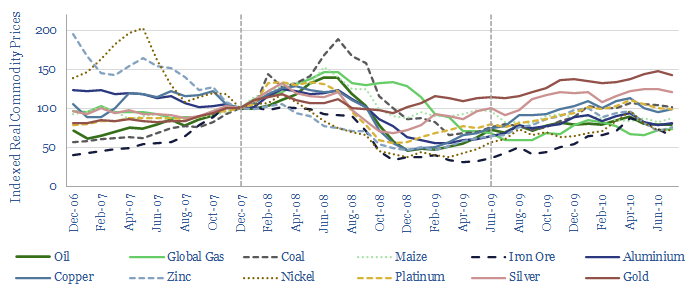
Methodology. We downloaded monthly commodity prices from the World Bank pink sheets. We then translated these nominal prices into real terms using the US CPI. Next, we downloaded a list of recession dates from the NBER. We indexed commodity prices at 100 at the start of each recession. Then we plotted the pricing performance 12-months prior to the start of the recession through to 12-months after the end of each recession. We computed three metrics for each commodity in each recession: peak-to-trough price decline, TTM average-to-trough price decline, and average pricing in the year after the recession had ended versus average pricing in the year before the recession began. Finally, we aggregated the data for each recession and took an average.
How do commodities perform in recessions? Commodities assessed in the data-file include oil, natural gas, coal, corn, iron ore (precursor to steel), aluminium, copper, zinc, nickel, platinum, silver and gold.
Recessions assessed in the data-file include the Global Financial Crisis of 2007-09, the collapse of the Dot Com bubble in the early 2000s, after the First Gulf War in the early 1990s, after the 1980+ oil shock, after the 1973-74 oil price shock, and the monetary-induced recession of 1969-70. We have also published detailed reviews into energy crisis and bursting bubbles.