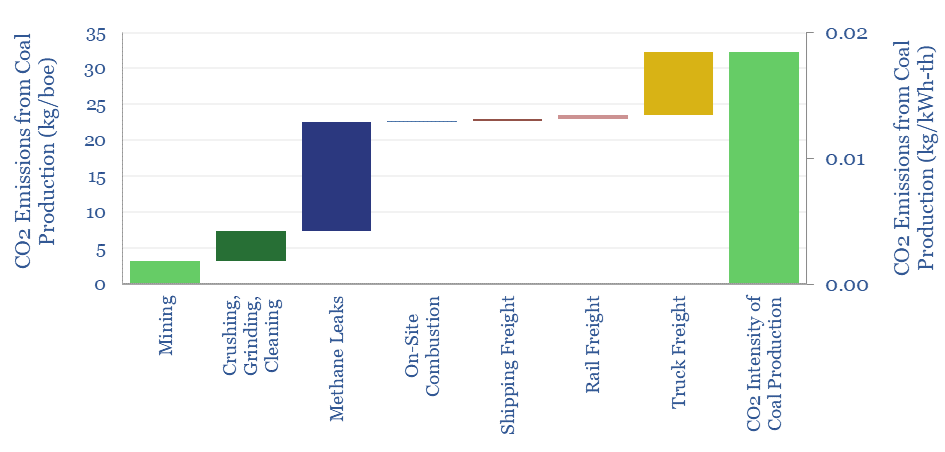
The CO2 intensity of coal production can range from 0.03-0.3 tons/ton, 10-80 kg/boe and 0.005 – 0.4 kg/kWh-th. The largest contributor is methane leaks, which average 7 m3/ton globally. Our data are based on EPA disclosures, technical papers and satellite data. Total Scope 1, 2 & 3 of gas power can thus be 60-65% below that of coal power.
As a base case, we estimate that the Scope 1&2 CO2 intensity of coal production will average 0.12 tons/ton, equivalent to 30 kg/boe, or 0.02 kg/kWh-th. For comparison, we think that the Scope 1&2 emissions run 25kg/boe for pipeline gas value chains, 50kg/boe for LNG value chains, 60kg/boe for producing oil products, 75kg/boe for producing crops for food energy and even higher for oil crops.
Our estimates for the CO2 intensity of coal production incorporate data into coal mining, comminution, mine trucks, plus third-party data from coal companies, EPA FLIGHT and the excellent EDGAR (Emissions Database for Global Atmospheric Research, 2023) resource.
However, numbers vary widely based on input assumptions, such as methane leakage rates, btu content and transportation distances, which can all be flexed in the model. Most of all, the numbers are sensitive to methane leakage rates.
Specifically, as coal is excavated, depressurized and broken into pieces, methane desorbs from its surface and can leak into the atmosphere, with a warming potential 20-200x higher than CO2.
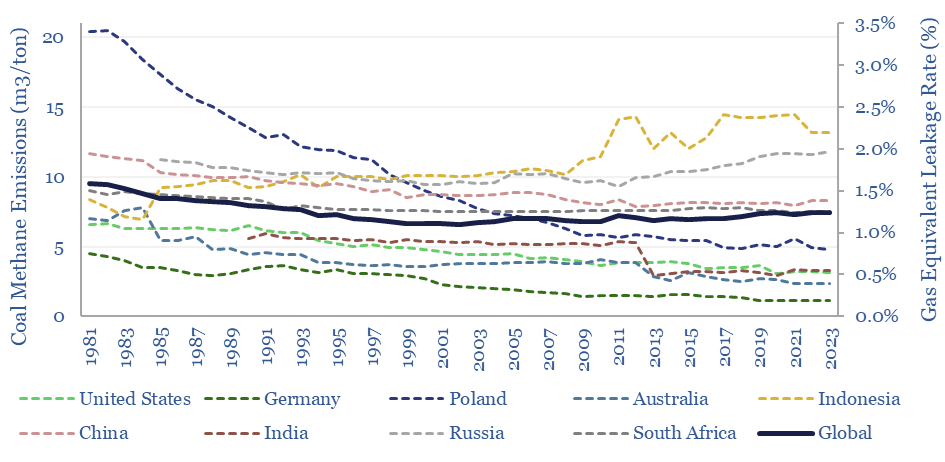
The best global estimate into the methane intensity of coal comes from the EDGAR GHG database, averaging 7.4 m3/ton in 2023, equivalent to 35kg/boe, or to leaking 1.2% of the gas in a natural gas value chain (above).
For contrast, we think that US gas value chains will 0.2-1.2% of their methane, depending on the end use application (see our note here).
Context matters as underground coal mining is more methane-leaky than surface mining. For example, total methane leakage of US coal is 3.2 m3/ton, which breaks down as c30-35% from underground mines at 10m3/ton, and c65-70% from surface miners with almost no leakage.
The worst offenders in global coal are Indonesia (13 m3/ton of methane leakages, equivalent to leaking 2.2% of the methane in a gas value chain) and Russia (12 m3/ton, 1.9%). China is mid-table at 8.3 m3/ton. The least bad offenders in global coal are Germany (1.1 m3/ton, 0.2%), Australia (2.4 m3/ton, 0.4%) and US surface mines. For underlying production trends, see our database of global coal production by region.
Overall, a well-run gas or LNG value chain can generate electricity with 60-65% less Scope 1, 2 & 3 CO2, versus generating the same power from coal, of which 45pp is due to lower CO2 intensity of gas, 10-20pp is due to higher efficiency of gas turbines and 0-5pp is due to methane leakage. To reach net zero by 2050-60 gas and LNG would need to rise by 2-3x.