
Methane leakage rates in the gas industry vary by source and use. Across our build-ups, the best-placed value chains are using Marcellus gas in CCGTs (0.2% methane leakage, equivalent to 6kg/boe, 1kg/mcfe, or +2% on Scope 3 emissions) and/or Permian gas in LNG or blue hydrogen value chains (0.3%). Residential gas use is closer to 0.8-1.2%, which is 4-6kg/mcfe; or higher as this is where leaks are most likely under-reported.
Today’s short note explains these conclusions, plus implications for future gas consumption. Underlying numbers are here.
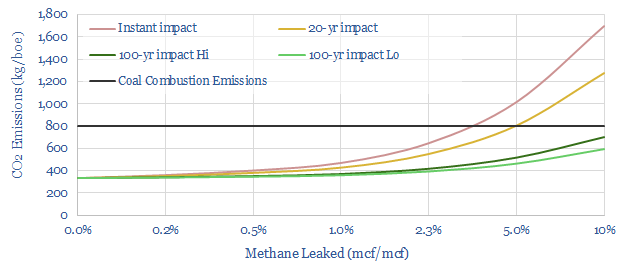
Methane, as explained here, is a 120x more potent greenhouse gas in the atmosphere than CO2. It does degrade over time, mediated by hydroxyl radicals. So its 20-year impact is 34x higher than CO2 and its 100-year impact is 25x higher. Therefore, if c2.7-3.5% of natural gas is “leaked” into the atmosphere, natural gas could be considered a “dirtier” fuel than coal (chart below, model here).
For a fair comparison an important side-note, not reflected in the chart above, is that methane is also leaked into the atmosphere when producing coal. This is because natural gas often desorbs from the surface of coal as it is mined. Our best attempt to quantify the leakage rate is that it is equivalent to 33kg/boe, equivalent to leaking 1.2% of the methane from a gas value chain (apples to apples, using a methane GWP of 25x).
In other words, if a gas value chain is leaking less than 1.2% of its methane, then its methane leakage rates are lower than the energy-equivalent methane leakage rate from producing coal. If a gas value chain is leaking more than 1.2% of its methane, then its methane leakage rate is higher than from producing coal.
One of the challenges for quantifying methane leakage across natural gas value chains is that, by definition, it is a chain. Gas molecules move from upstream production to processing stages such as sweetening and dehydration, through transmission lines, then through distribution lines, then to end consumers such as power plants, LNG plants, ammonia plants, hydrogen reformers, industrial heating and households.
Hence in the title chart above, we have attempted to build up the methane intensity of US gas value chains, looking line by line, and using the data-files indexed below. For example, as of our latest data-pull, methane leakage rates are 0.06% of produced gas in the Appalachian, 0.19% in the Permian, 0.22% in the Bakken, 0.34% in the Gulf Coast and 0.49% in the MidCon.
Putting the pieces together, we think that the total methane leakage rate across the value chain can be as low as 0.2-0.3% when gas from the Marcellus or Permian are used in gas power (e.g., for an AI data-center, LNG plant or for blue hydrogen). This is just 6-10 kg/boe of Scope 1 CO2, or 1-1.5 kg/mcfe (by contrast, combusting natural gas emits 56kg of CO2 per mcfe). And the best producers may achieve even lower, via the growing focus on mitigating methane.
Conversely, using gas for home heating and home cooling likely carries a higher methane leakage rate, of 0.8-1.2%, as there is more small-scale distribution, and smaller residential consumers are not always as discerning about conducting regular maintenance or checking for leaks. 0.8-1.2% methane leakage is equivalent to 23-33 kg/boe, or 4-6 kg/mcfe.
There are also risks with the numbers above, which is the systematic under-reporting of methane leakage rates, both upstream and further downstream in the value chain. Large oil and gas companies are required to measure and report their methane emissions, but Mrs Miggins is not. Hence, we think the numbers in our charts may be skewed to the upside.
All of this supports a growing role for natural gas in combined cycle gas turbines, and helping to alleviate power grid bottlenecks amidst the rise of AI, plus US LNG and blue hydrogen value chains. Our US decarbonization model has power rising from c40% to c50% of the US gas market by 2030, compensated by lower use in residential heat.