Our new energies research explores economic opportunities to drive the energy transition. Our definition of new energies is that they are not derived from the combustion of extracted resources. Solar radiation is directly converted to electricity in a photovoltaic cell. Wind and hydro power harness moving masses of fluids to drive turbines. Nuclear energy derives heat from fissioning heavy atoms; possibly in the future, from fusing light atoms. Generally these new energies yield electricity directly (i.e., no heat engines are involved). Electricity can be the highest-grade form of energy. But electricity also requires resilient power grids, sophisticated power electronics and possibly also energy storage via batteries. Achieving an energy transition requires moving ‘Heaven and Earth’, to de-bottleneck bottlenecks in power transmission (heaven) and mined metals and materials (earth). We also consider hydrogen and biofuels among new energies.
Solar Research
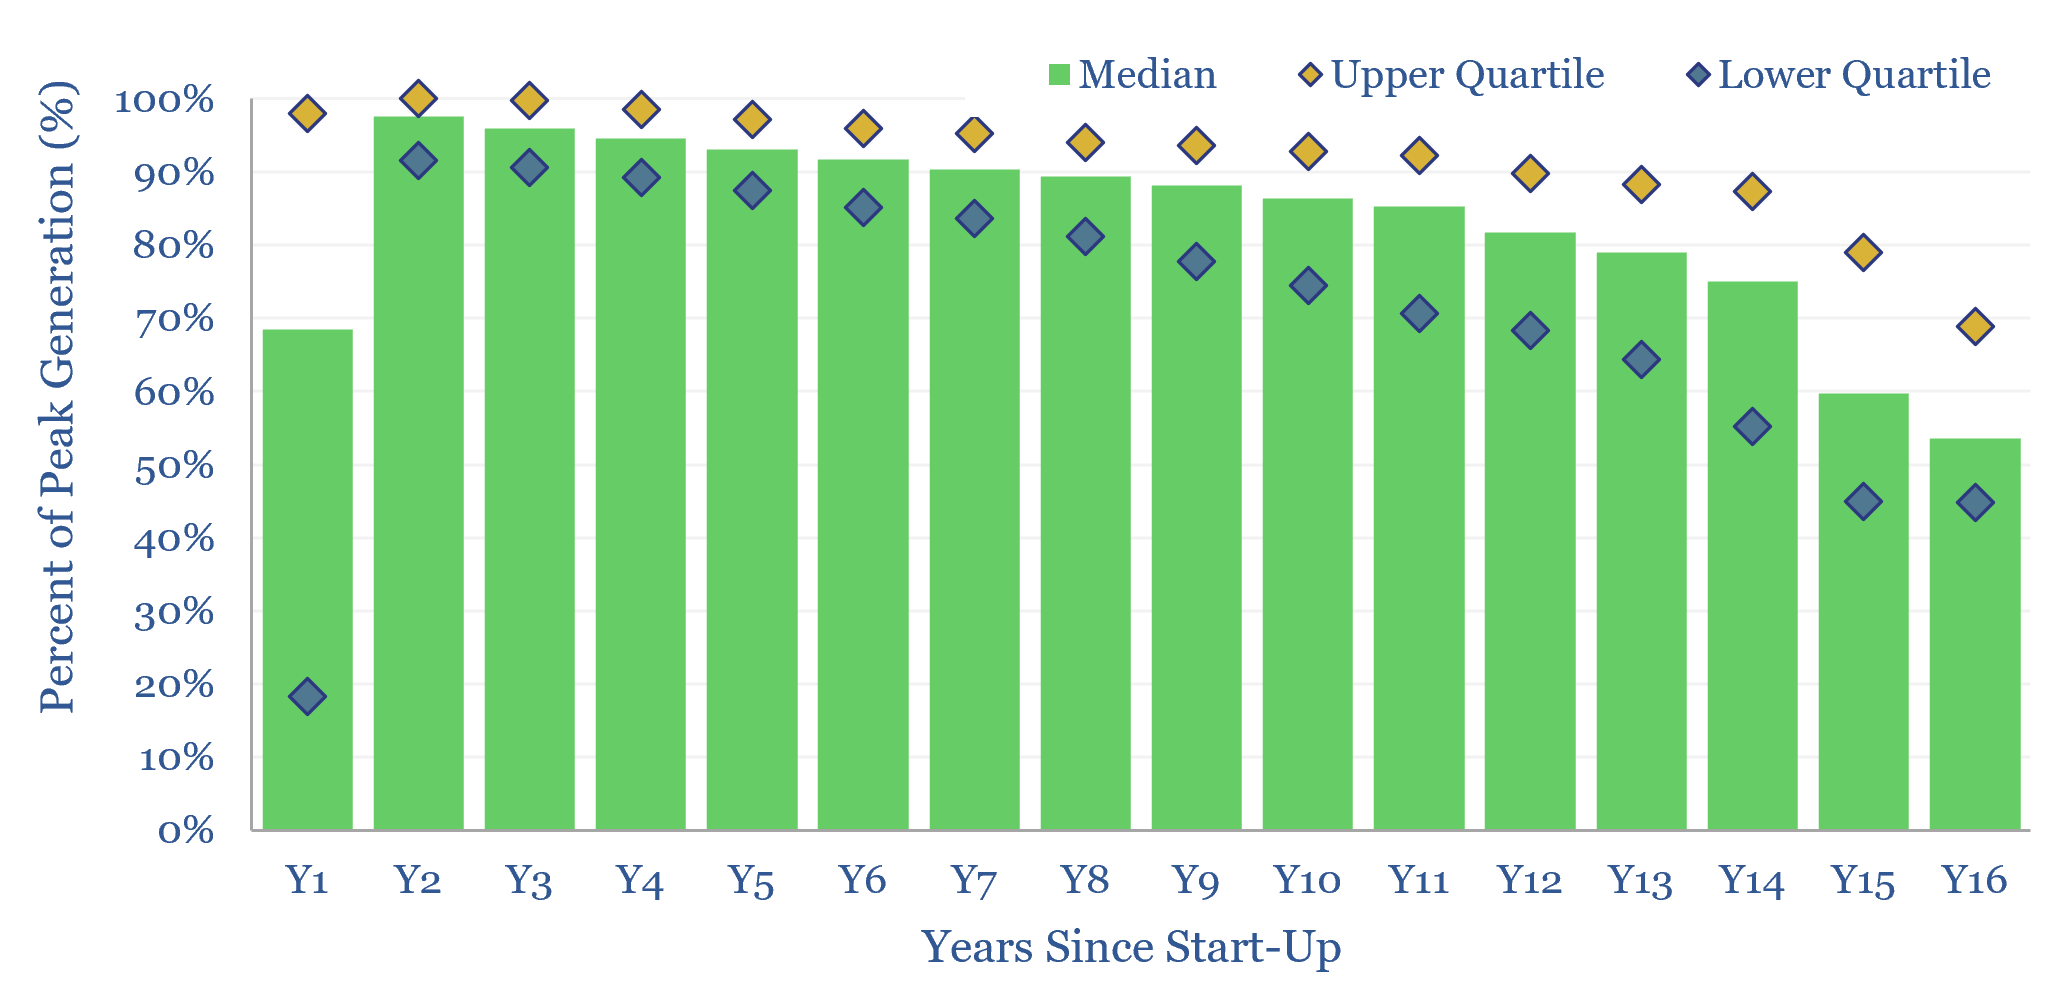
Solar power: decline rates?
Download
Solar trackers: leading companies?
Download
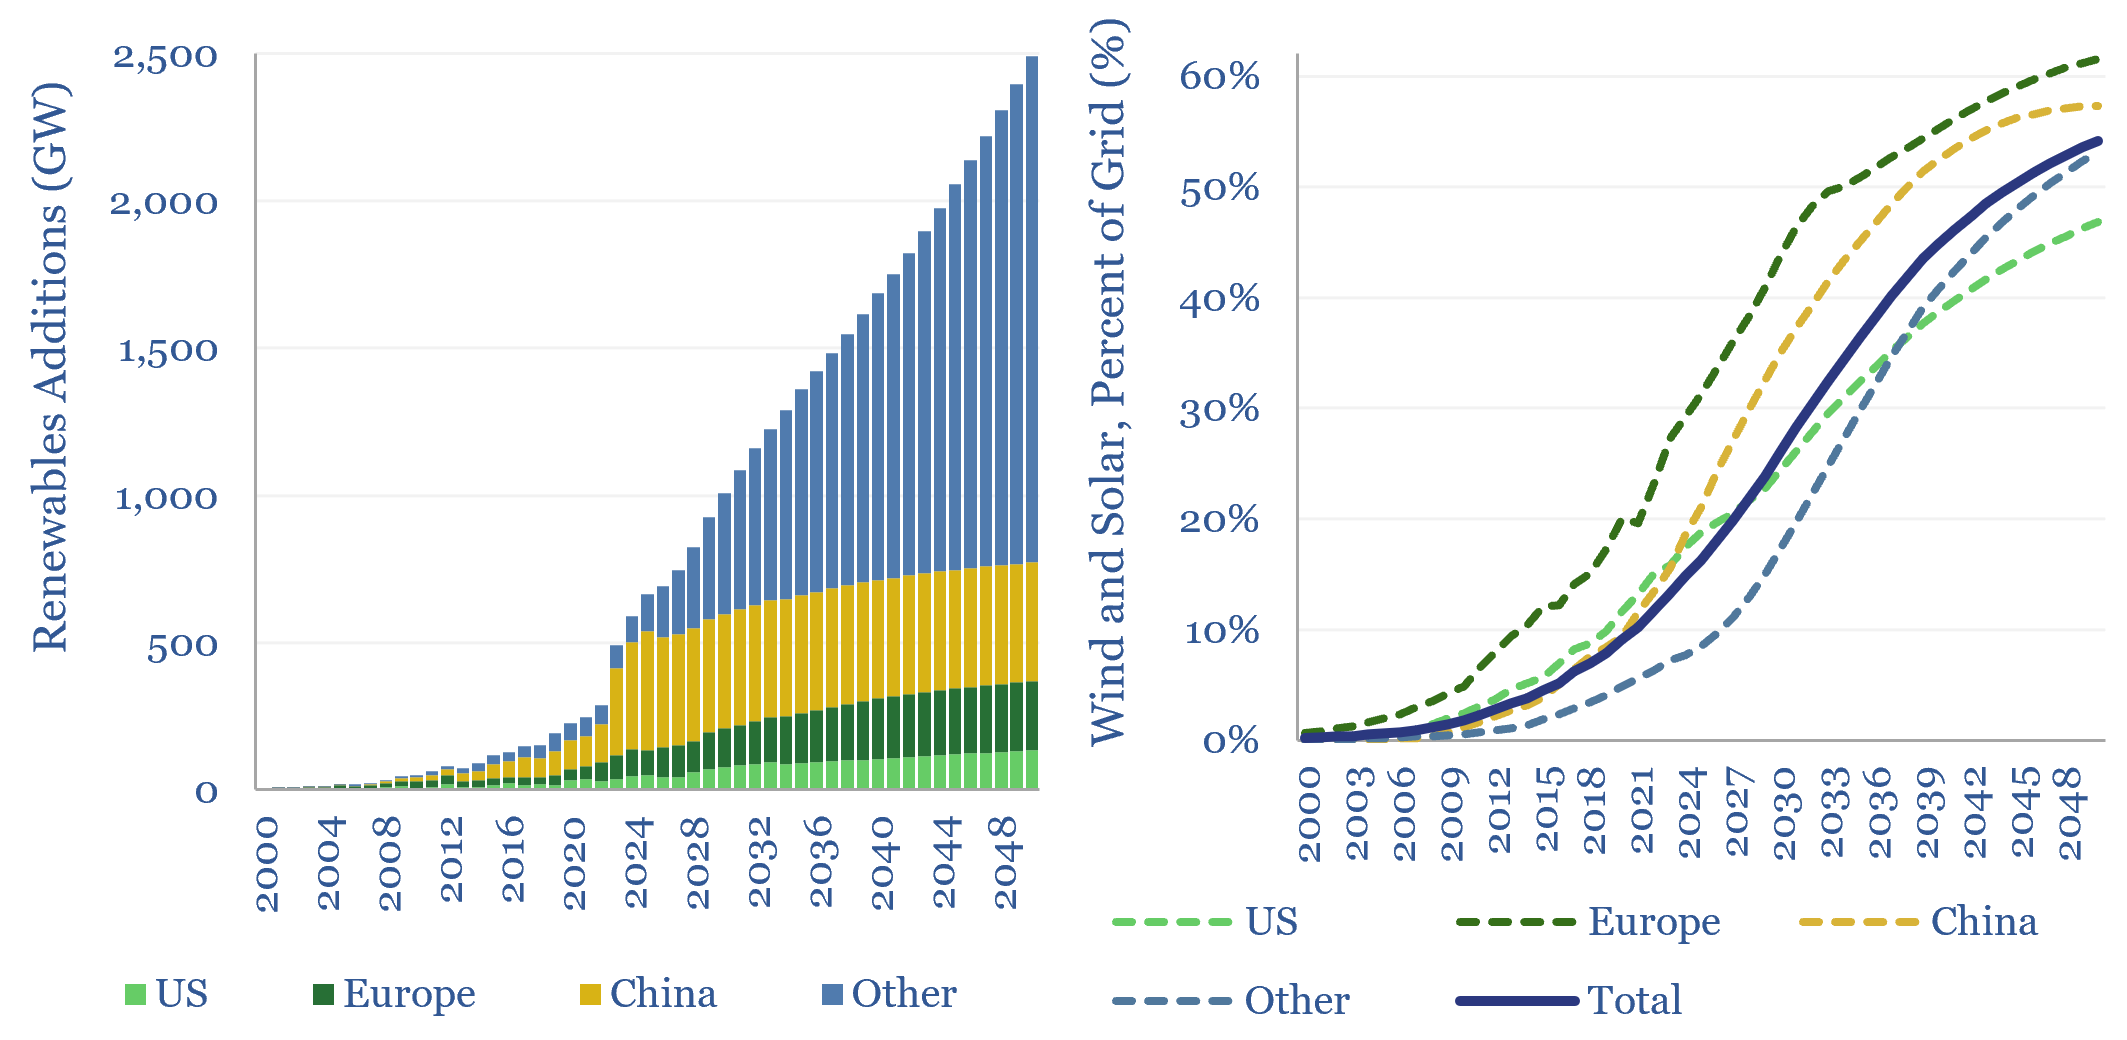
Wind and solar capacity additions?
Download
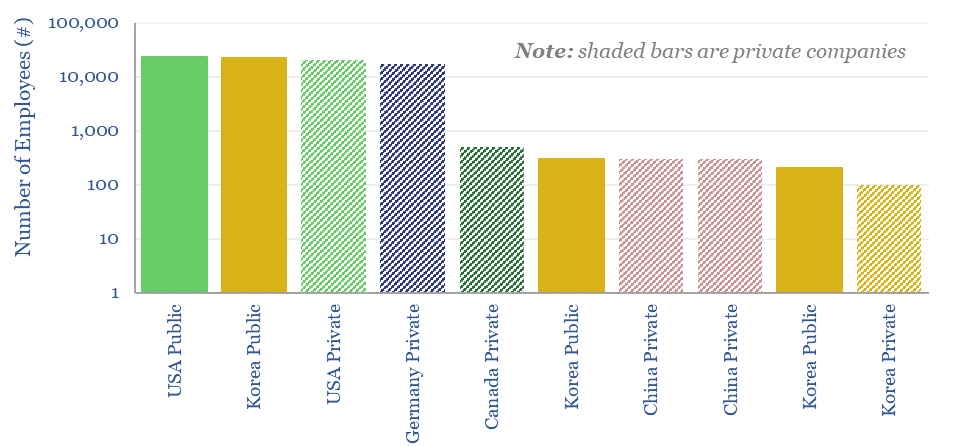
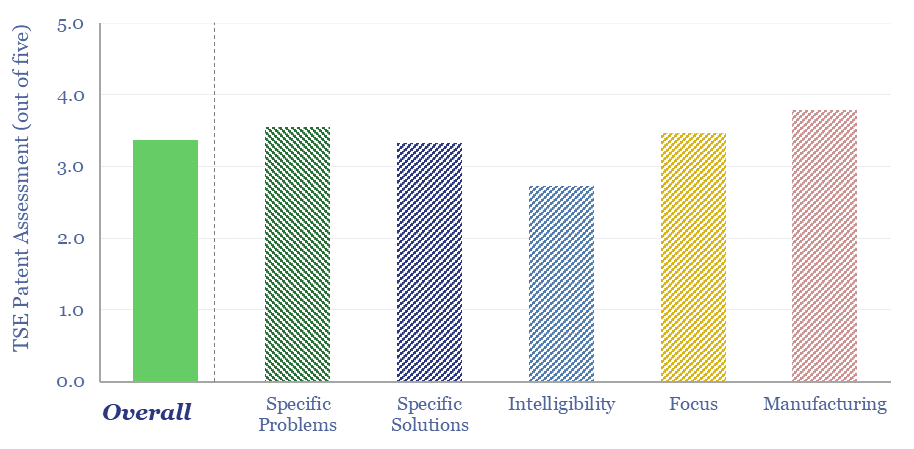
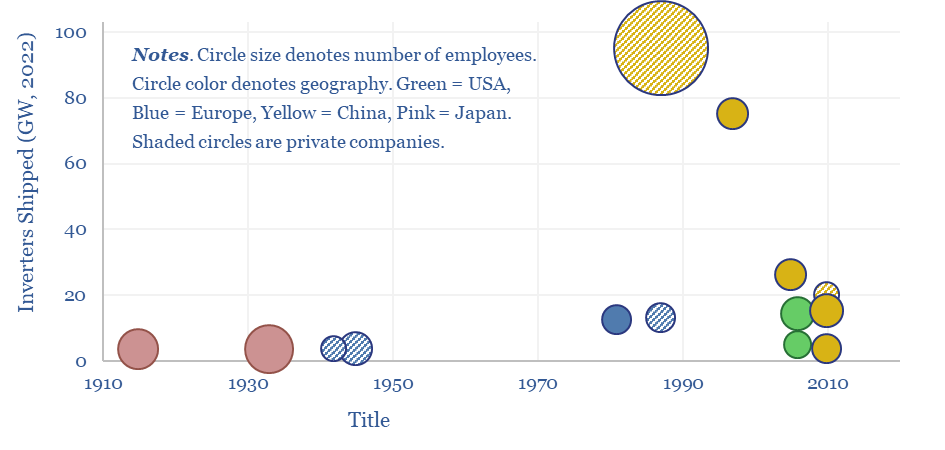
Enphase: GaN microinverter technology?
Download
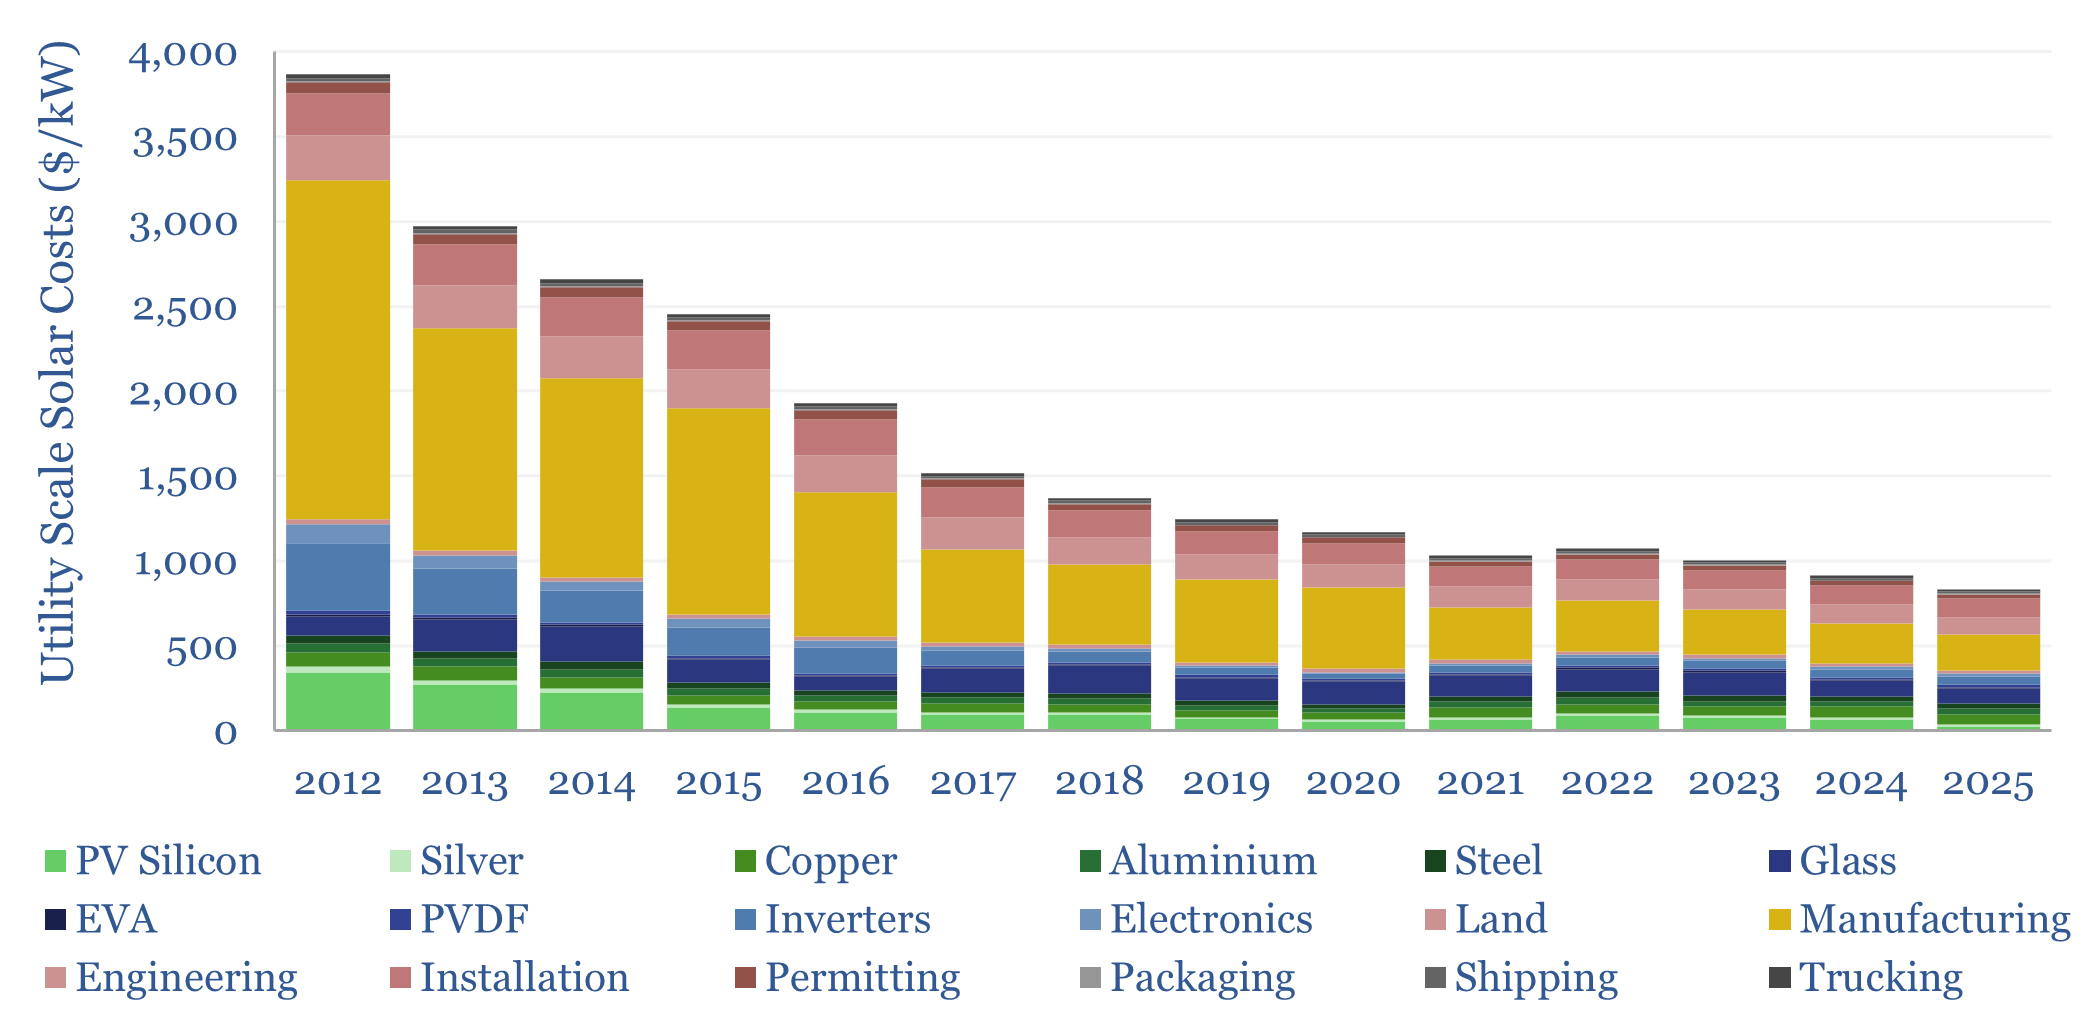
Solar costs: a breakdown over time?
Download
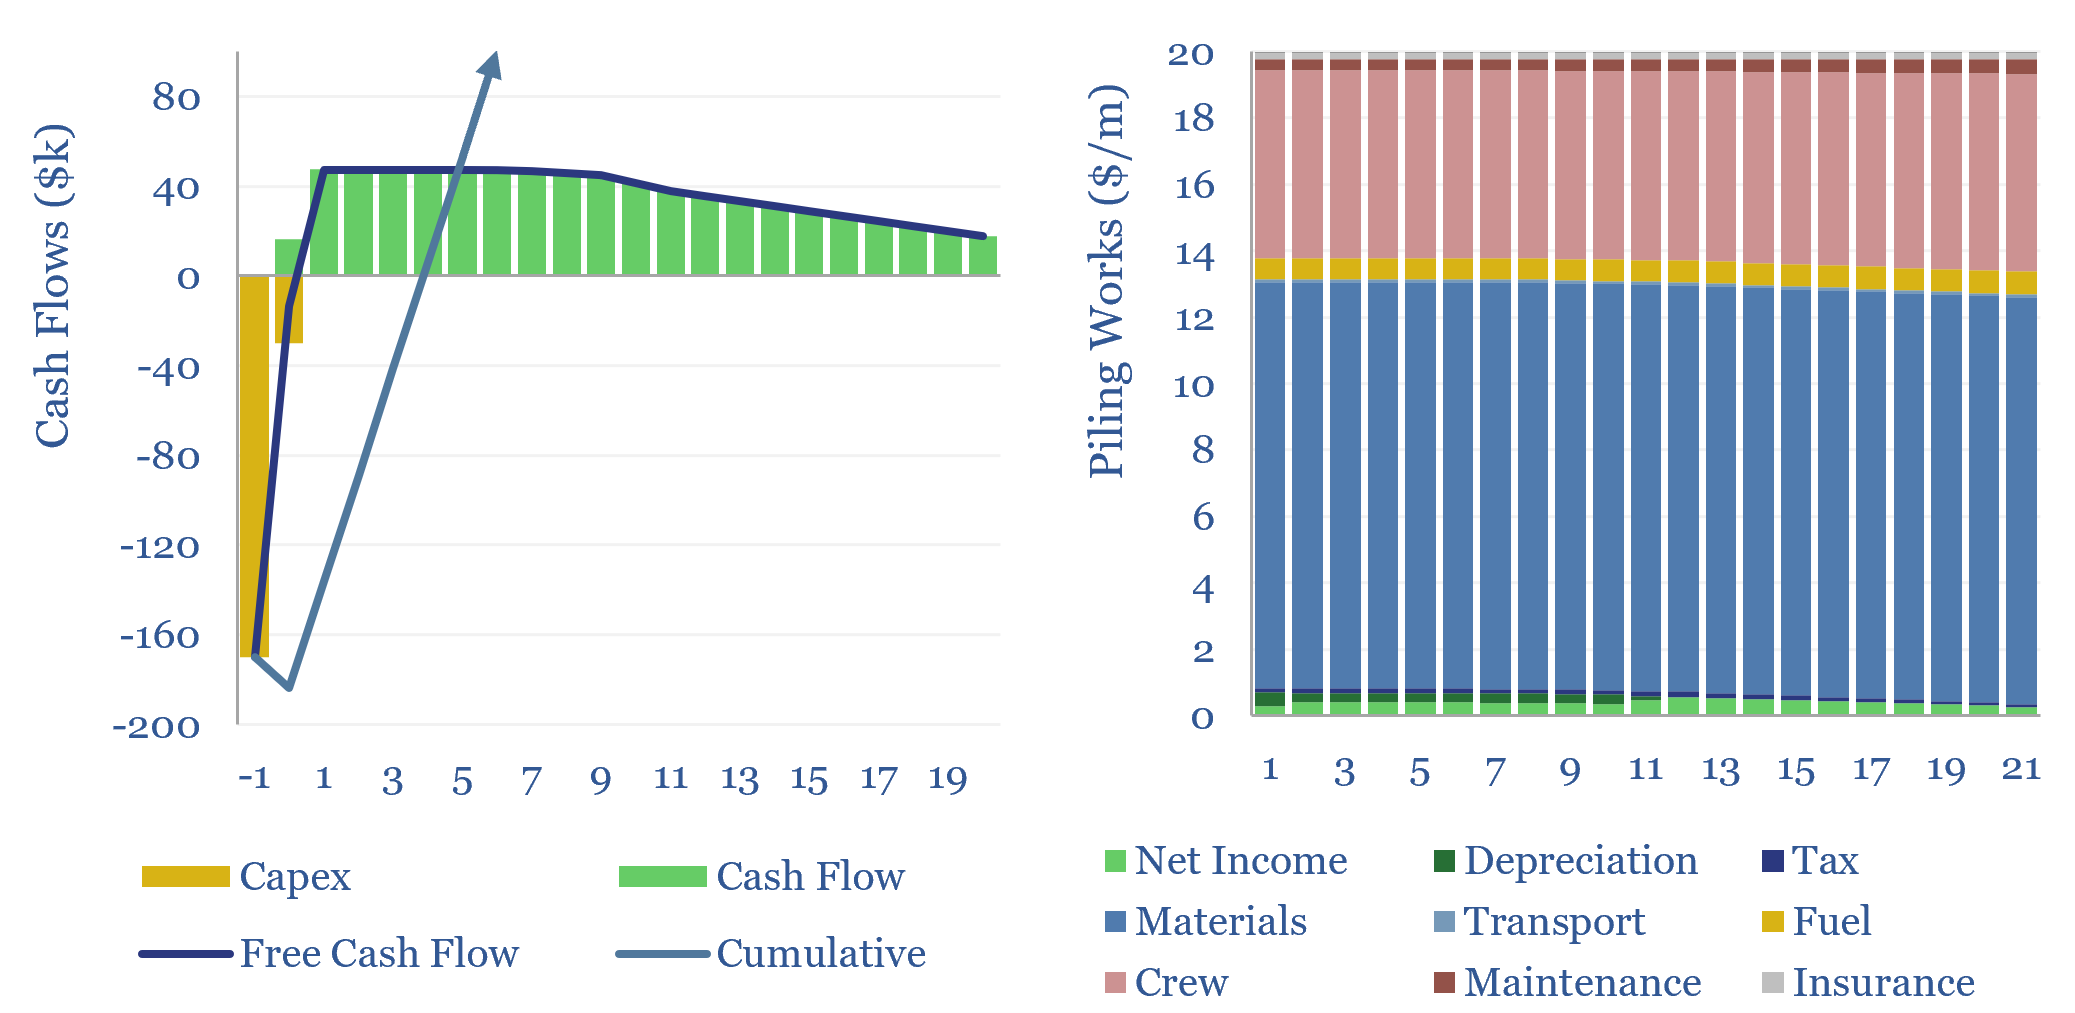
Piling works: anchoring construction costs?
Download

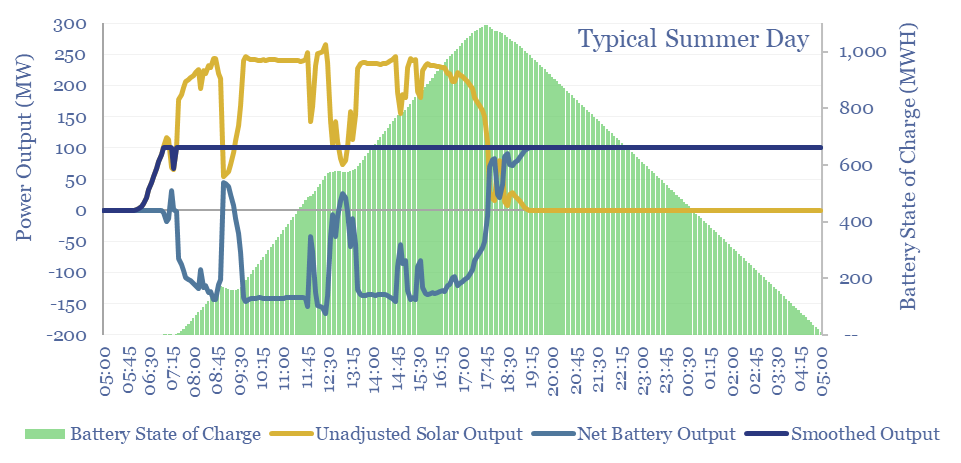
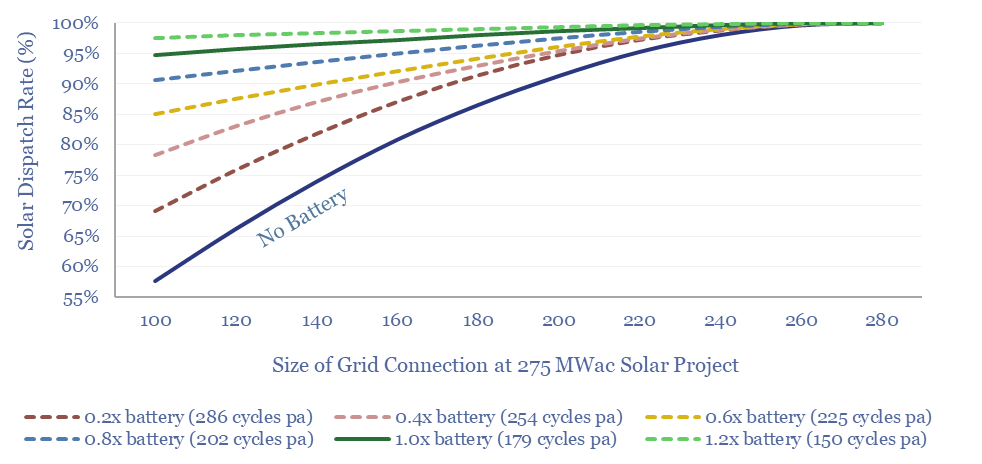
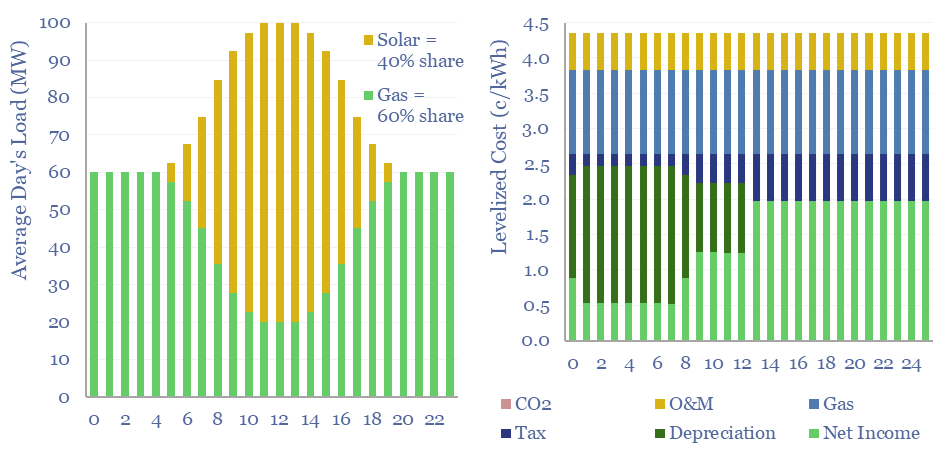
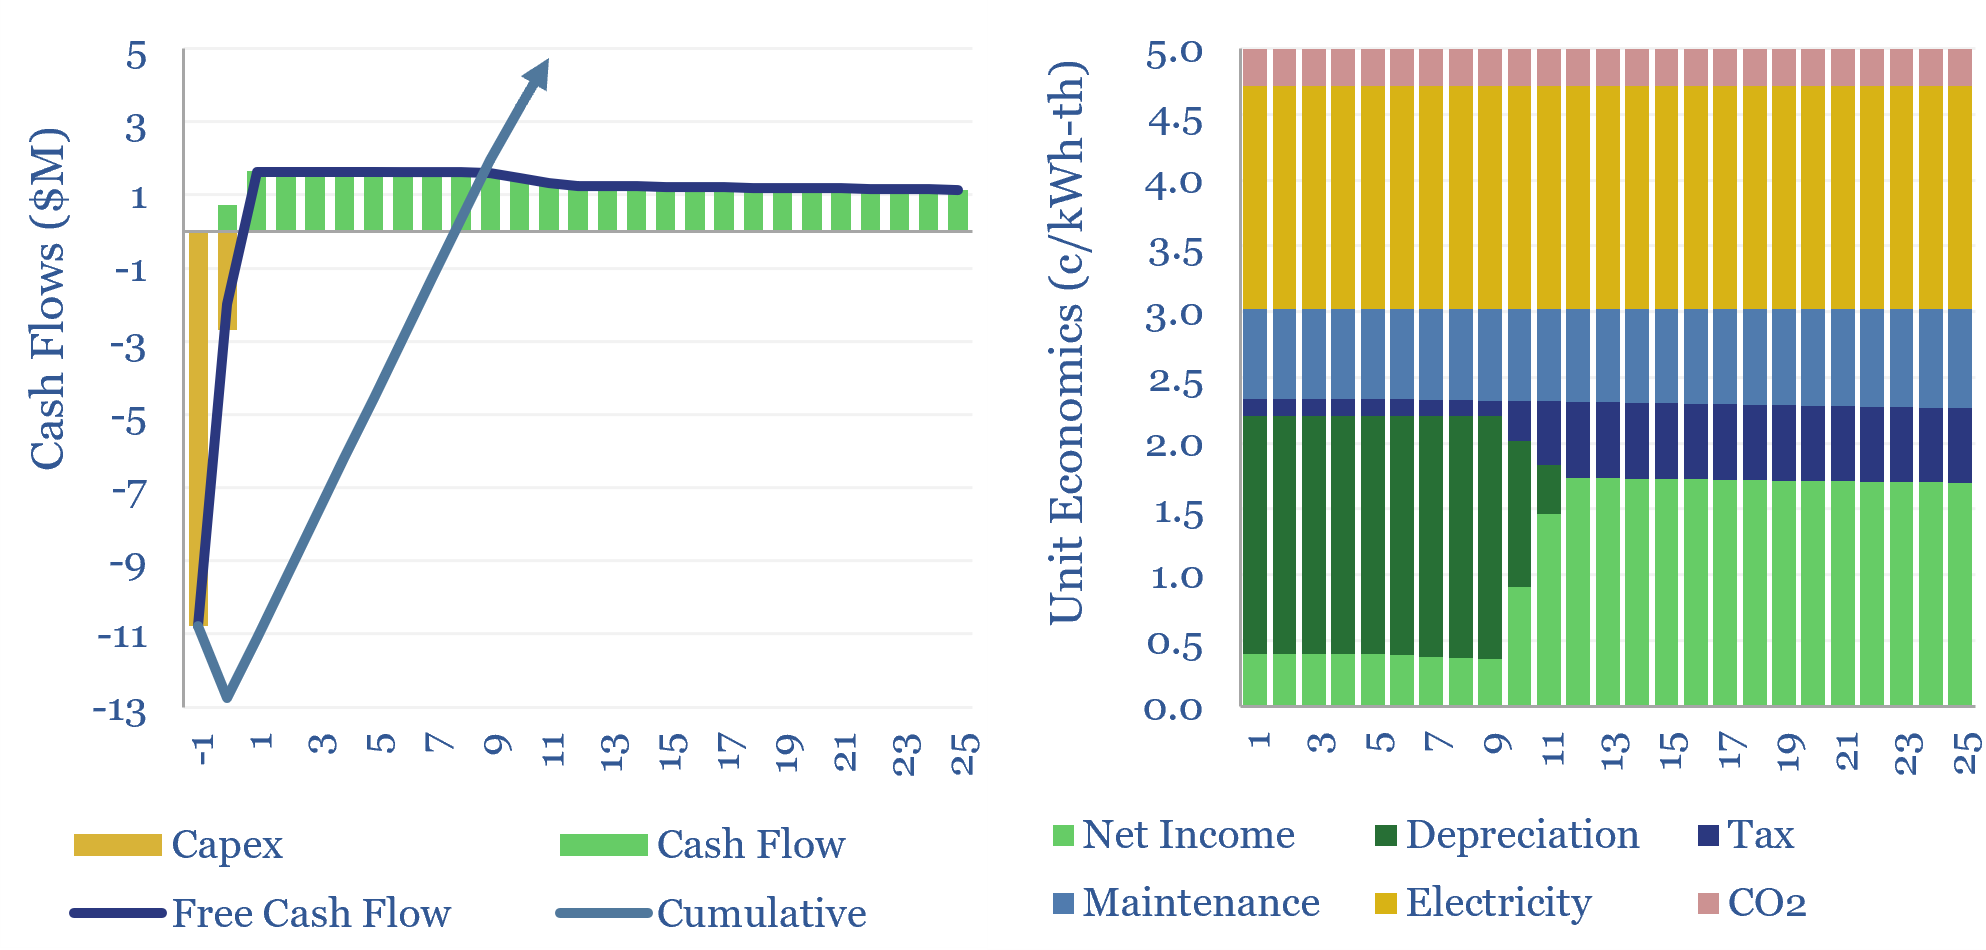
Can solar provide round-the-clock power for data-centers?
Download
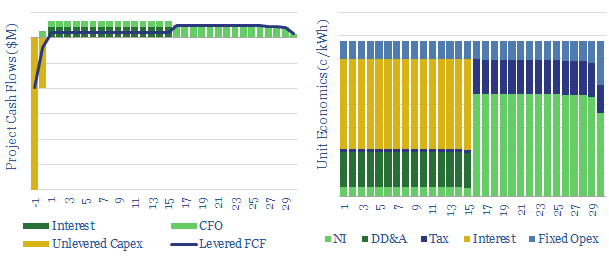
Solar+battery co-deployments: cost profiles?
Download

Wind and solar: total resource estimates?
Download
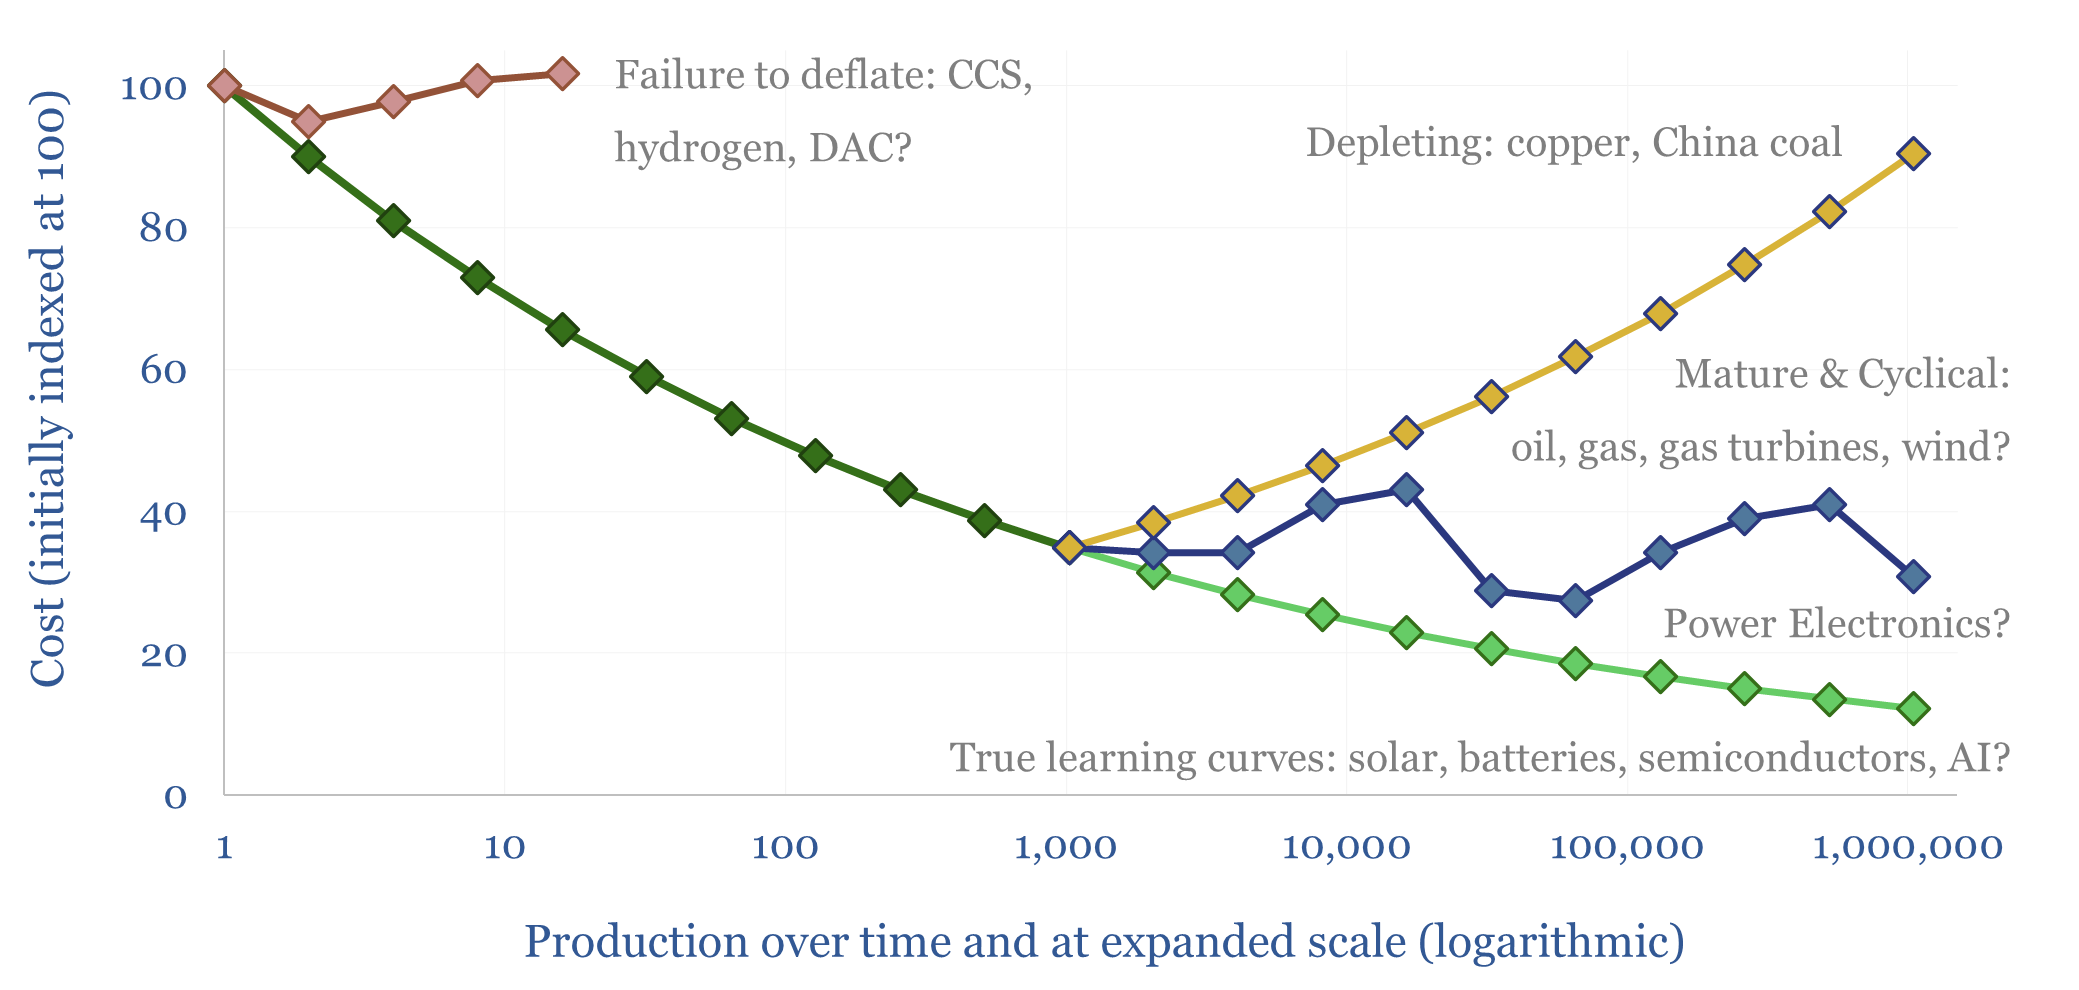
New energies deflation: myths and legends?
Download
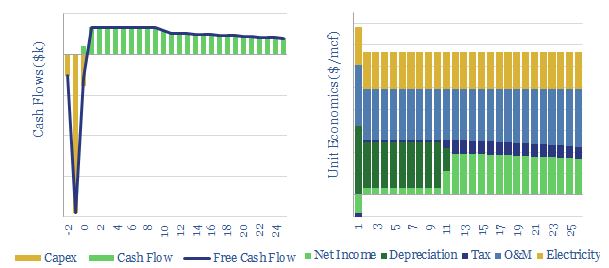
Solar power: the economics?
Download
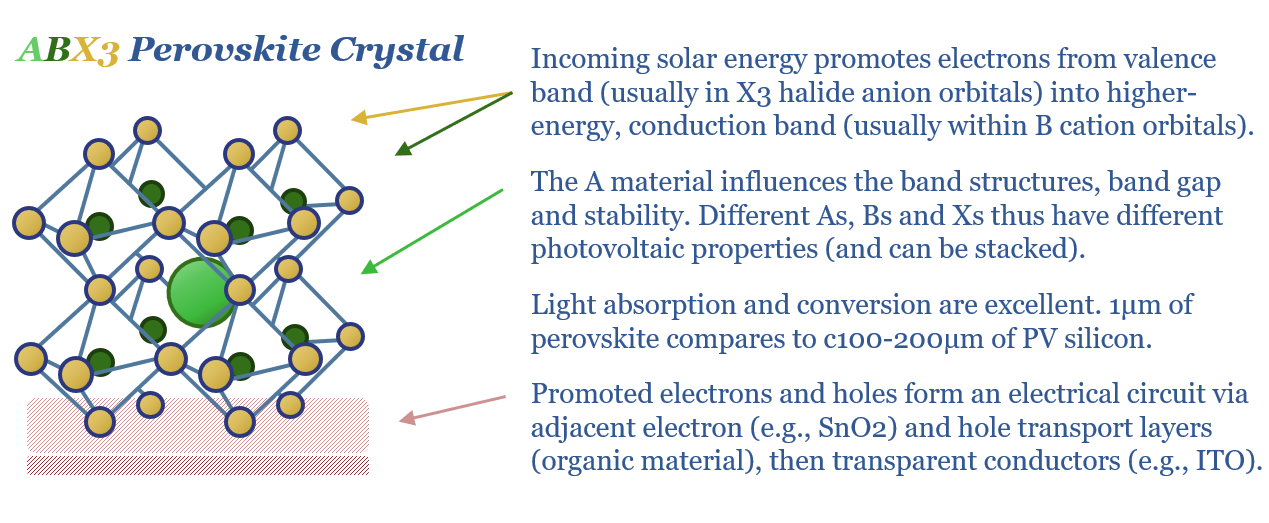
Perovskite solar: beyond silicon?
Download
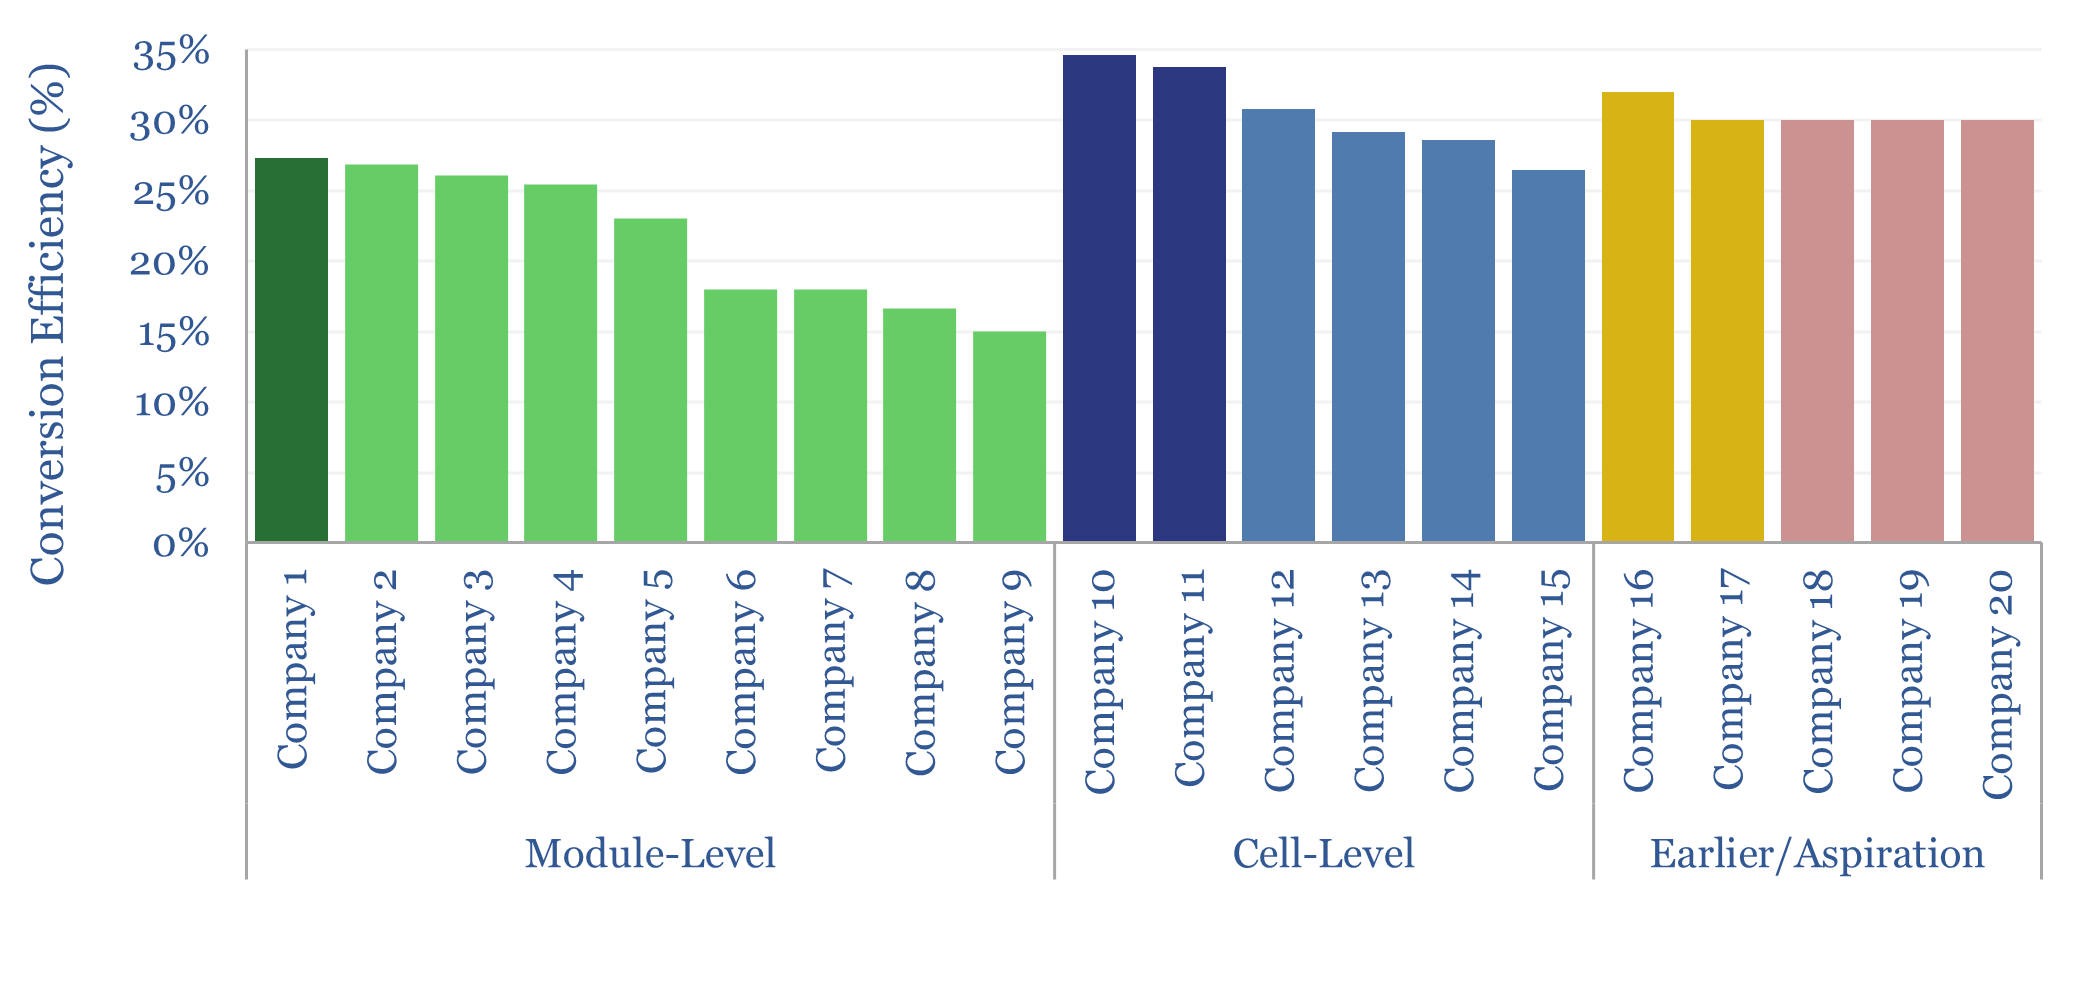
Perovskite solar companies screen?
Download
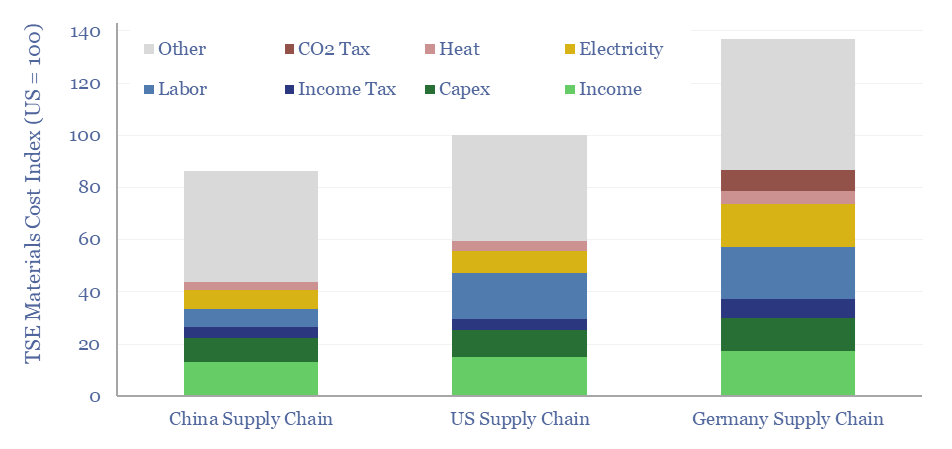
Material and manufacturing costs by region: China vs US vs Europe?
Download
Energy transition: solar and gas -vs- coal hard reality?
Download
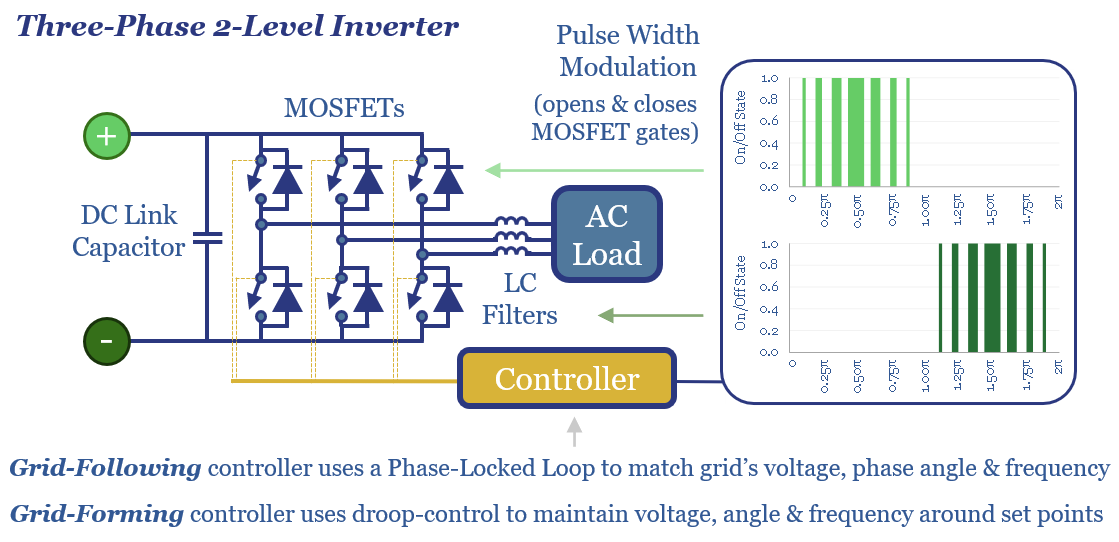
Grid-forming inverters: islands in the sun?
Download
Solar trackers: following the times?
Download
Solar plus batteries: the case for co-deployment?
Download
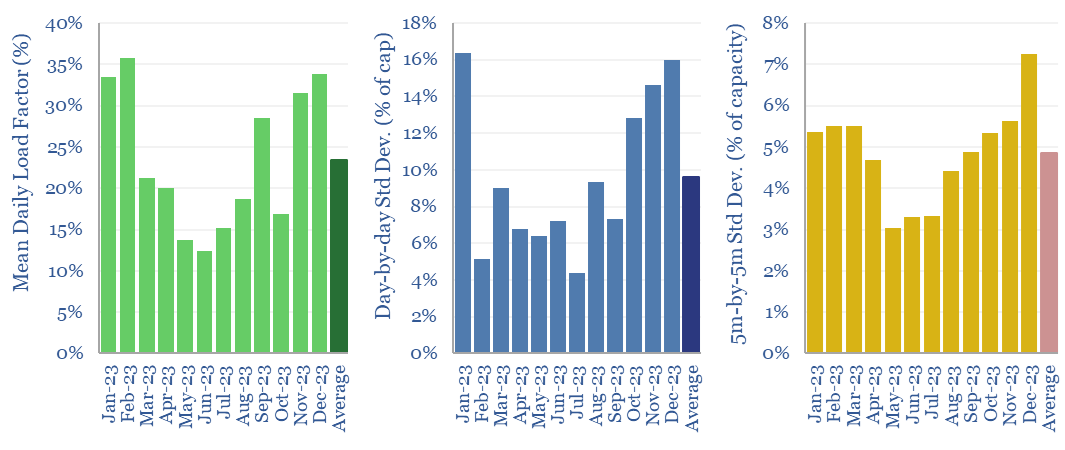
Solar generation: minute by minute volatility?
Download
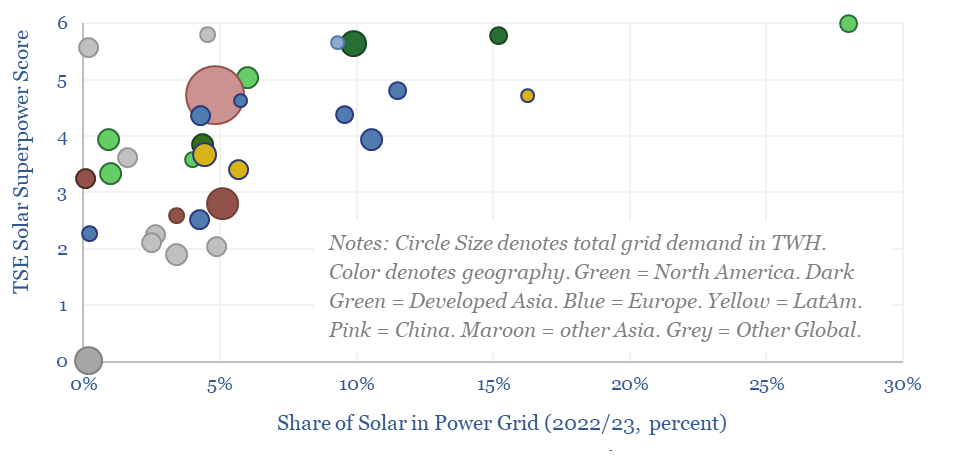
Solar Superpowers: ten qualities?
Download
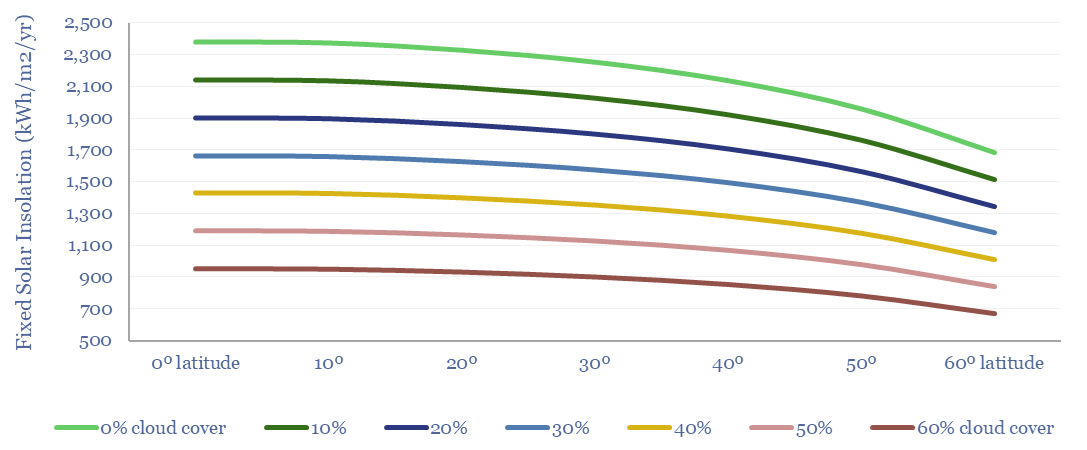
Solar insolation: by latitude, season, date, time and tilt?
Download
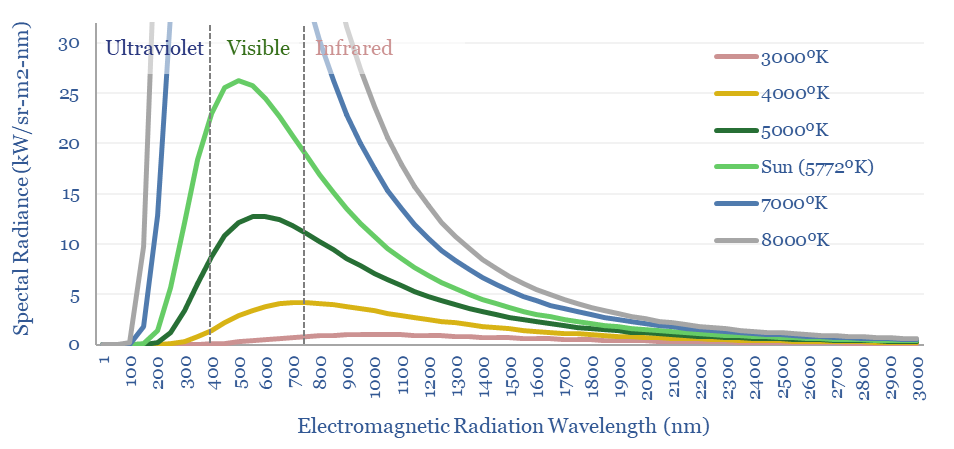
Electromagnetic energy: Planck, Shockley-Queisser, power beaming?
Download
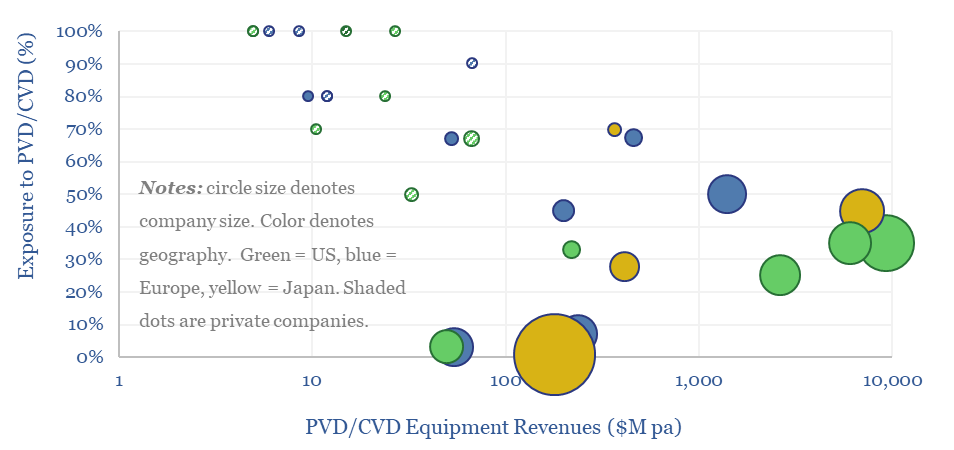
Vapor deposition: leading companies?
Download
Global solar: absorption spectrum?
Download
Silver pastes for solar contacts?
Download
LONGi: technology review and solar innovations?
Download

Solar module production by company?
Download
Solar inverters: companies, products and costs?
Download
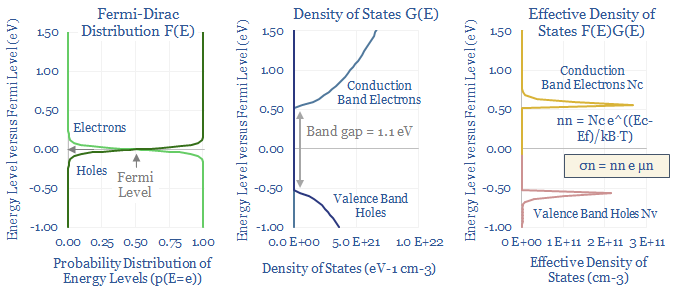
Semiconductor physics: pièce de resistance?
Download
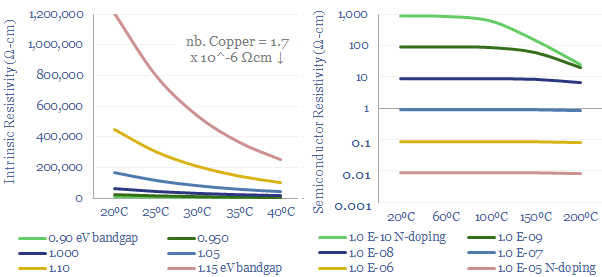
Semiconductors: conductivity calculations?
Download
Mitsui Chemicals: solar encapsulants?
Download
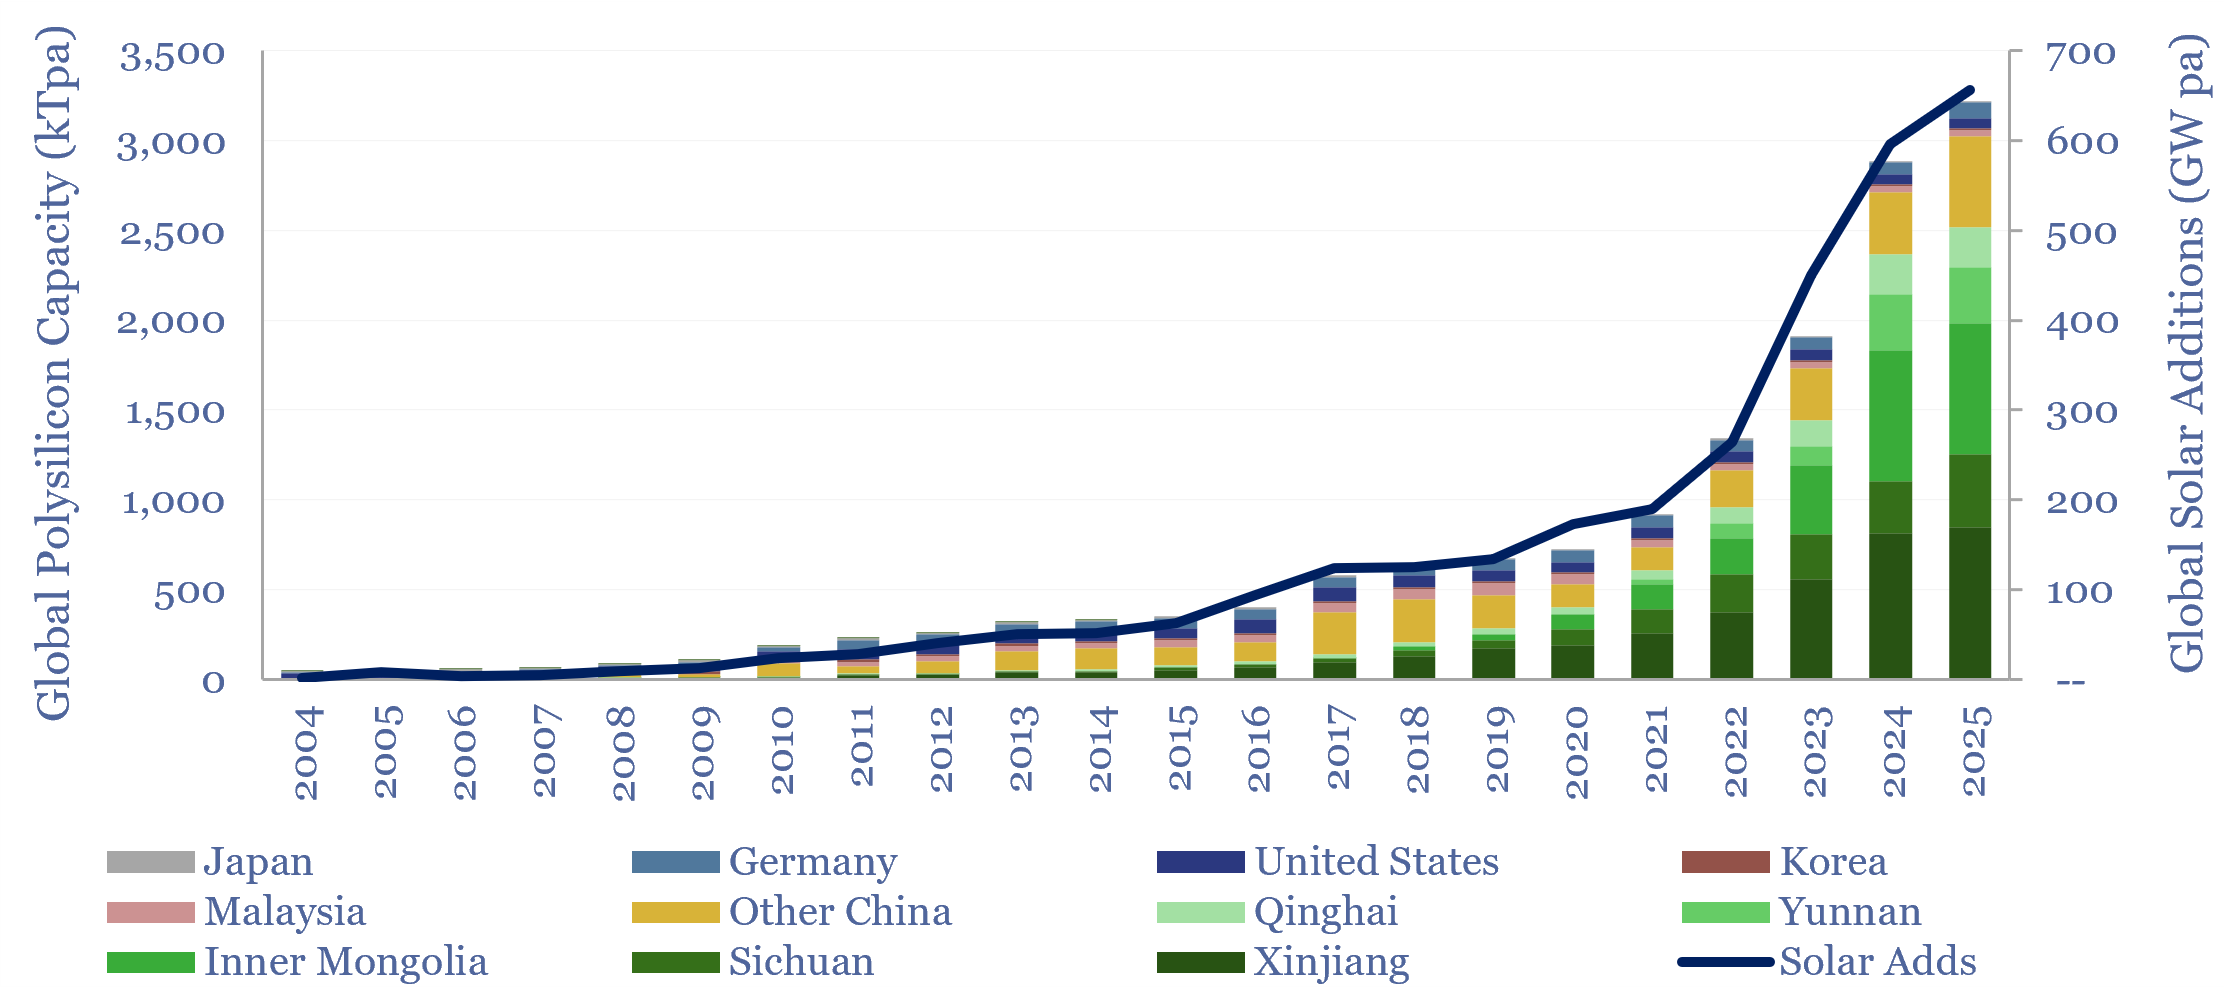
Global polysilicon production capacity?
Download

New energies: the age of materials?
Download
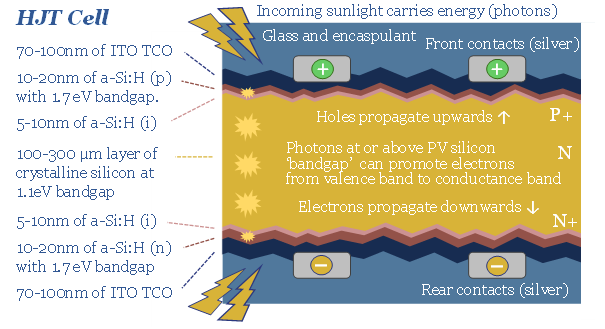
HJT solar: Indium summer?
Download
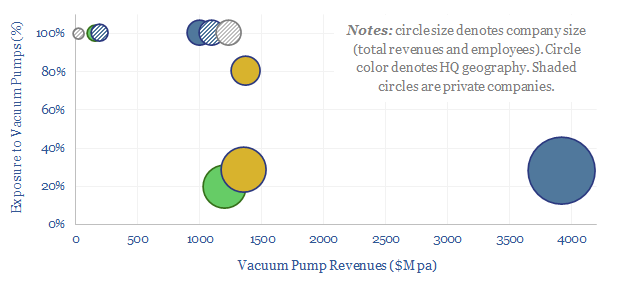
Vacuum pumps: company screen?
Download
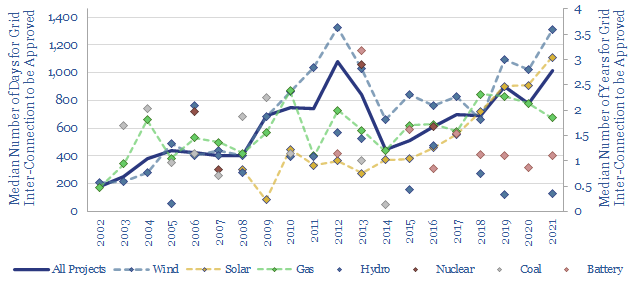
Renewables: how much time to connect to the grid?
Download
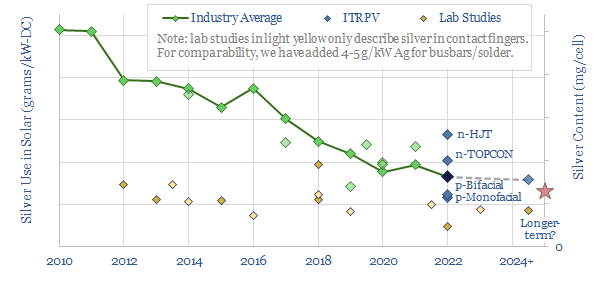
Solar surface: silver thrifting?
Download
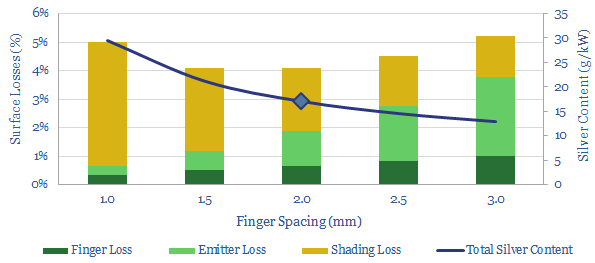
Model of losses in a solar cell: surface, emitter and shading?
Download
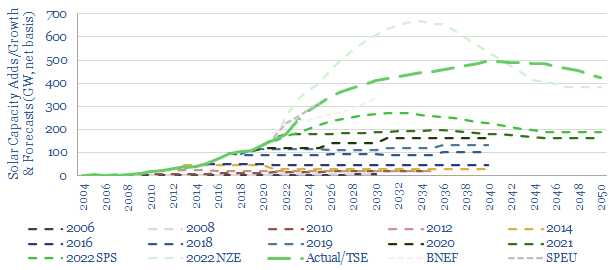
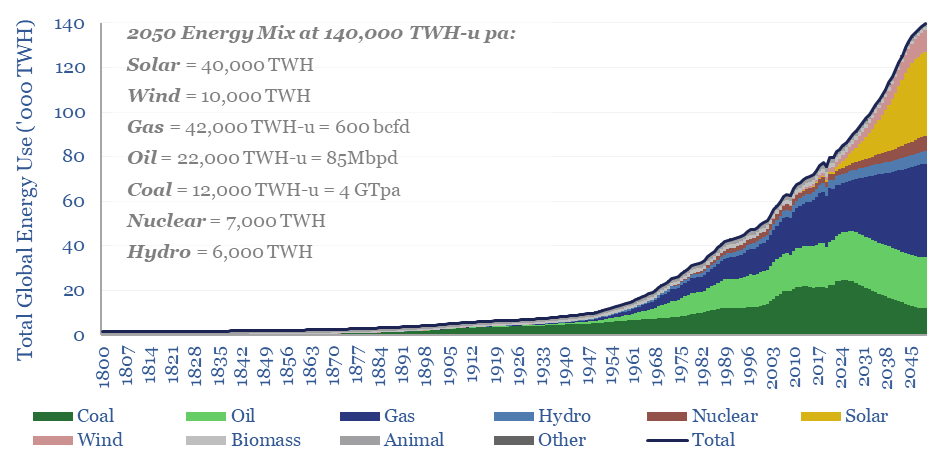
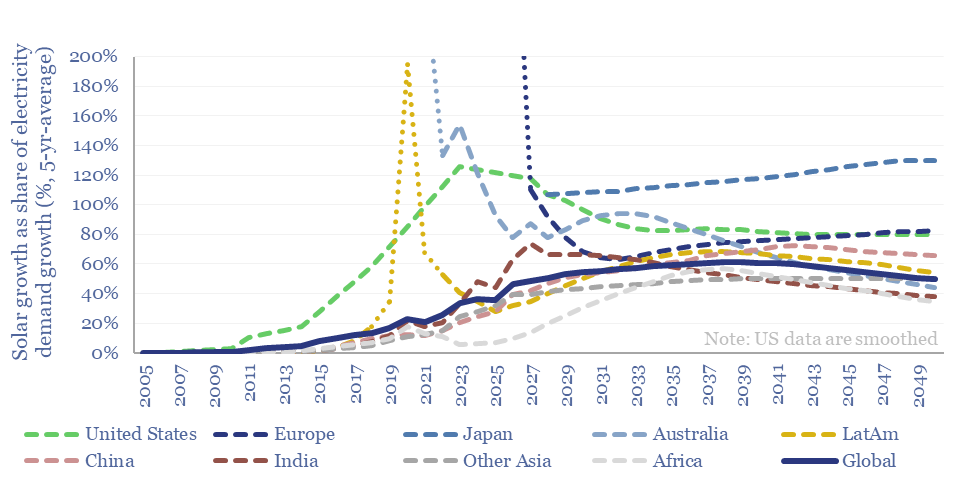
Solar capacity: growth through 2030 and 2050?
Download
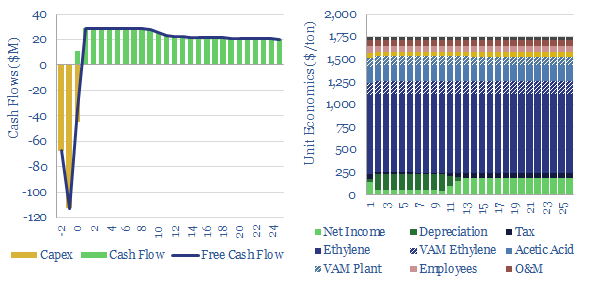
Ethylene vinyl acetate: production costs?
Download
Wind Research
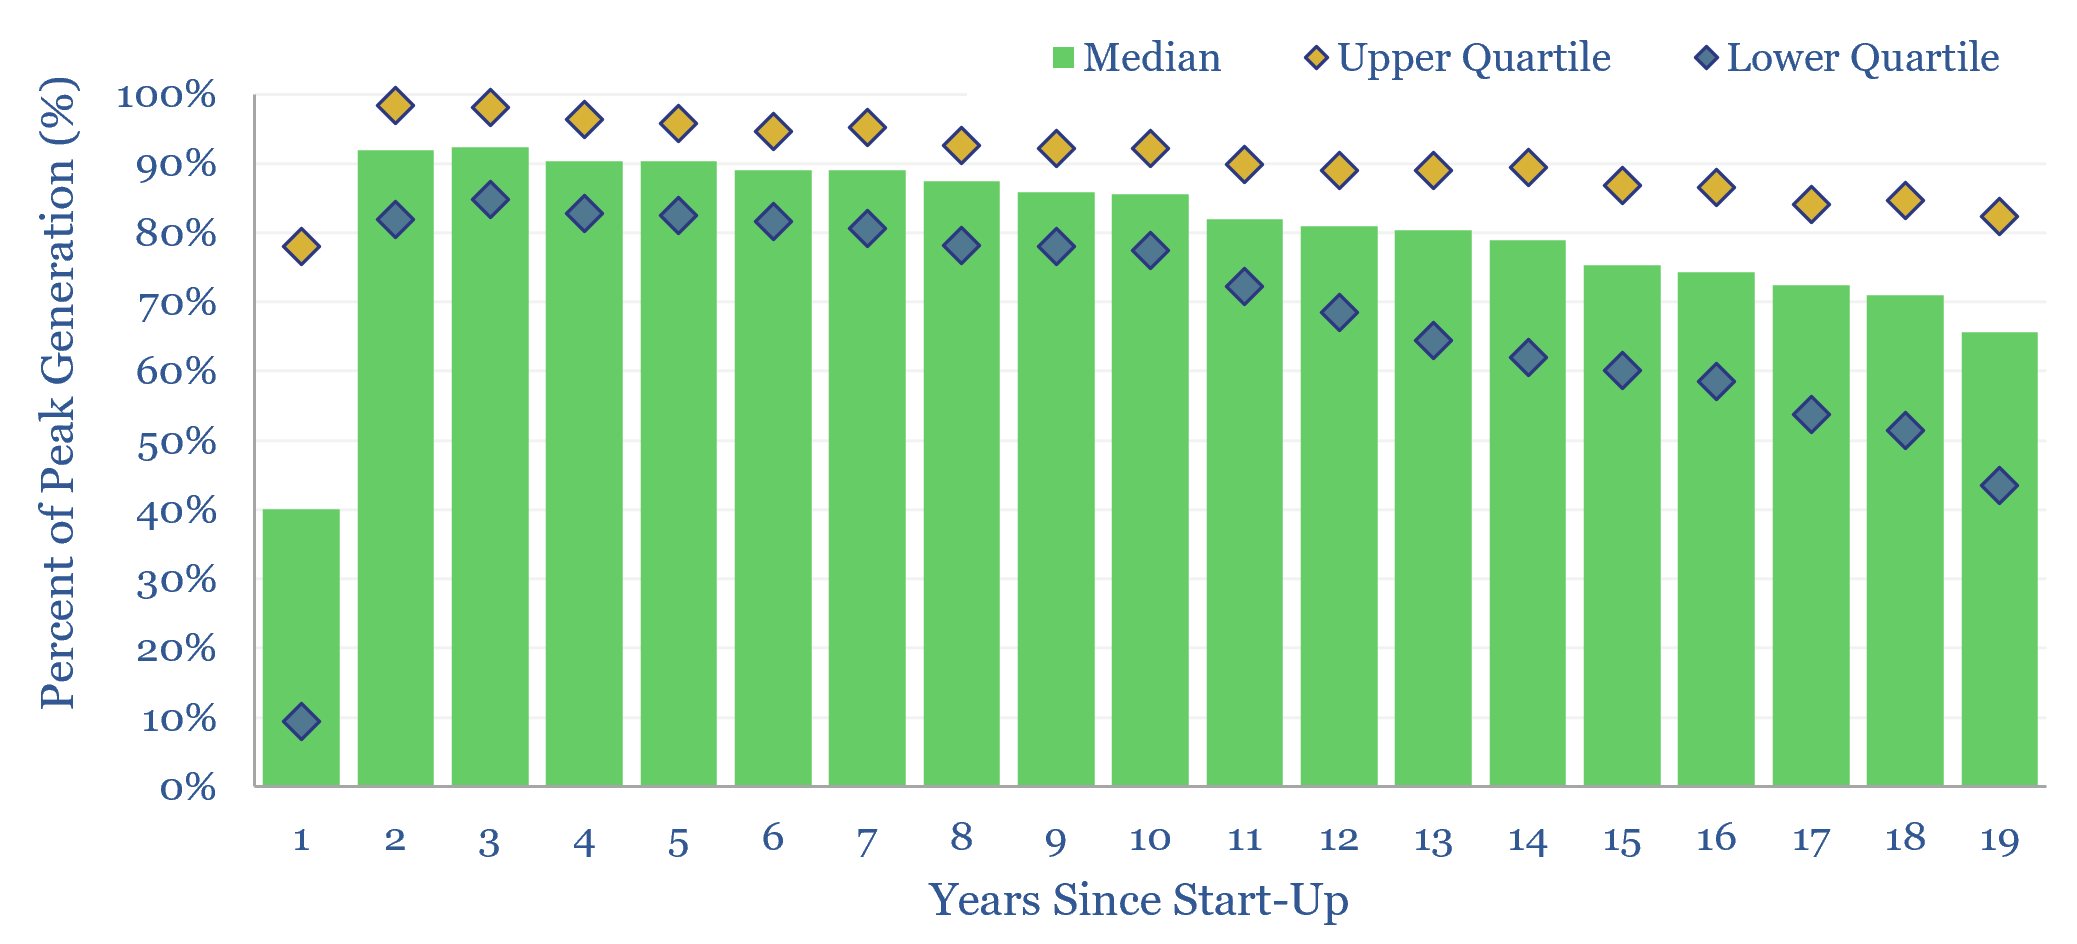
Wind power: decline rates?
Download
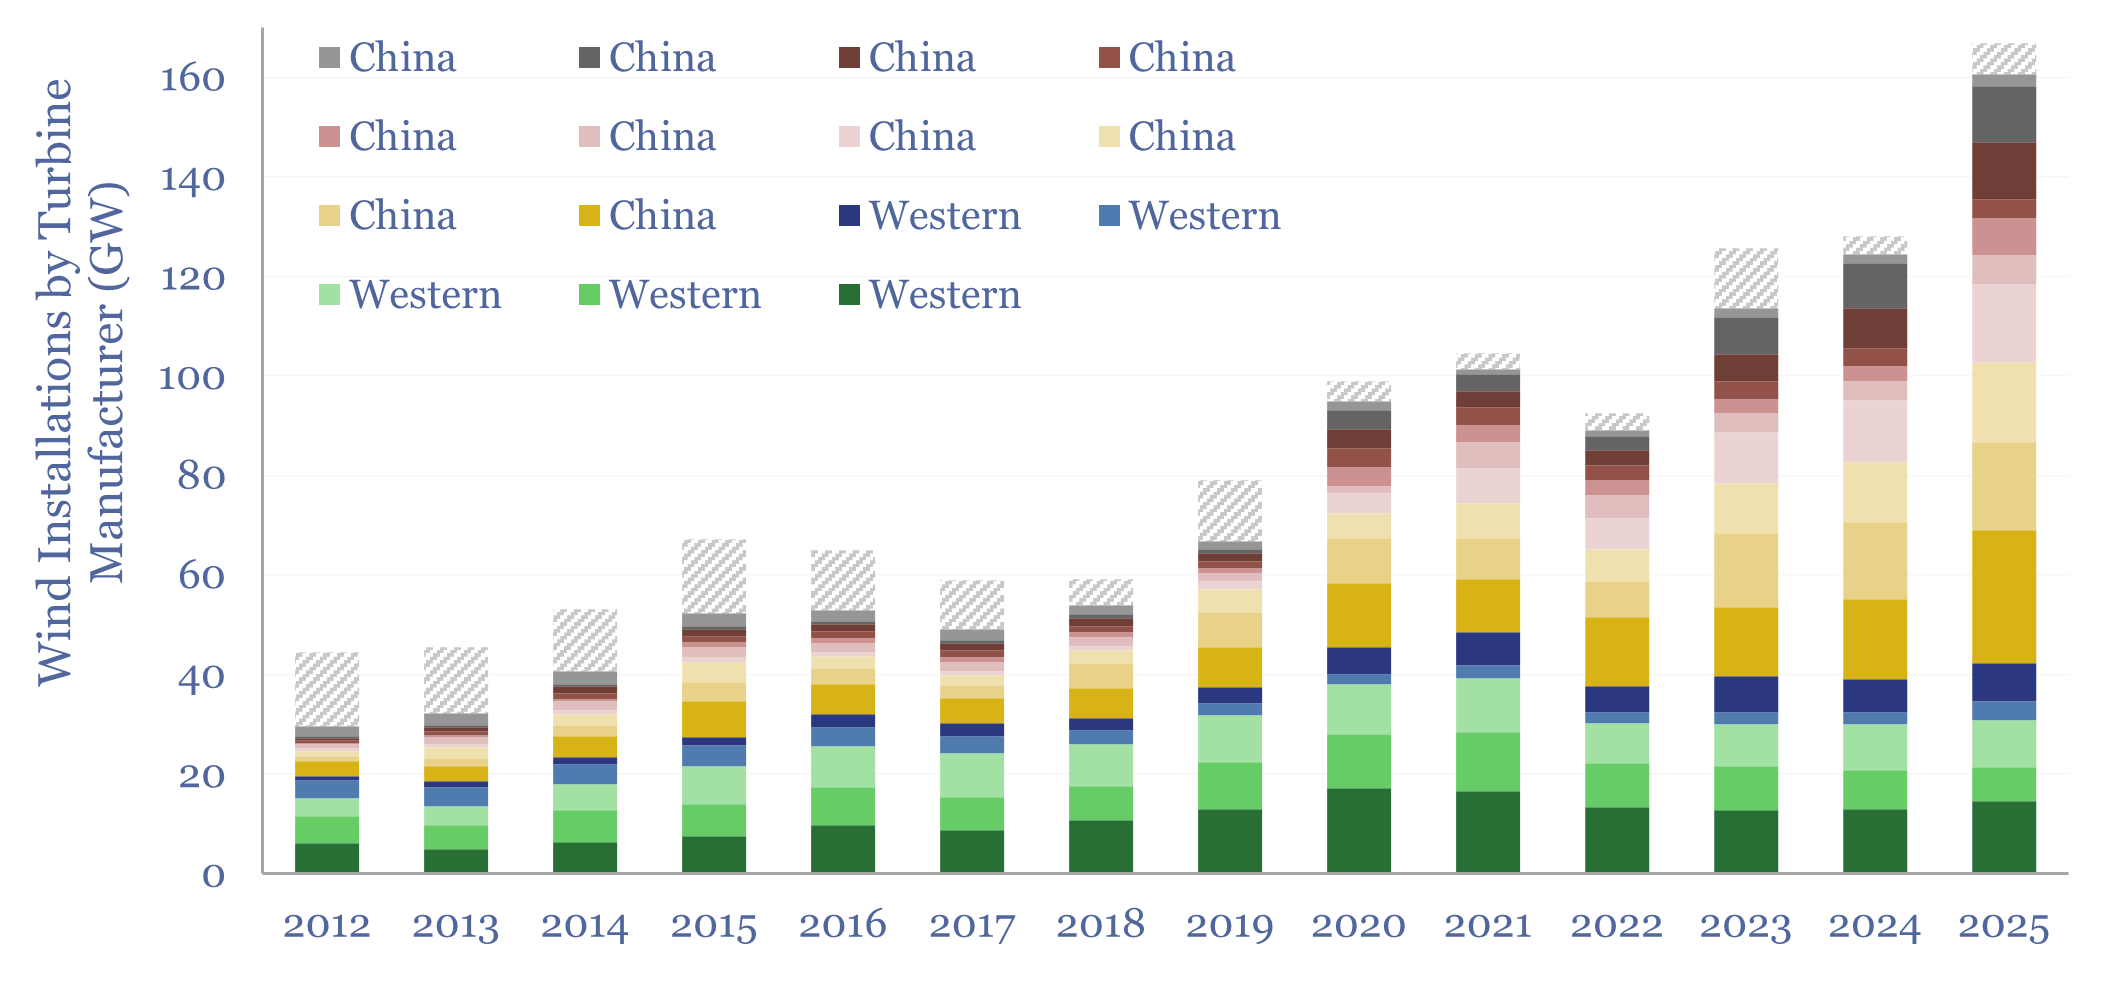
Wind turbine manufacturers: market share over time?
Download
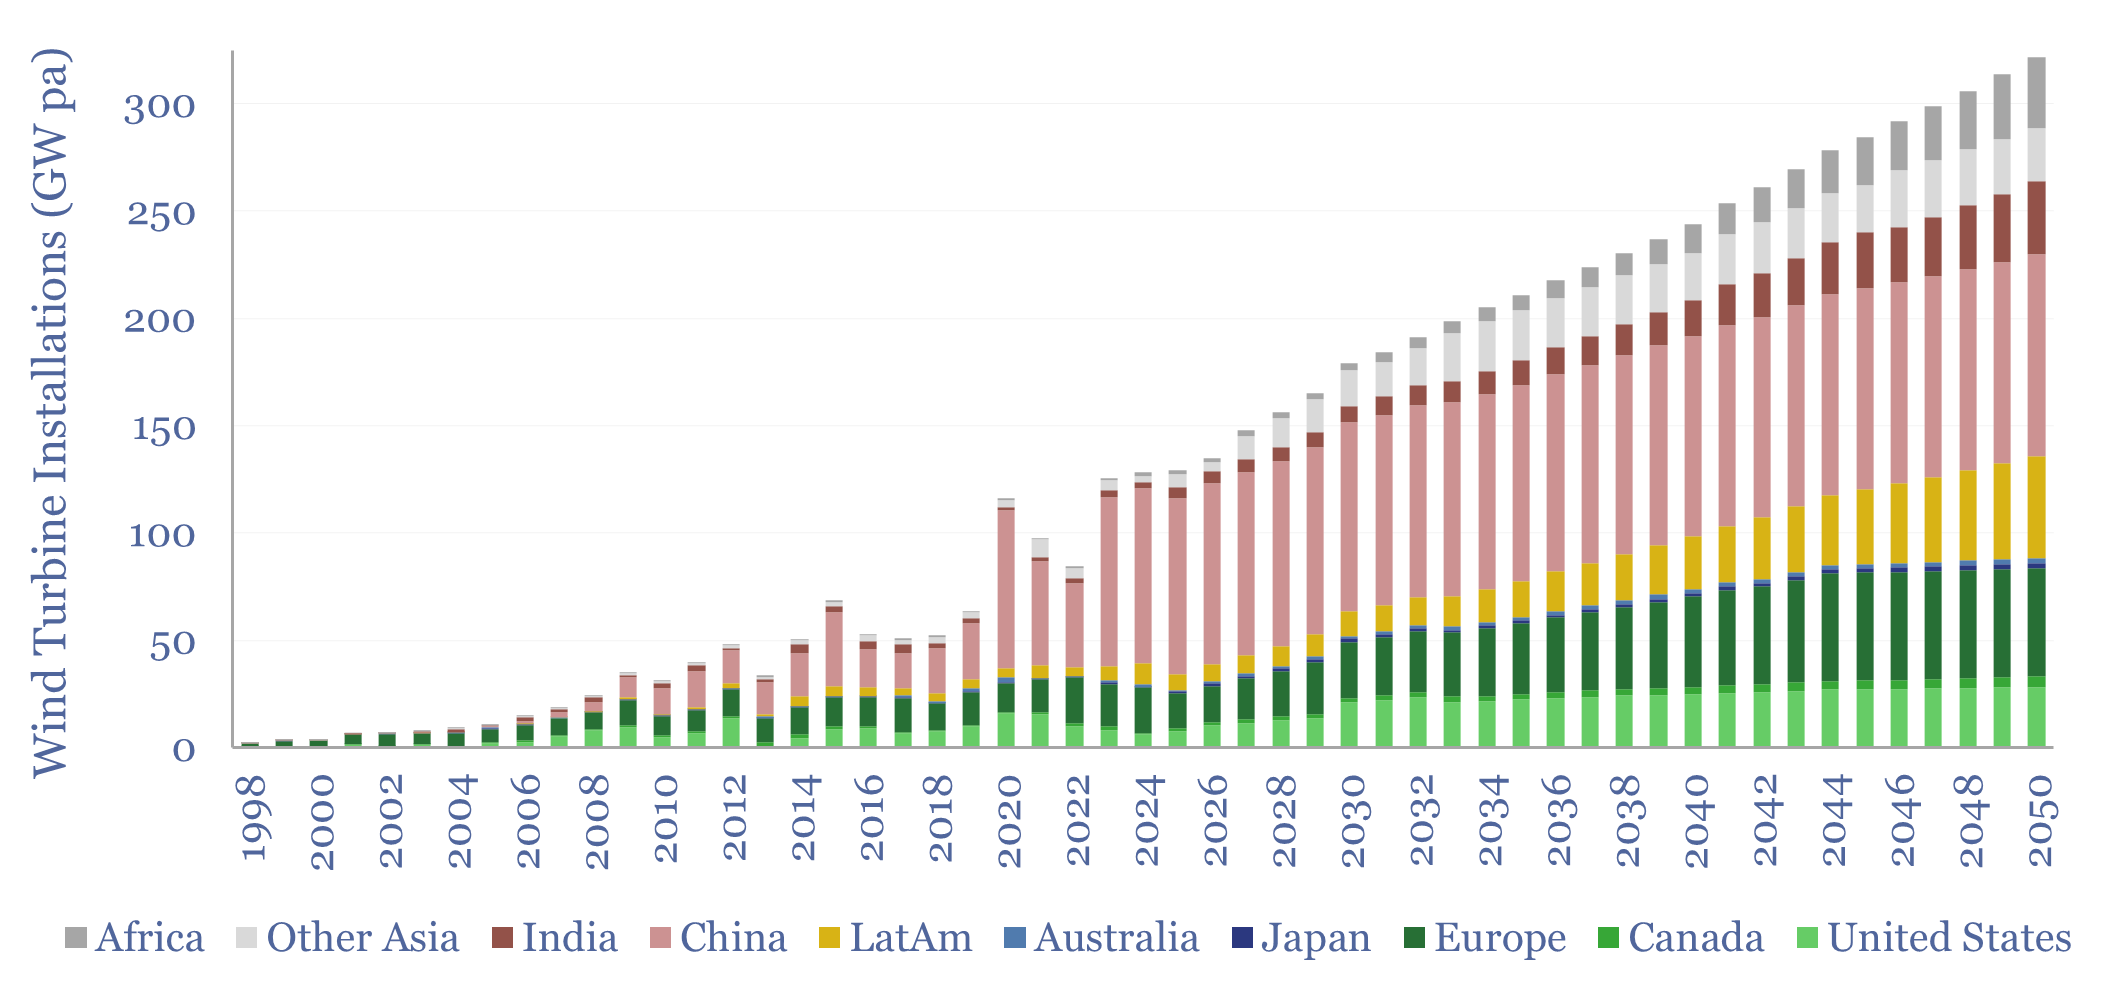
Wind and solar capacity additions?
Download
Wind and solar: total resource estimates?
Download

Wind turbines: wake losses?
Download

Renewable-heavy grids: total system costs?
Download
New energies deflation: myths and legends?
Download
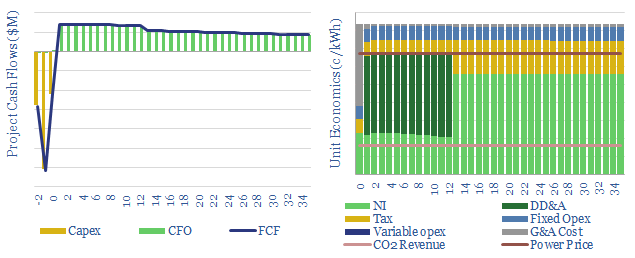
Onshore wind: the economics?
Download
Wind energy: beyond good and evil?
Download
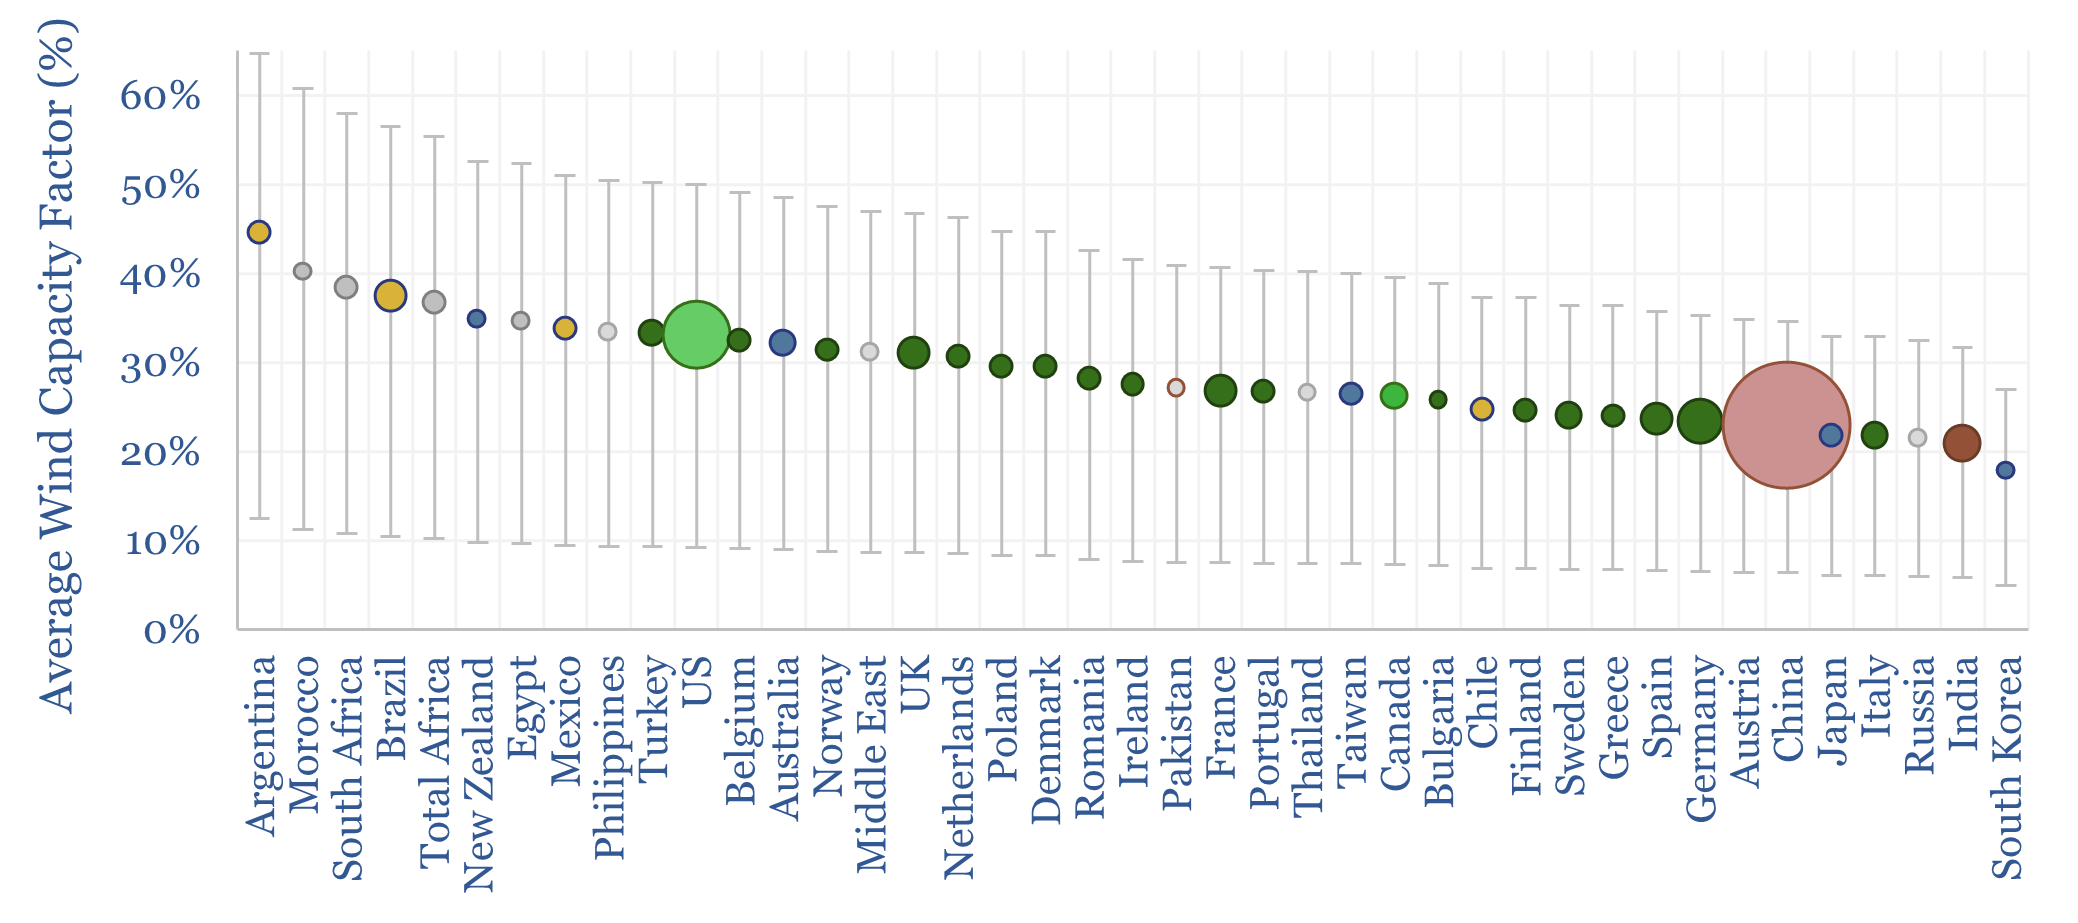
Wind turbine capacity factors: by country, by facility?
Download
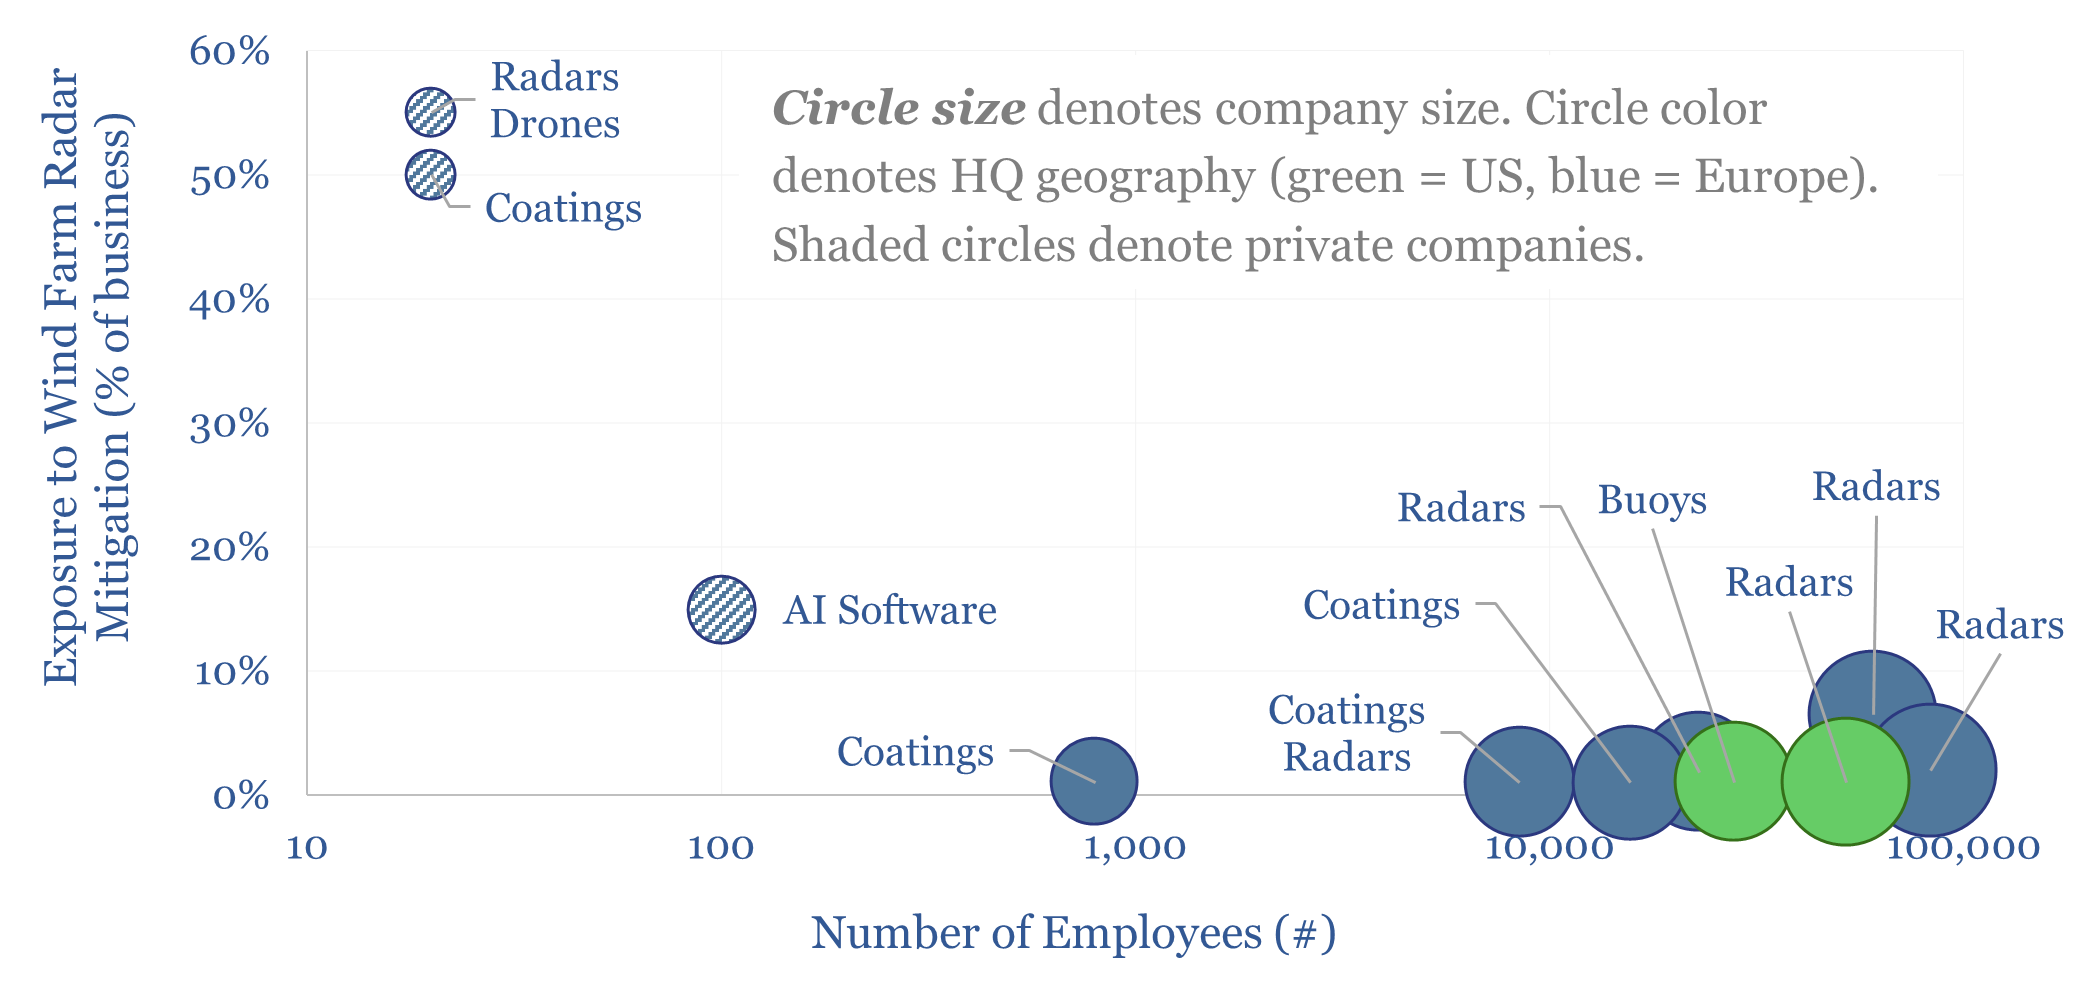
Companies mitigating radar interference of wind turbines?
Download
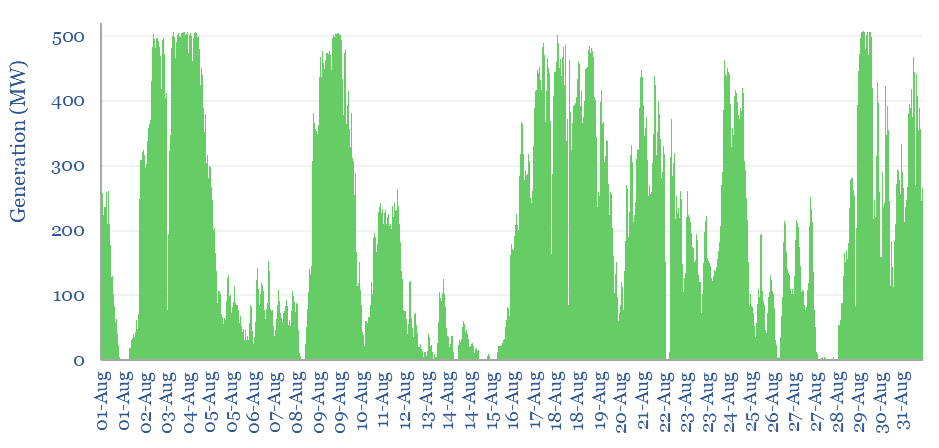
Wind generation case study: minute by minute volatility?
Download
Offshore wind: the lion, the witch and the wardrobe?
Download
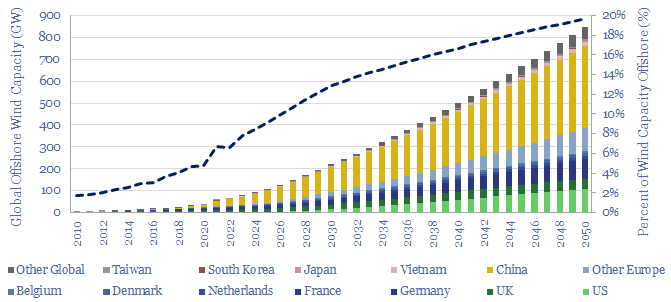
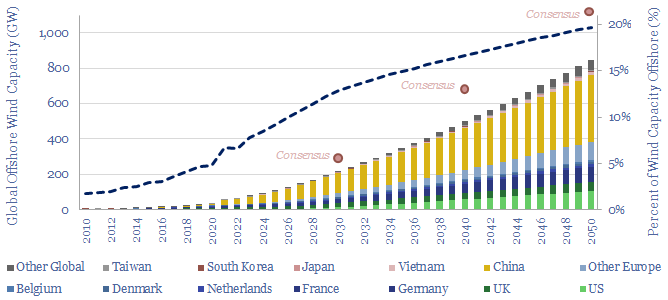
Offshore wind: capacity by country and forecasts?
Download
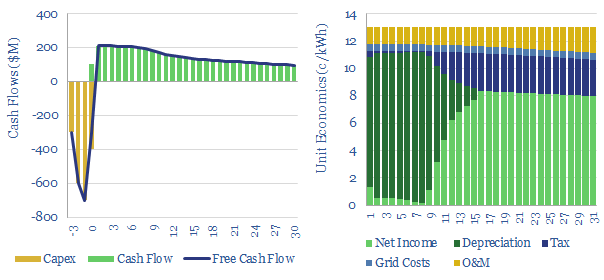
Offshore wind: levelized costs?
Download
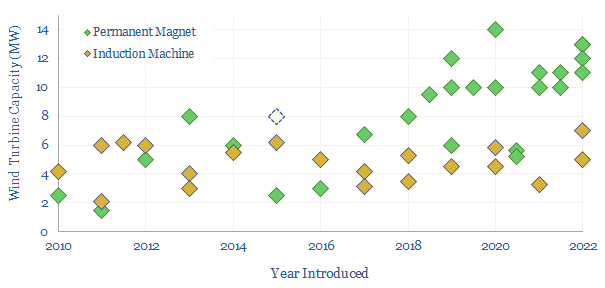
Wind turbine generators: DFIGs or Rare Earth magnets?
Download
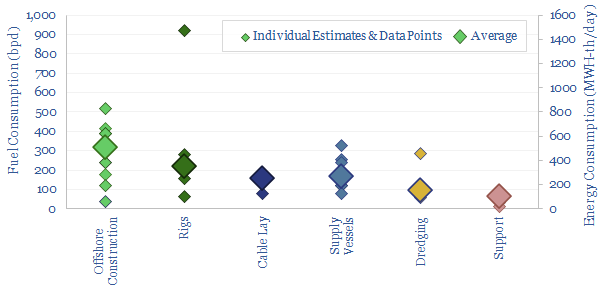
Offshore vessels: fuel consumption?
Download
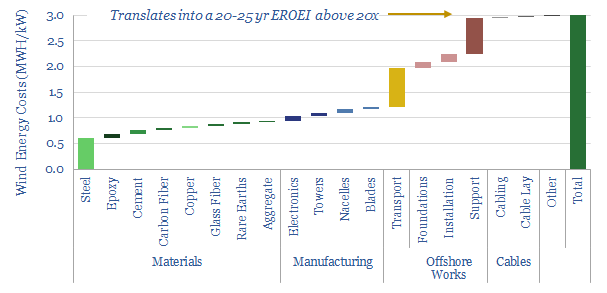
Wind power: energy costs, energy payback and EROEI?
Download
Renewables: how much time to connect to the grid?
Download
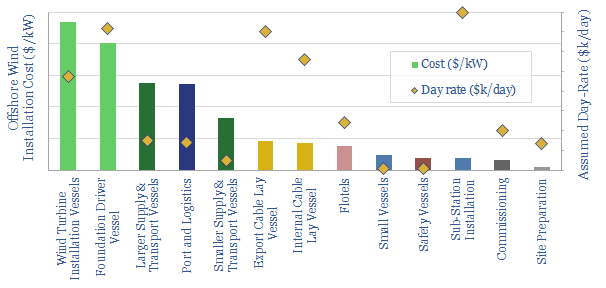
Offshore wind: installation costs by vessel?
Download
Goldwind: frequency response from wind turbines?
Download
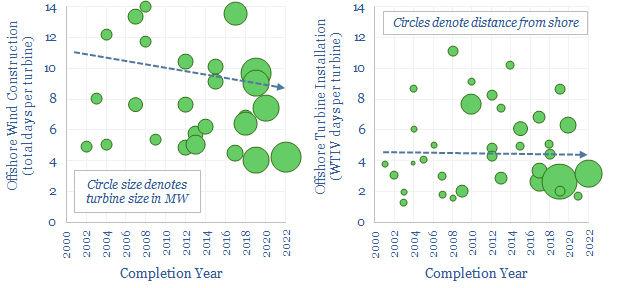
Offshore wind: installation vessels and time per turbine?
Download
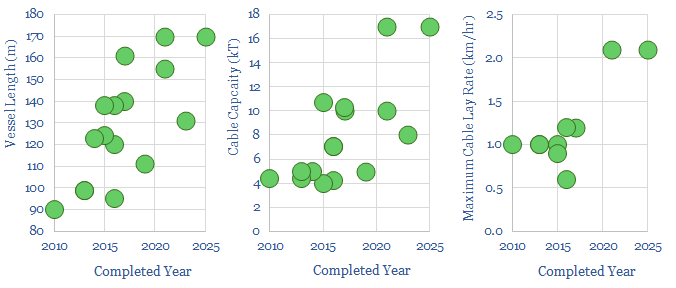
Cable installation vessels: costs and operating parameters?
Download
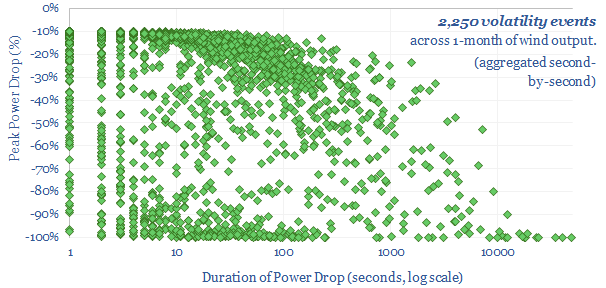
Wind volatility: second by second output data?
Download
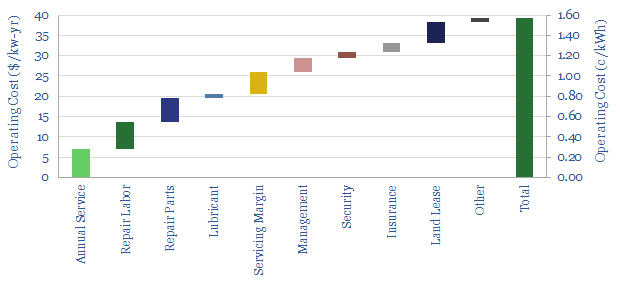
Wind power: operating costs?
Download
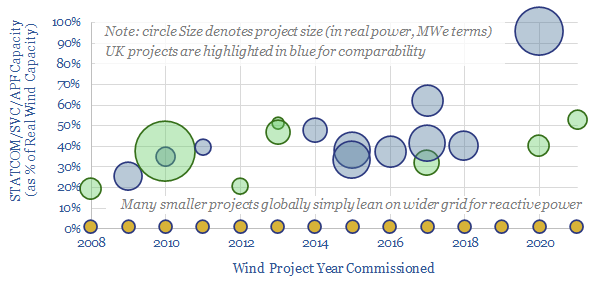
FACTS of life: upside for STATCOMs & SVCs?
Download
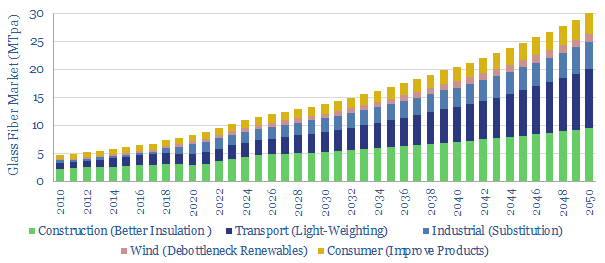
Glass fiber: what upside in the energy transition?
Download
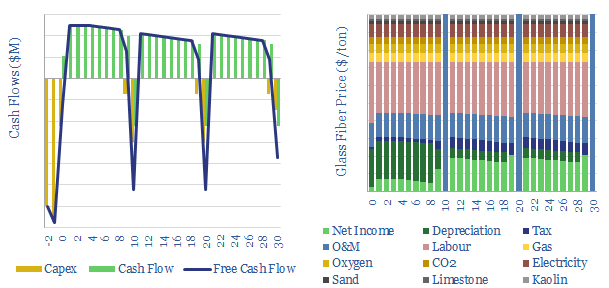
Glass fiber: the economics?
Download
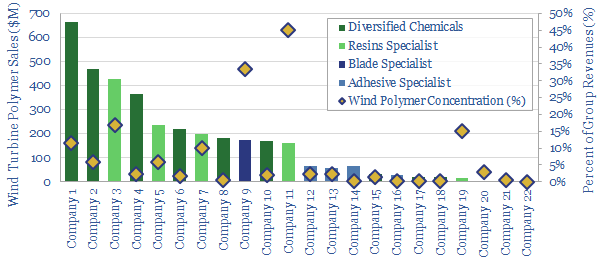
Wind turbines: screen of resin and polymer specialists?
Download
Renewables: can they ramp up faster?
Download
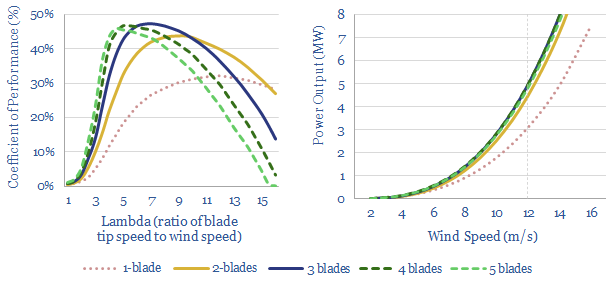
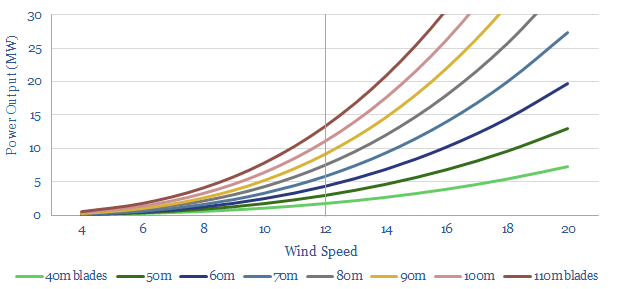
Windy physics: how is power of a wind turbine calculated?
Download
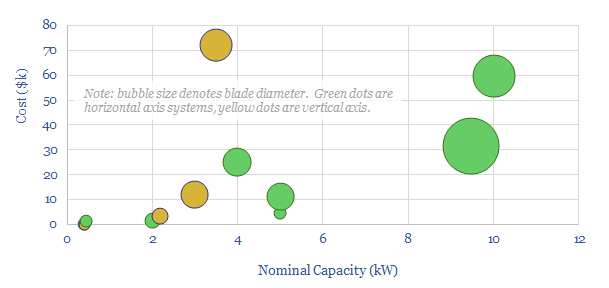
Small-scale wind turbines: leading companies?
Download
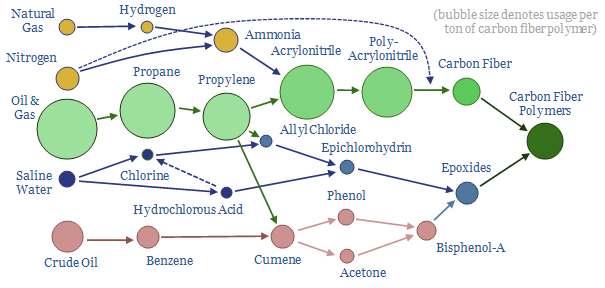
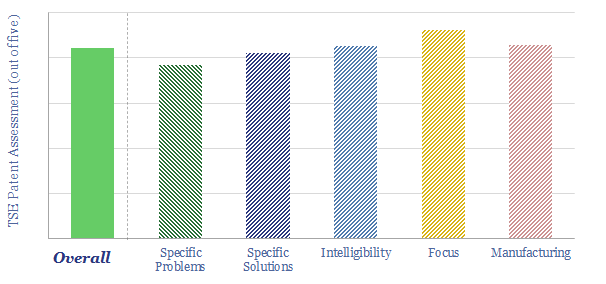
Carbon fiber: the miracle material?
Download
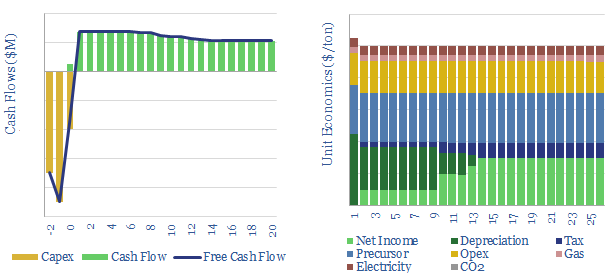
Carbon fiber: energy economics?
Download
Offshore wind: will costs follow Moore’s Law?
Download
Siemens Gamesa: giant wind turbine breakthroughs?
Download
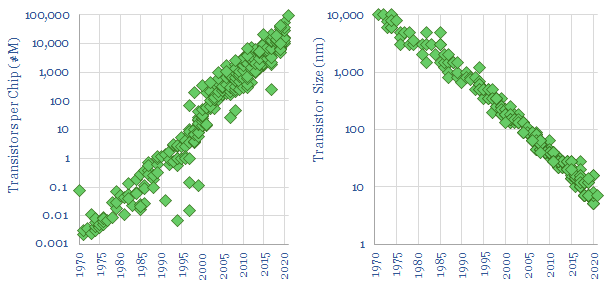
Moore’s law: causes and new energies conclusions?
Download
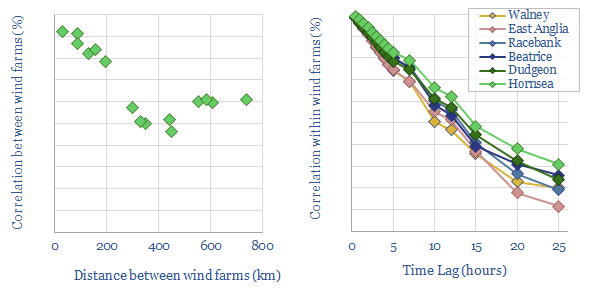
Inter-correlations between offshore wind farms?
Download
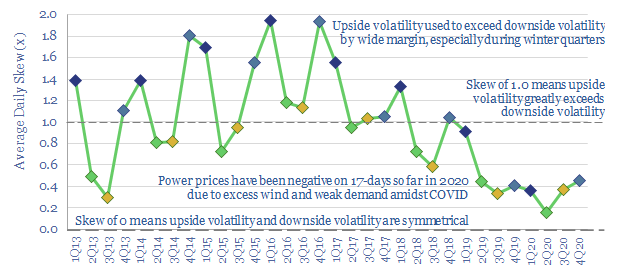
Prevailing wind: new opportunities in grid volatility?
Download
Floating offshore wind: what challenges?
Download
Nuclear Research
Japan: nuclear restart tracker?
Download
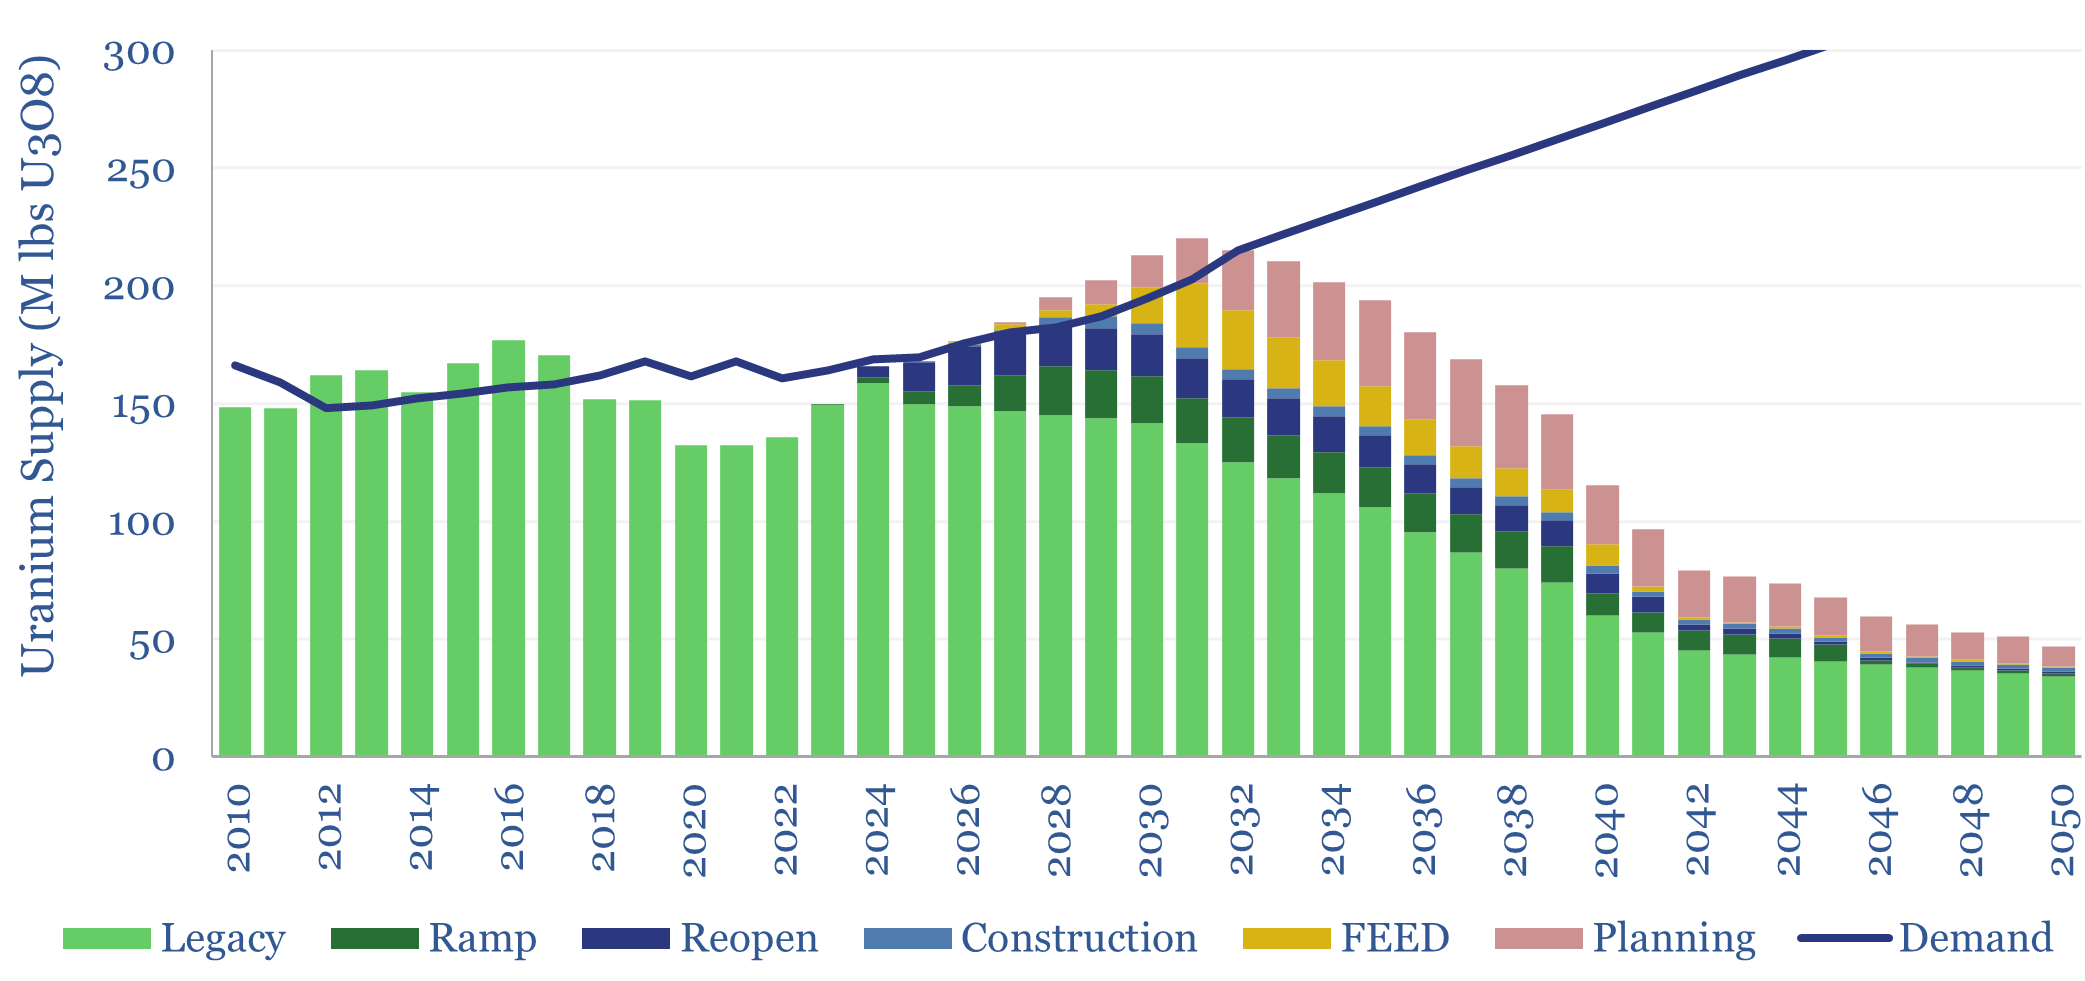
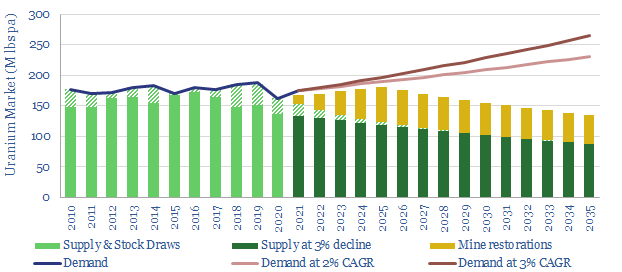
Global uranium supply-demand?
Download
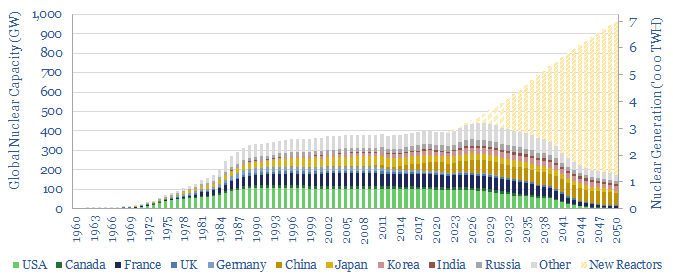
Global nuclear capacity: by reactor, by country, over time?
Download
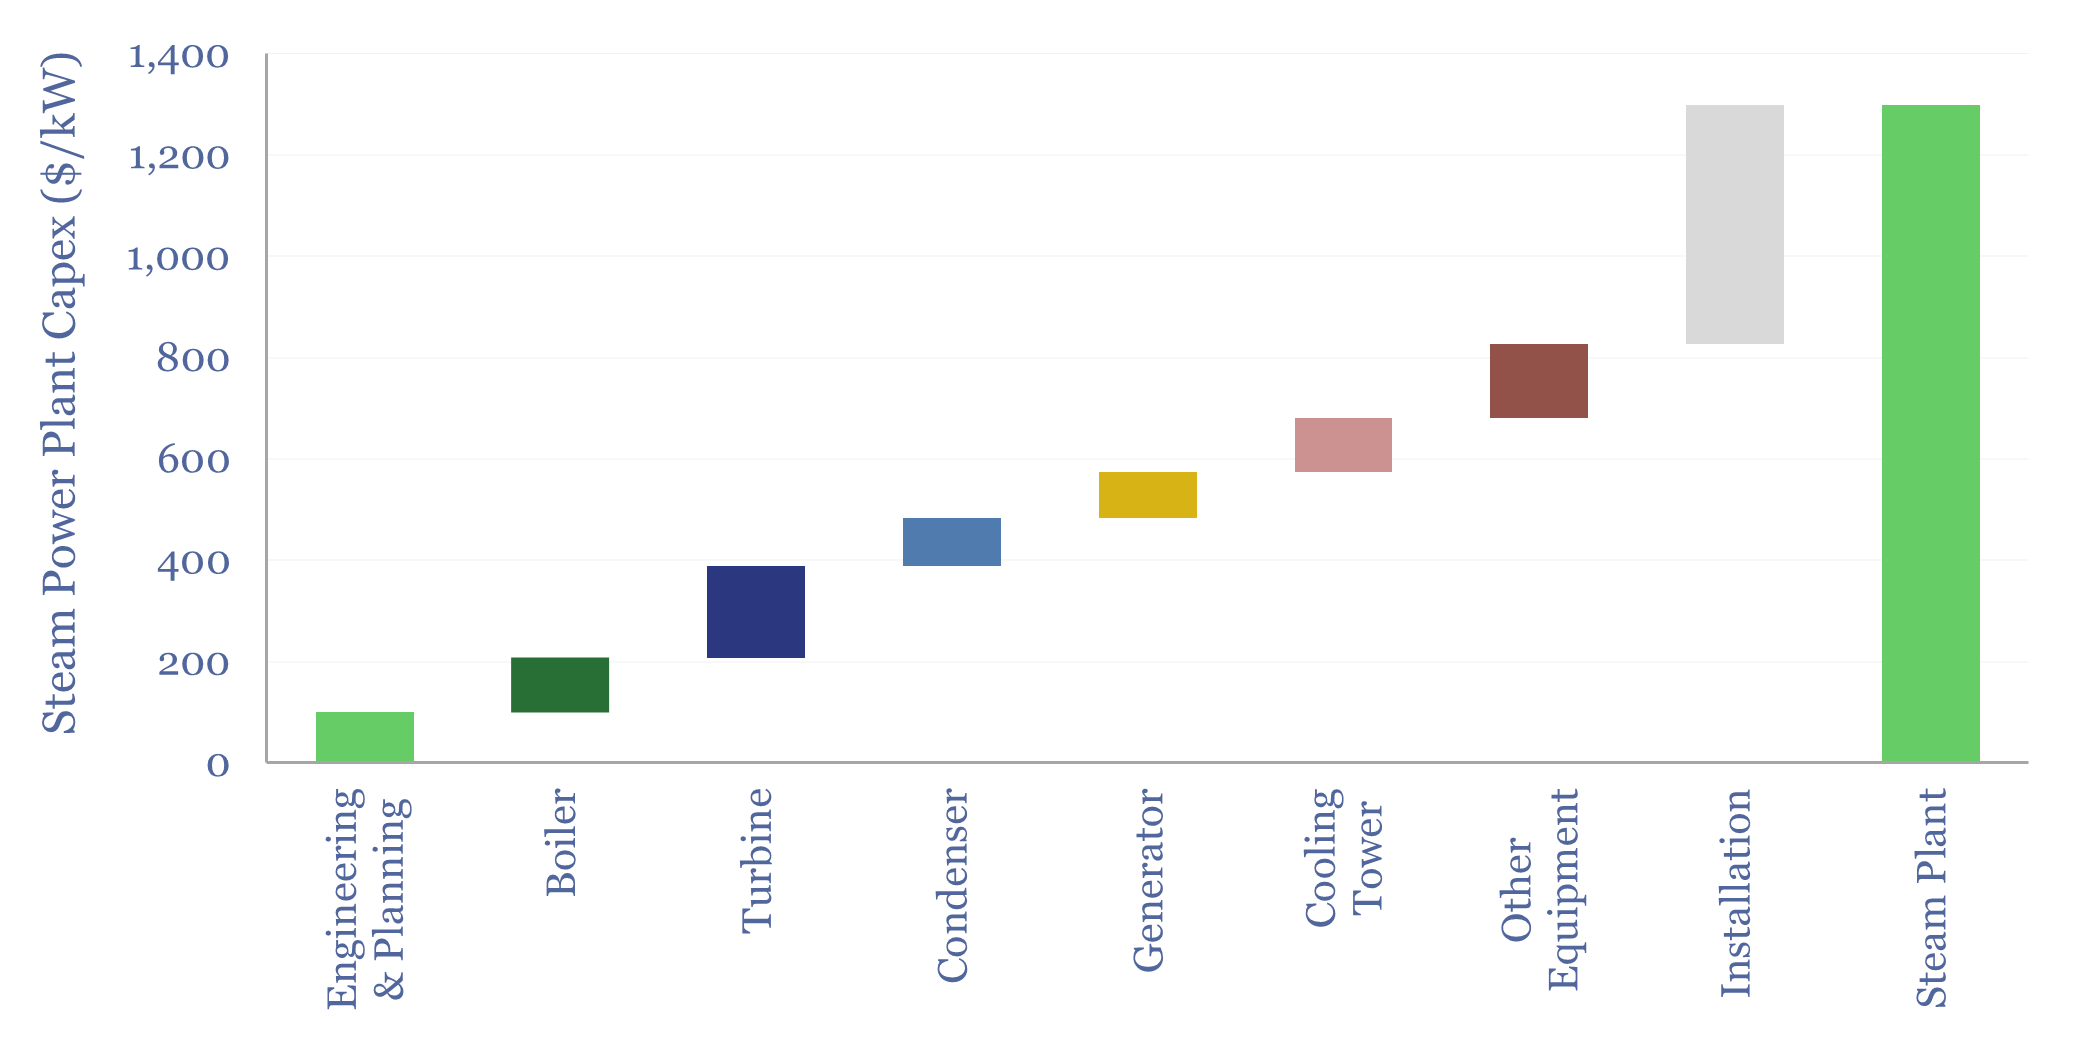
Steam generation: capex costs?
Download
Nuclear equipment manufacturers: company screen?
Download

Deep Fission: next-gen nuclear technology?
Download
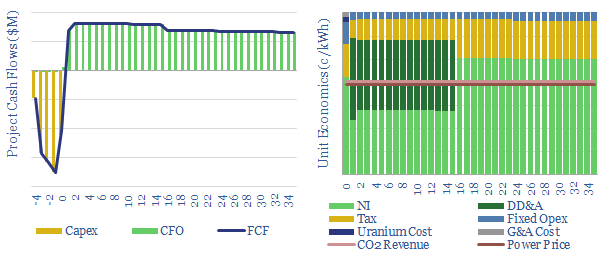
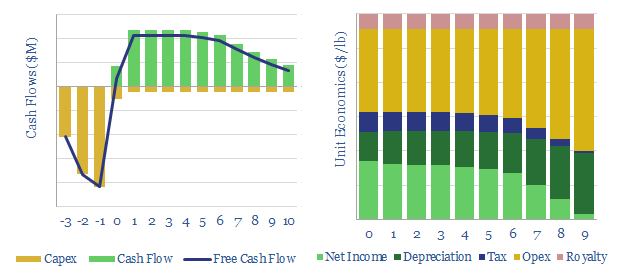
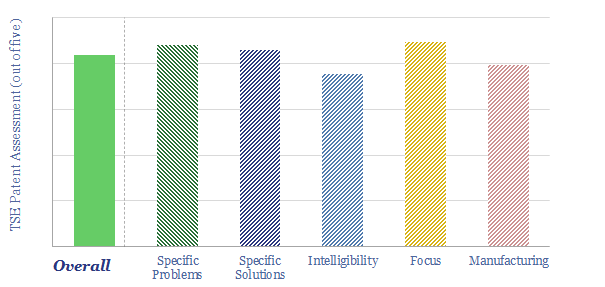
Nuclear Power Project Economics
Download
Nuclear uprates: capex costs?
Download
Nuclear SMRs: grown ups?
Download
Next-generation nuclear companies: future fission and fusion?
Download
Radioactivity of materials: energy, Rare Earths and nuclear?
Download
US nuclear generation by company?
Download
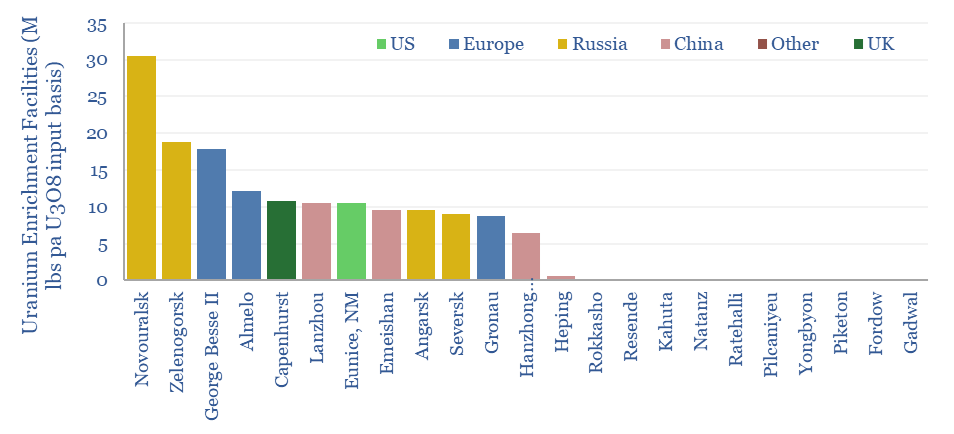
Uranium enrichment: by country, by company, by facility?
Download
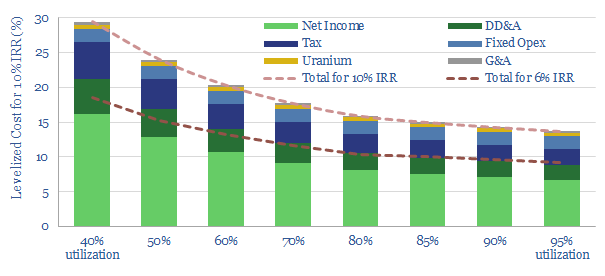
Uranium mining: the economics?
Download

Oklo: fast reactor technology?
Download
Reaching criticality: nuclear re-accelerates?
Download
X Energy: nuclear fuel breakthrough?
Download
TerraPower: nuclear breakthrough?
Download
Terrestrial Energy: small modular reactor breakthrough?
Download
General Fusion: magnetized fusion breakthrough?
Download
Commonwealth Fusion: nuclear fusion breakthrough?
Download
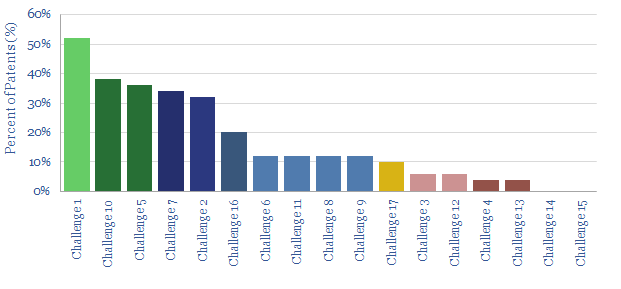
Nuclear fusion: what are the challenges?
Download
NuScale: small modular reactor breakthrough?
Download
Back-stopping renewables: the nuclear option?
Download
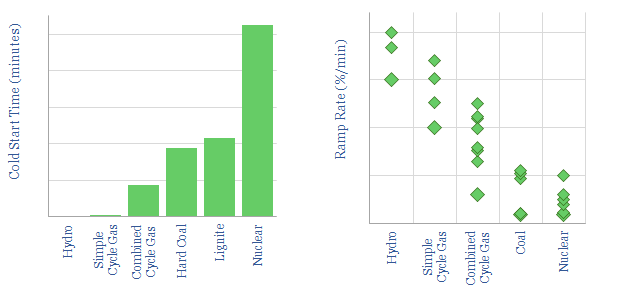
Power plants: cold starts and ramp rates?
Download
Nuclear power: what role in the energy transition?
Download
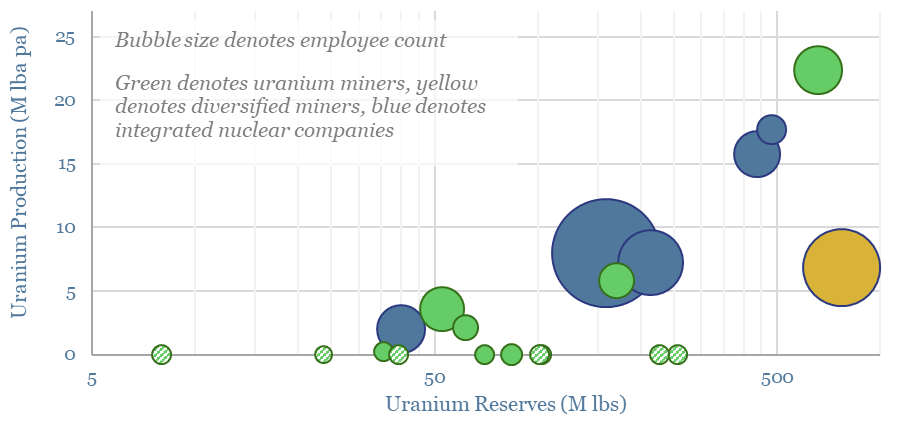
Uranium production: by company and by country?
Download
Batteries Research
Energy storage: top conclusions into batteries?
Download
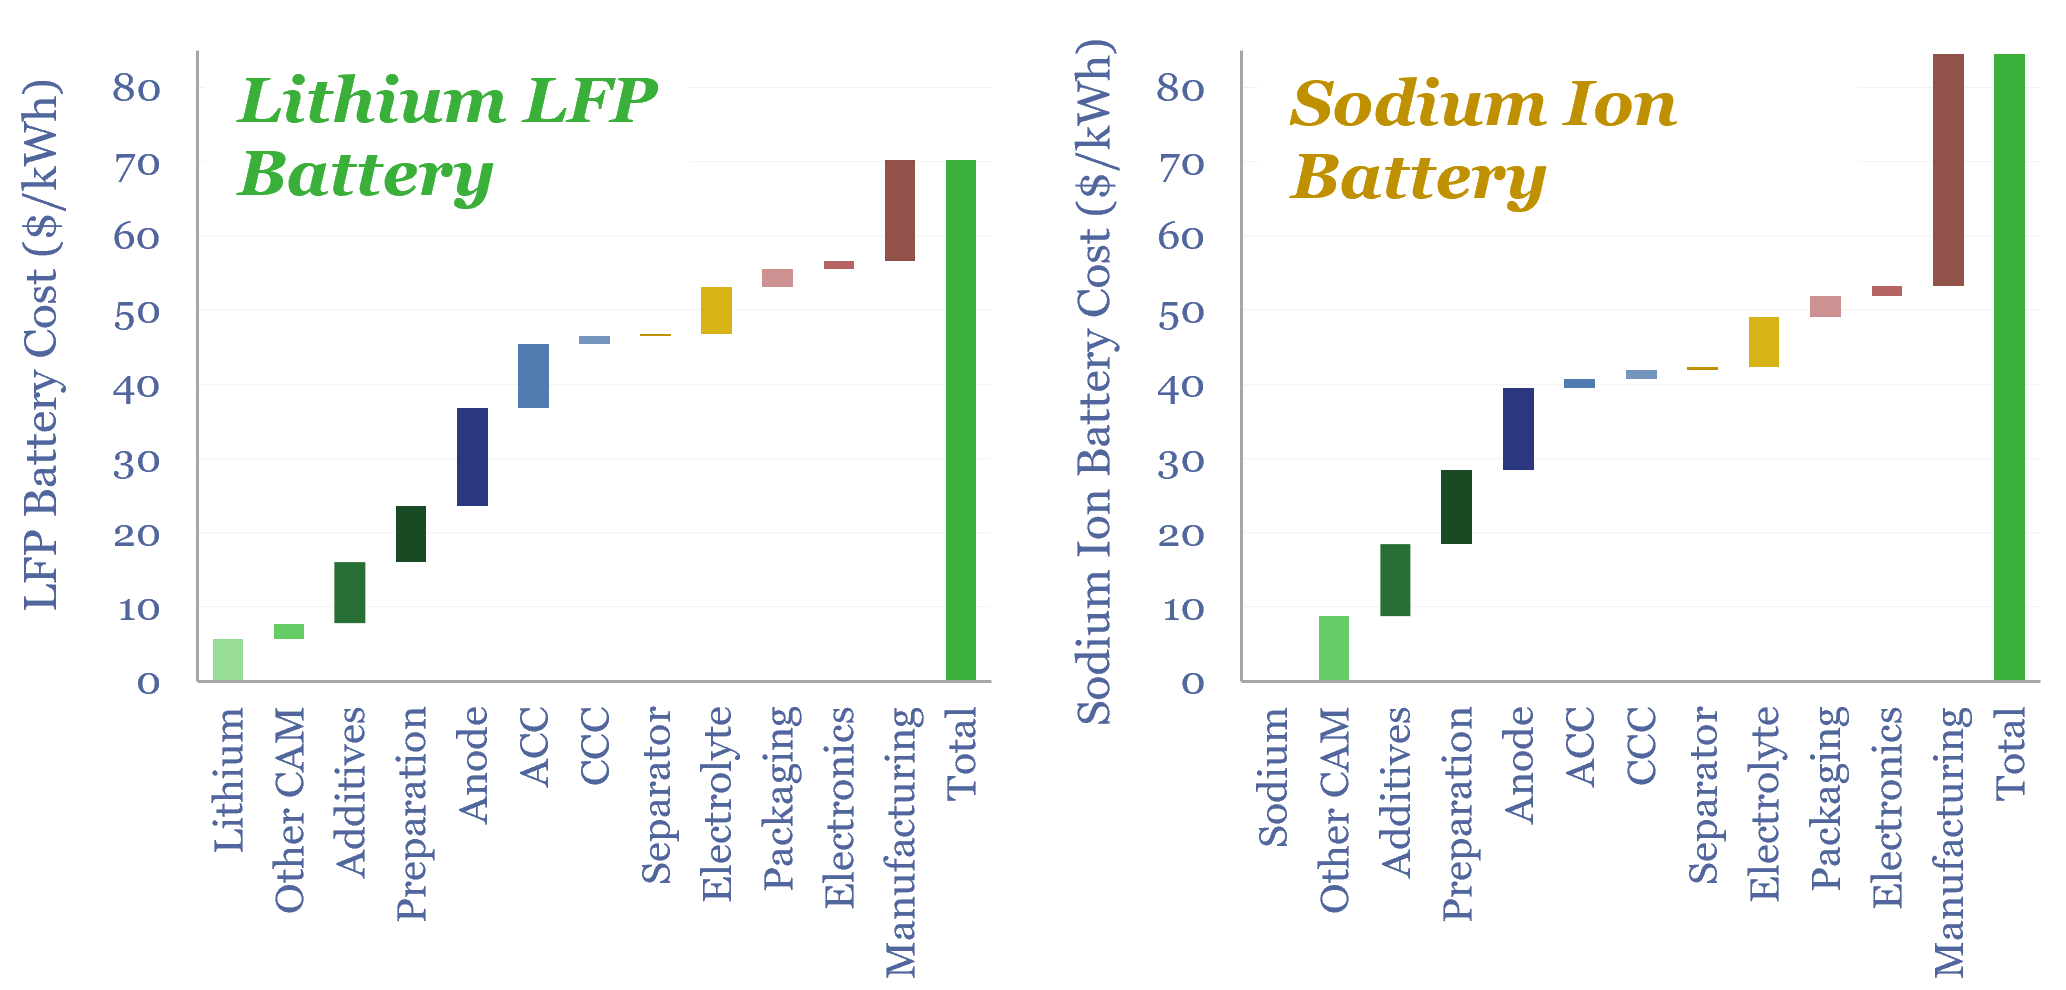
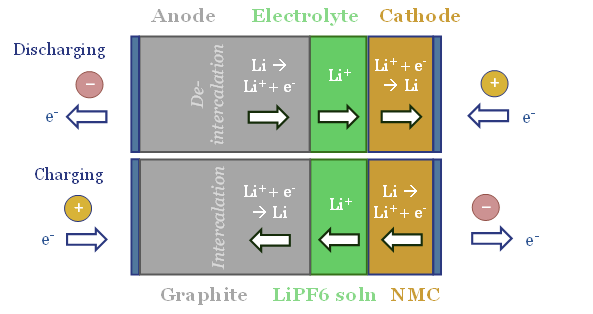
Sodium ion batteries: comparing costs versus LFP?
Download
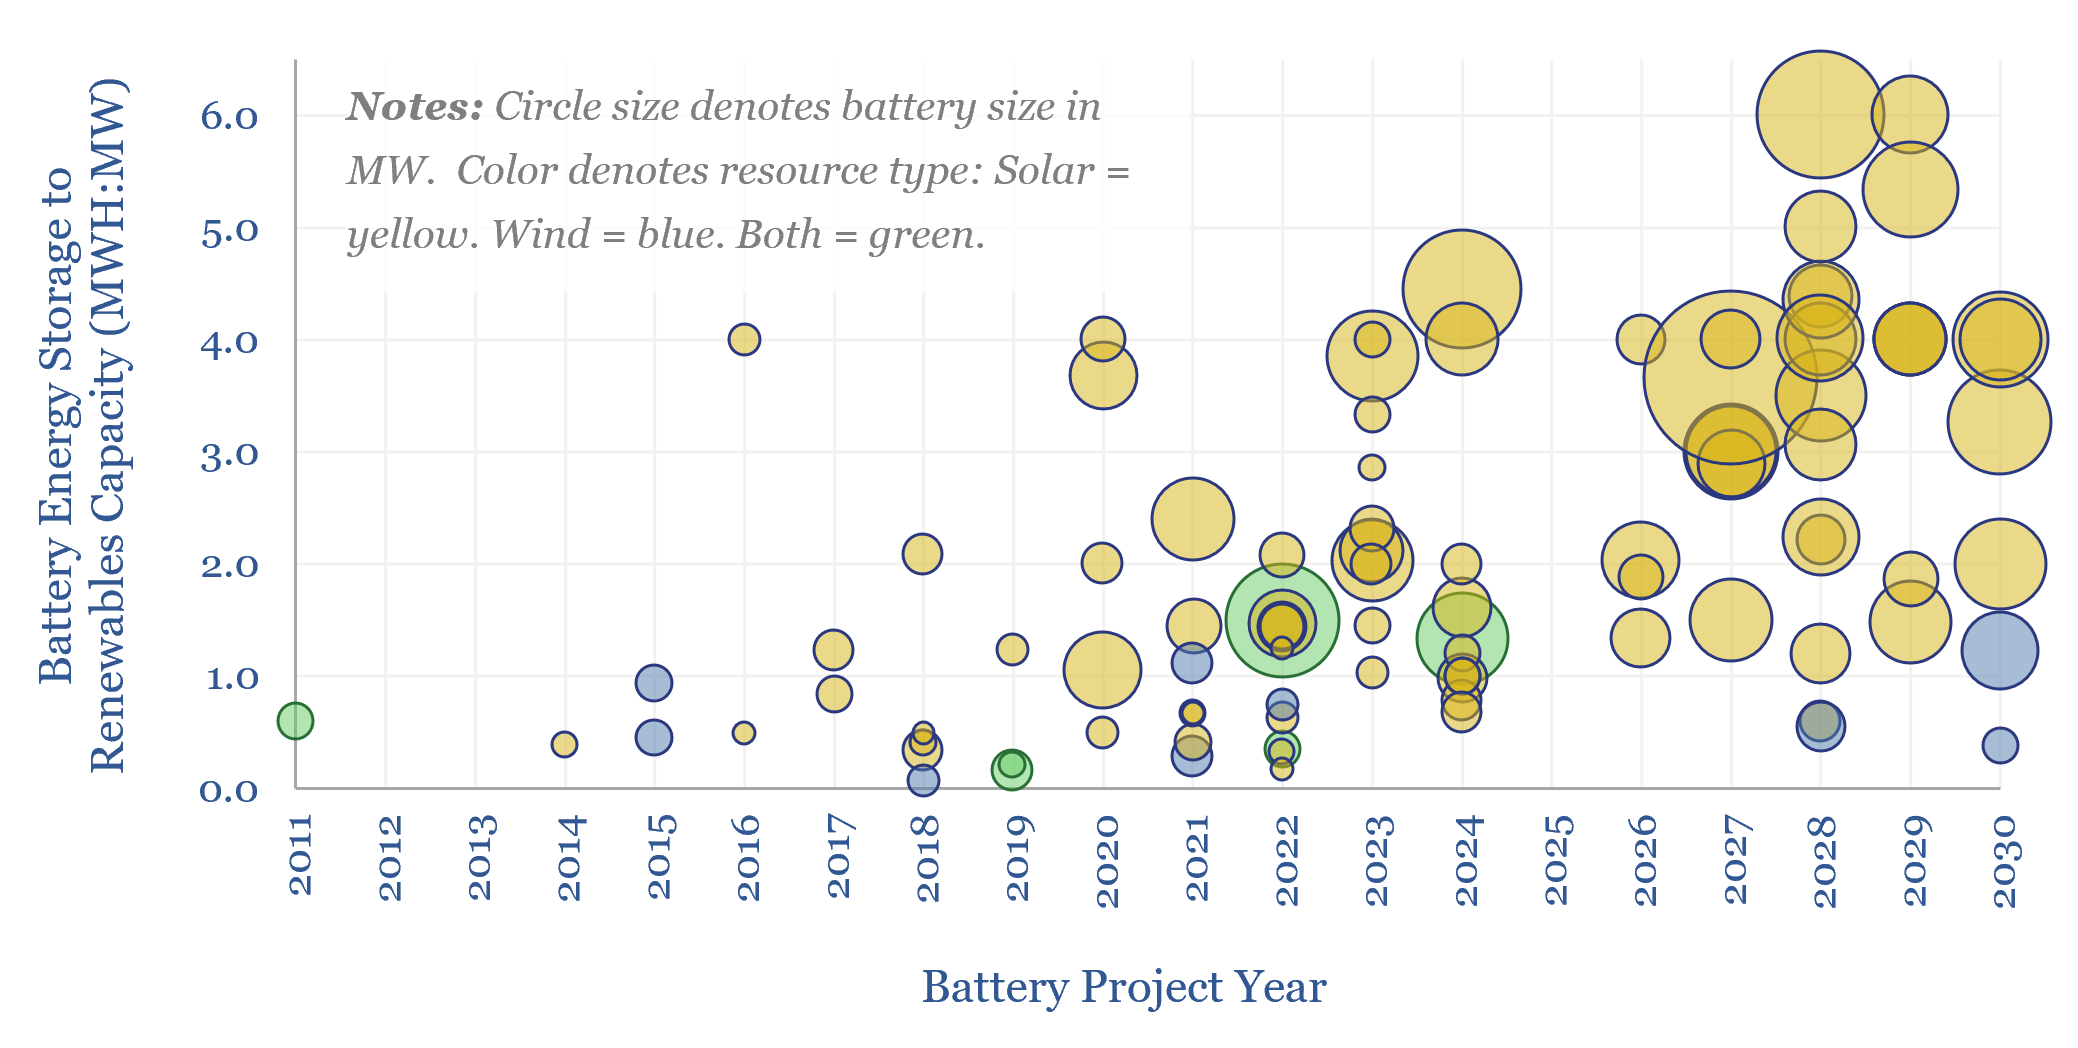
Renewables plus batteries: co-deployments over time?
Download
CATL: sodium ion battery breakthrough?
Download

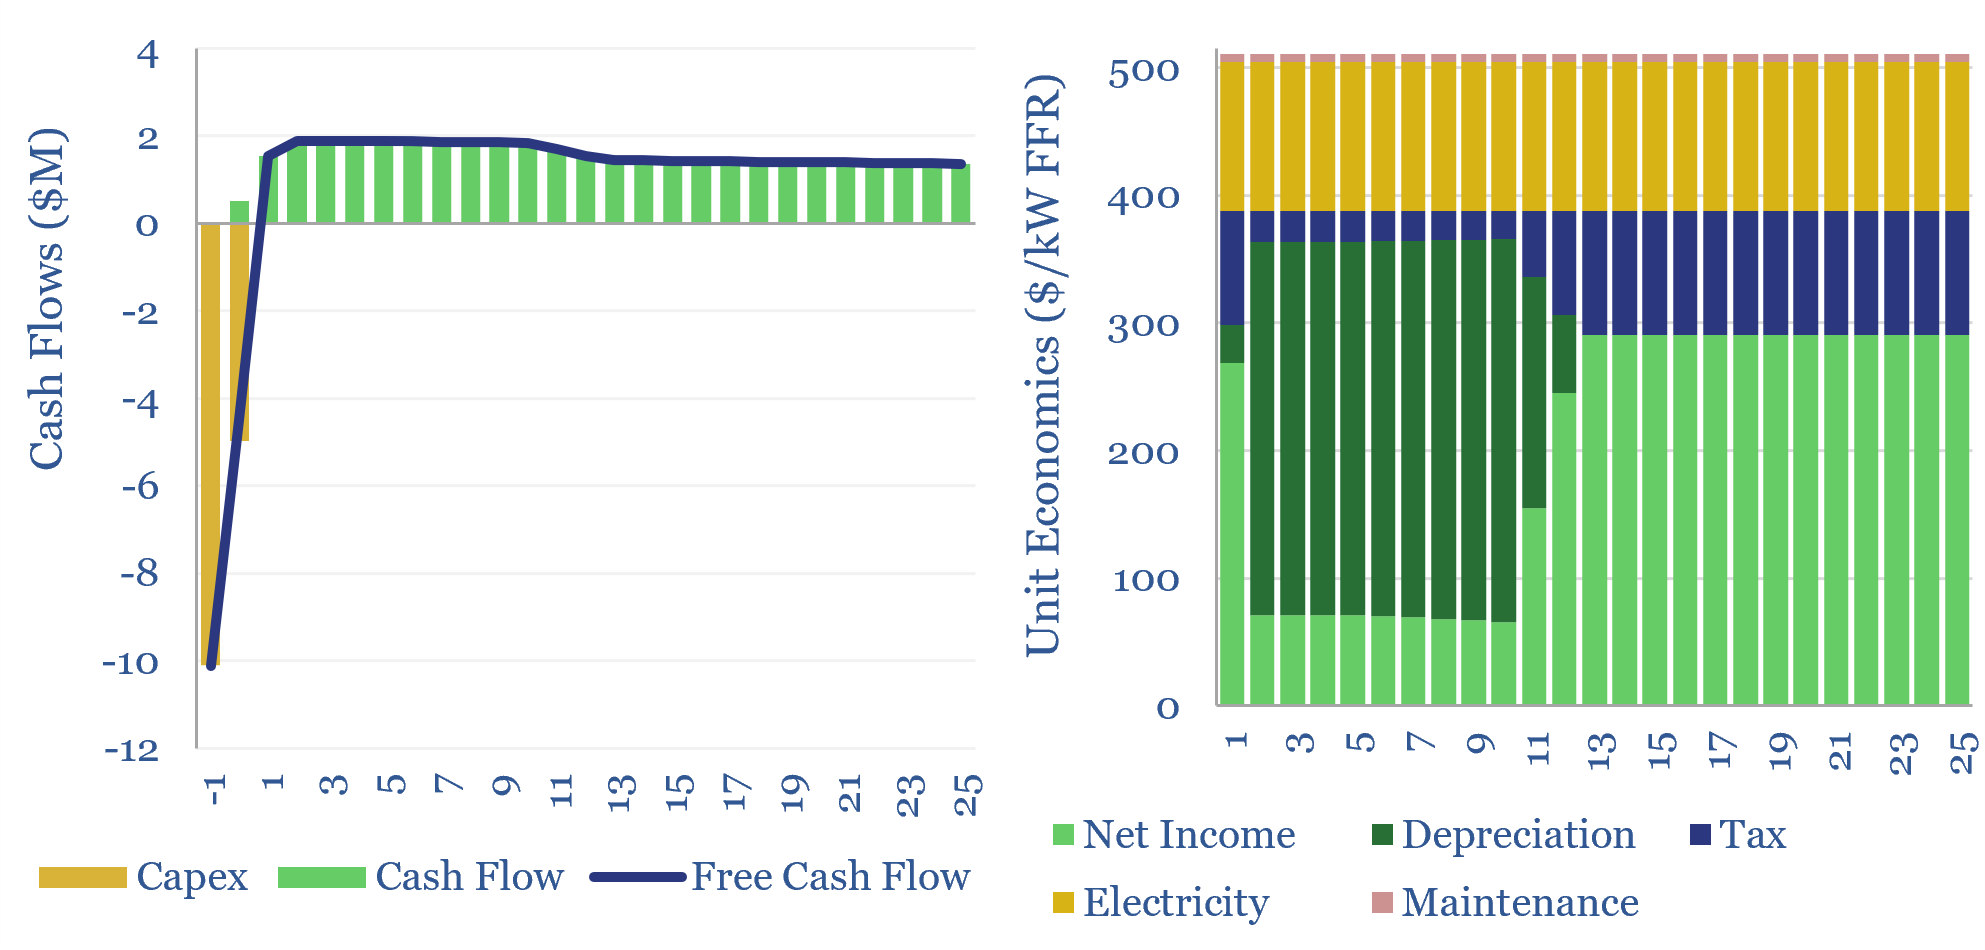
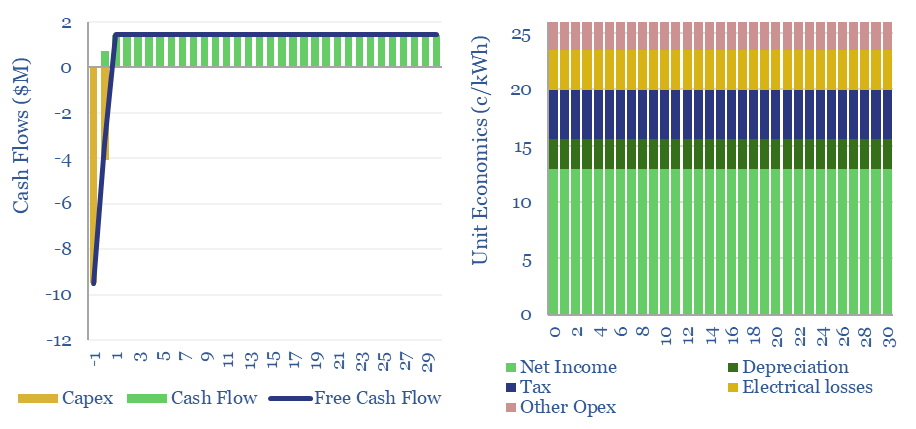
Grid-scale battery costs: the economics?
Download
Energy storage: to infinity and beyond?
Download

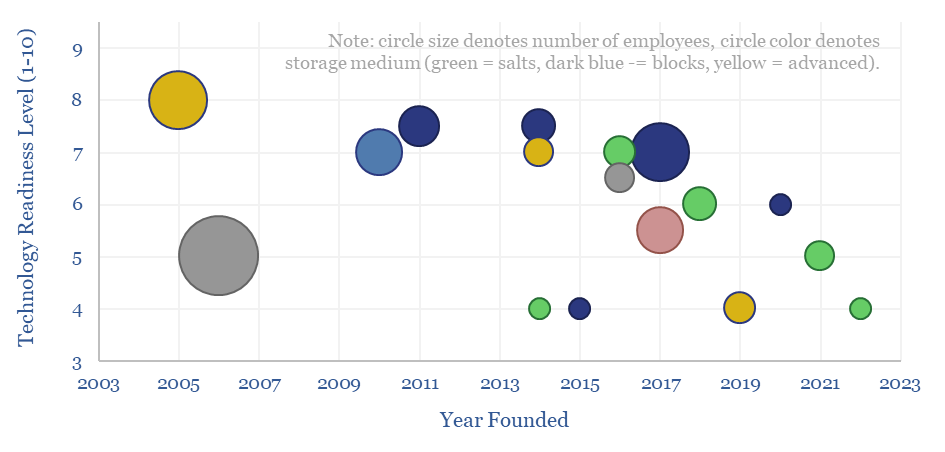
Battery integrators: leading companies in BESS?
Download
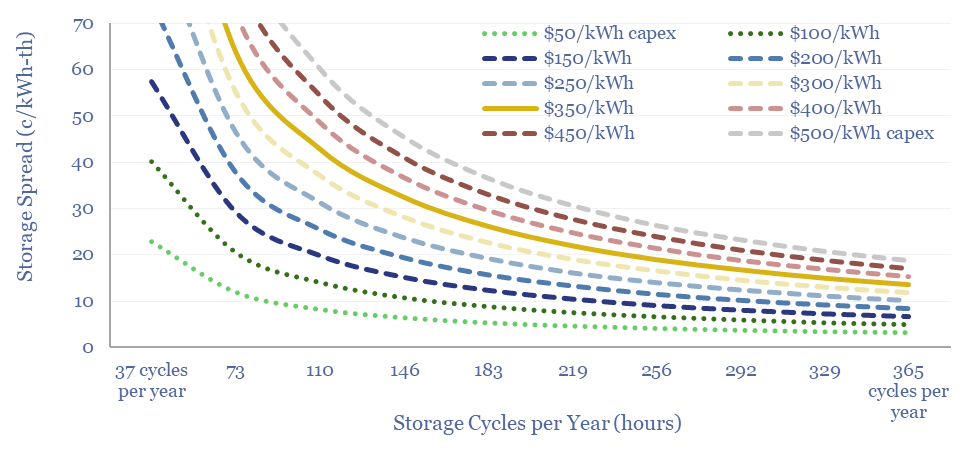
Thermal energy storage: cost model?
Download

Global lithium production: by project, by country, by resource?
Download
Can solar provide round-the-clock power for data-centers?
Download

Lithium: global demand forecasts?
Download
Electric vehicle charging: the economics?
Download
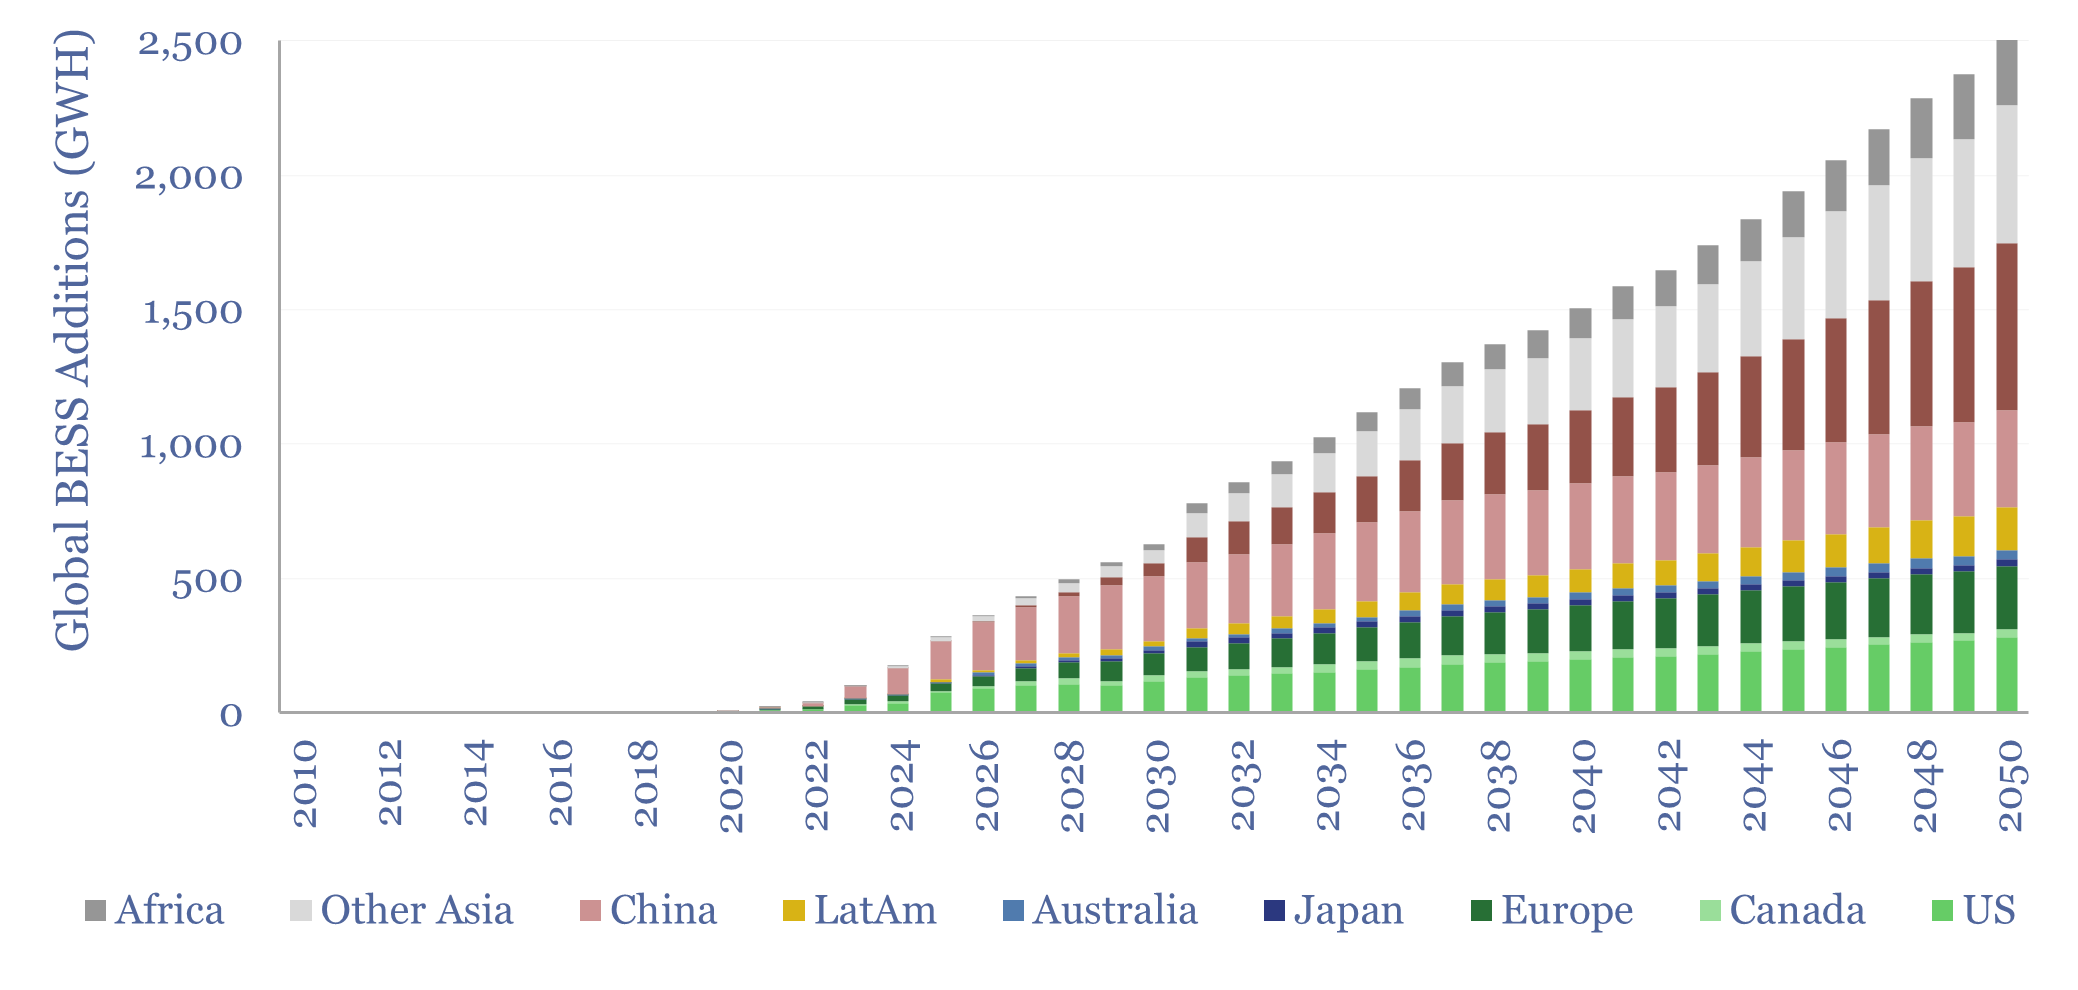
Battery energy storage systems: capacity forecasts?
Download
Solar+battery co-deployments: cost profiles?
Download

Supercapacitors: the economics?
Download
Economics of flywheels: fast frequency response?
Download
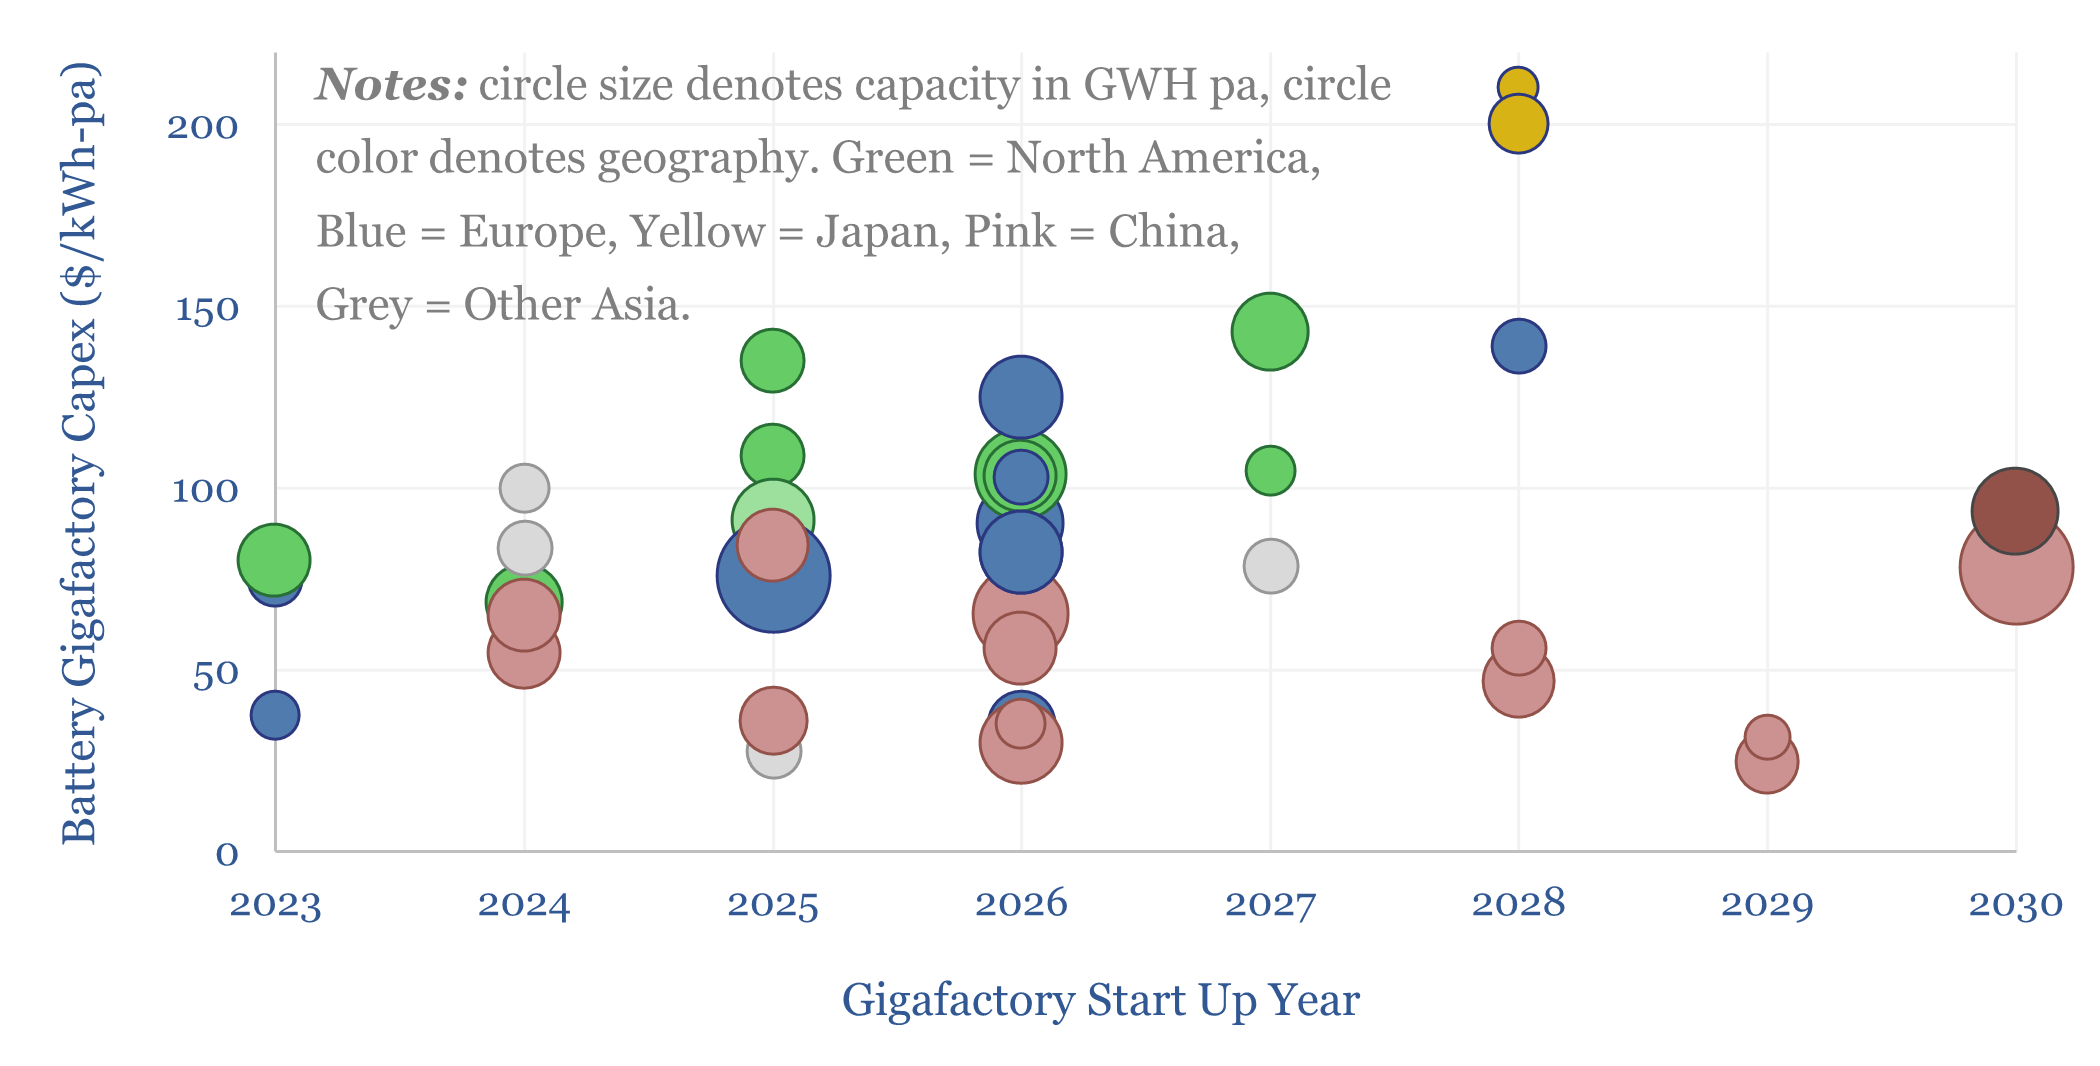
Battery gigafactory capex costs?
Download
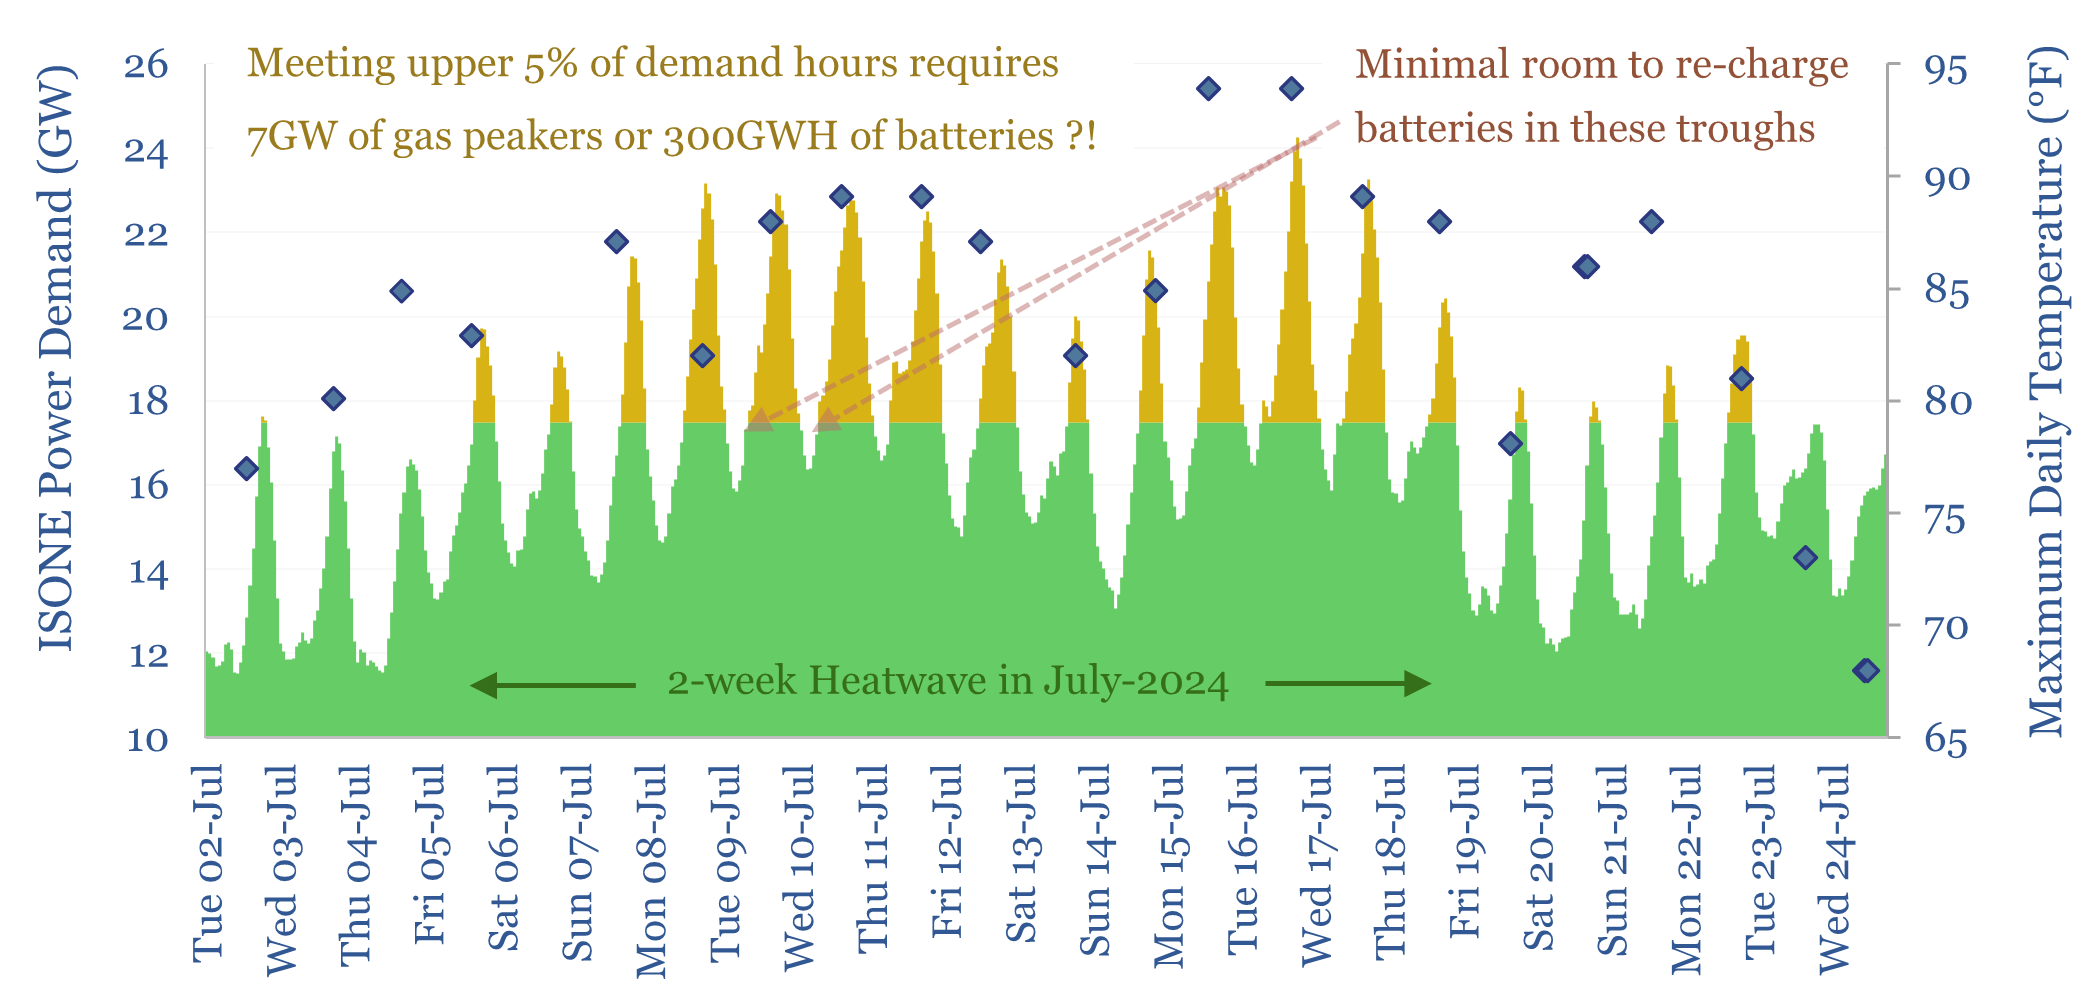
Peak loads: can batteries displace gas peakers?
Download
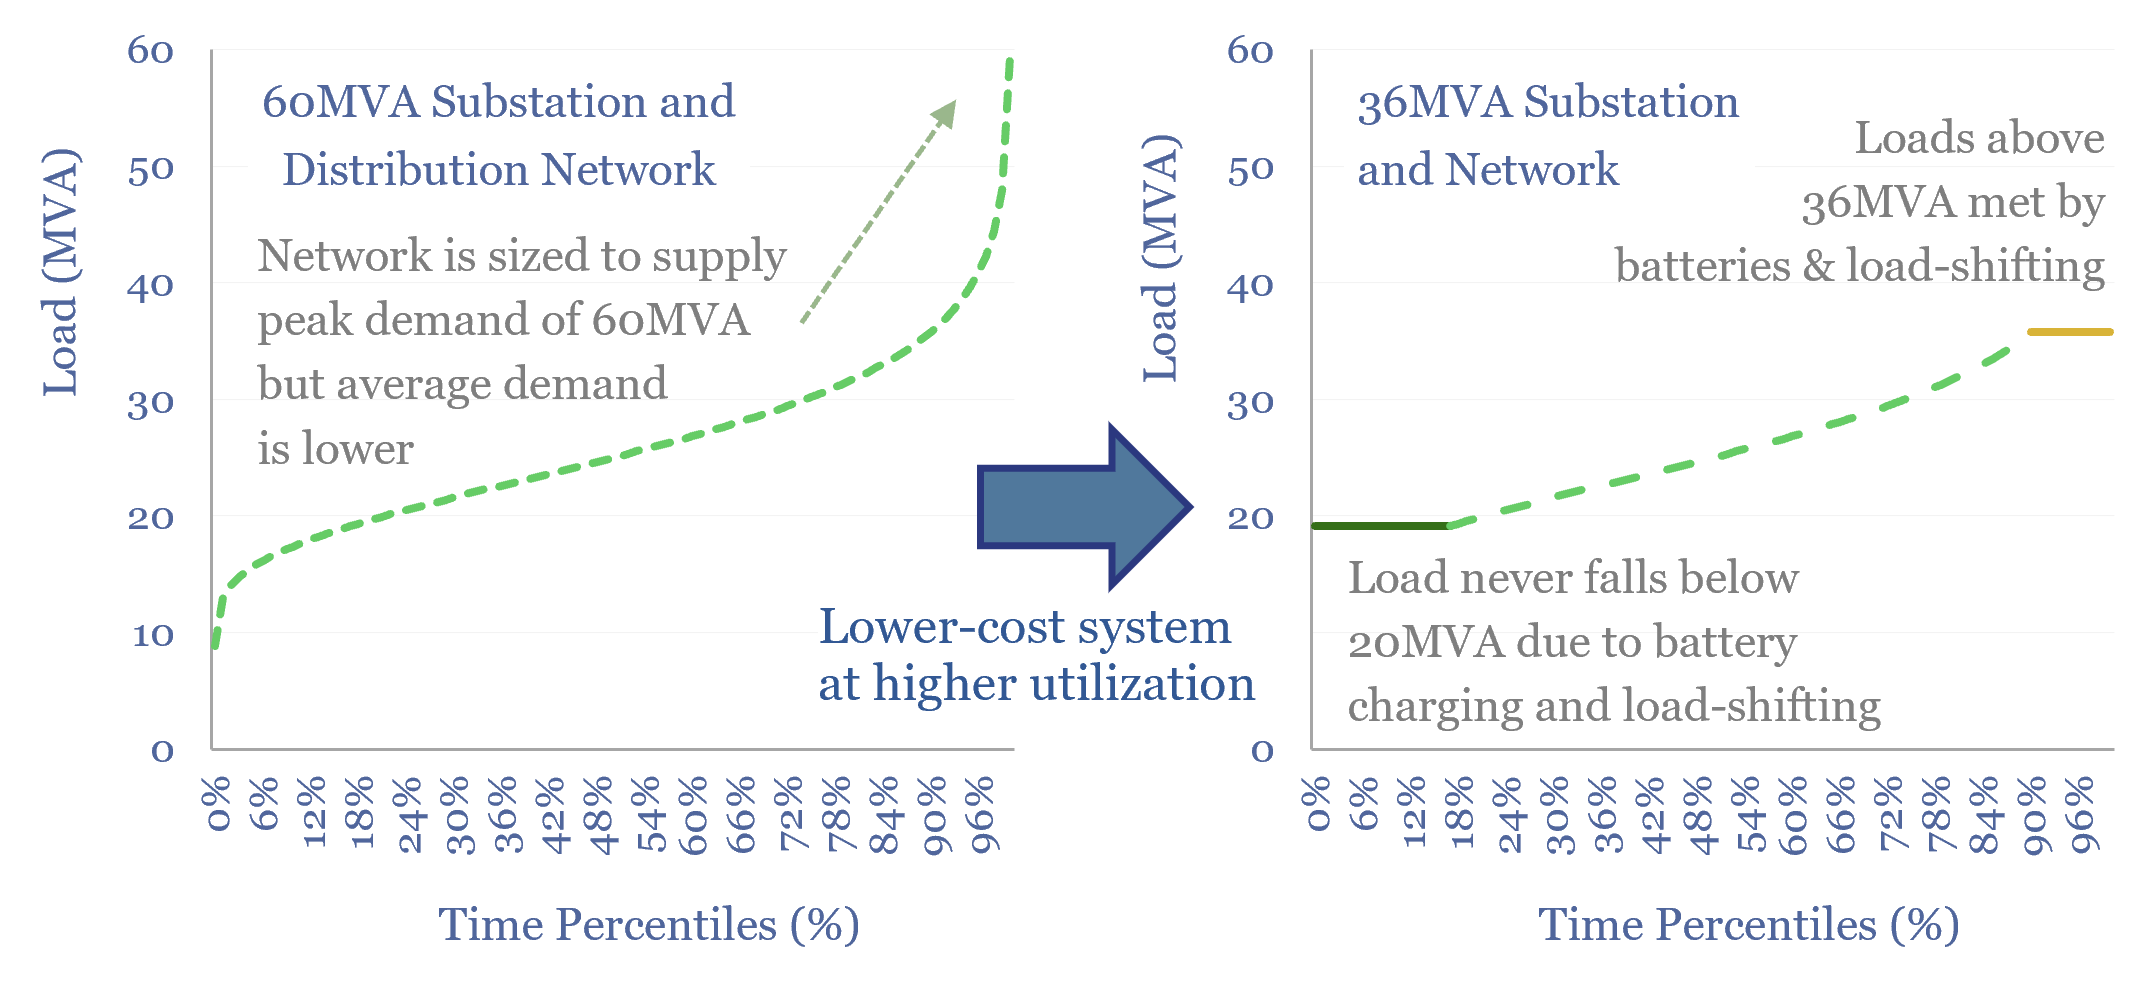
Power grid bottlenecks: flattening the curve?
Download
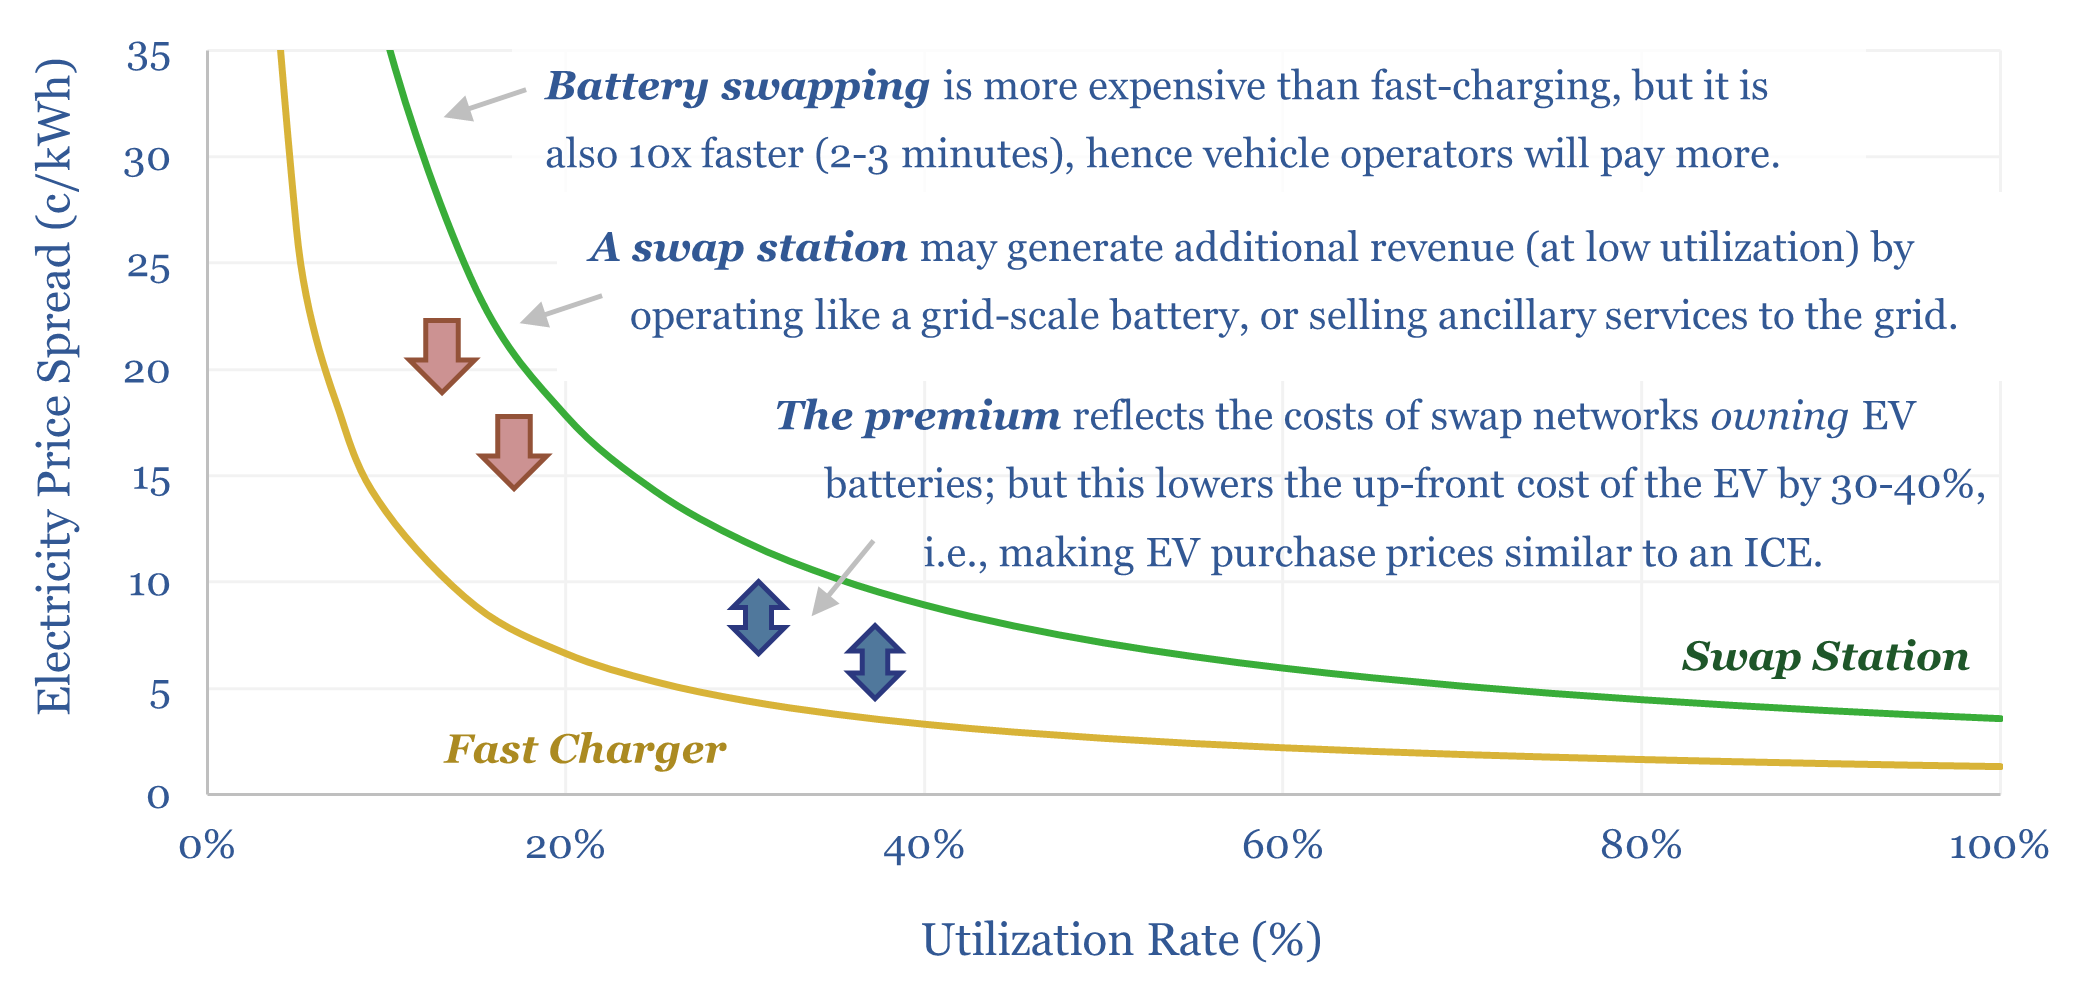
Battery swapping: off to the races?
Download
Solar plus batteries: the case for co-deployment?
Download
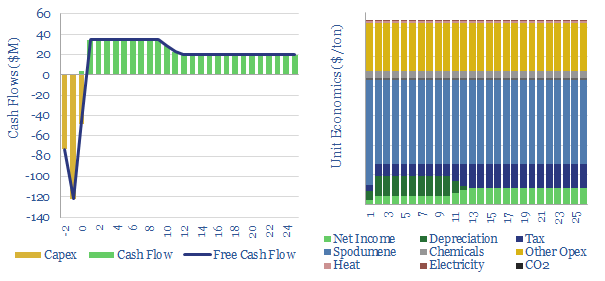
Lithium mining and upgrading: the economics?
Download
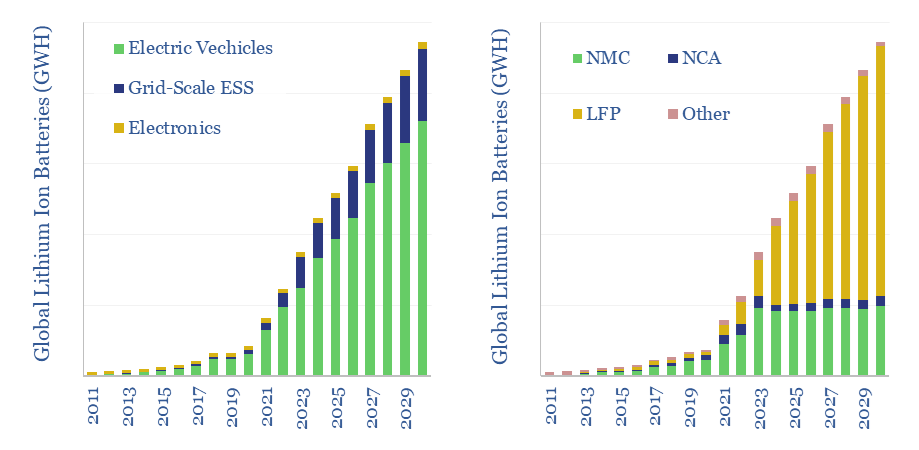
Lithium ion battery volumes by chemistry and use?
Download
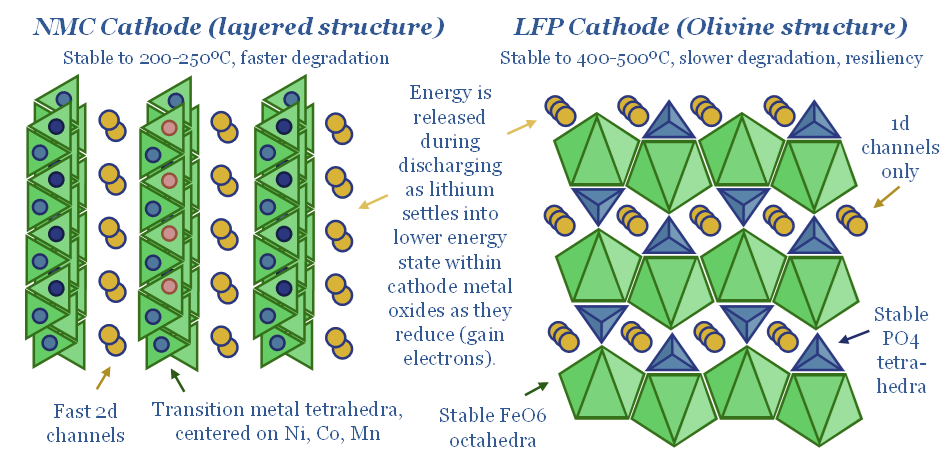
LFP batteries: cathode glow?
Download
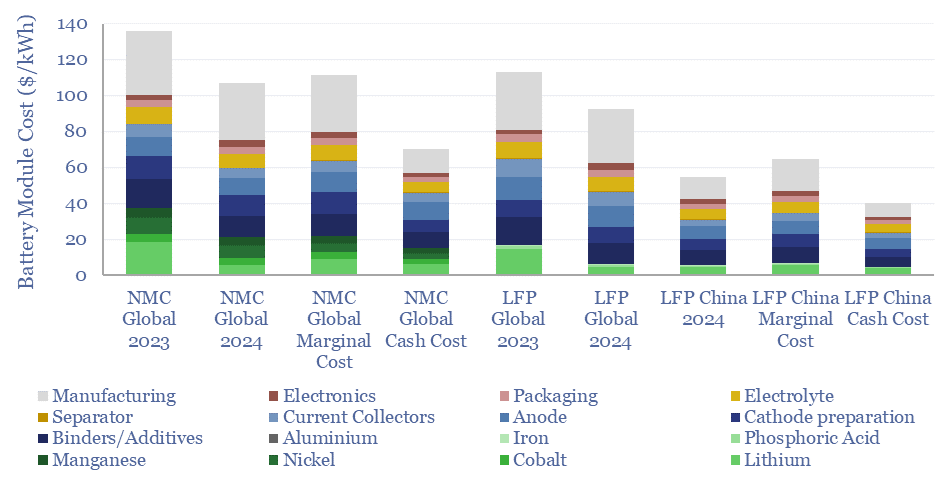
Lithium ion battery costs: materials and manufacturing?
Download
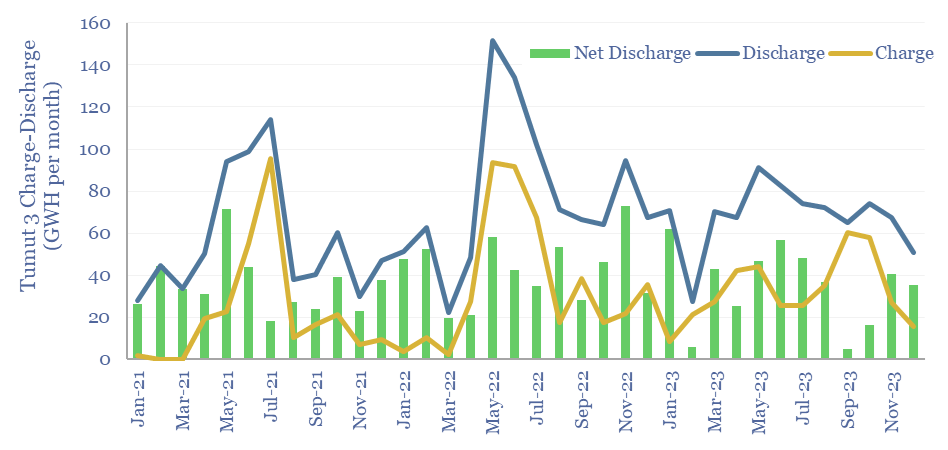
Pumped hydro: generation profile?
Download
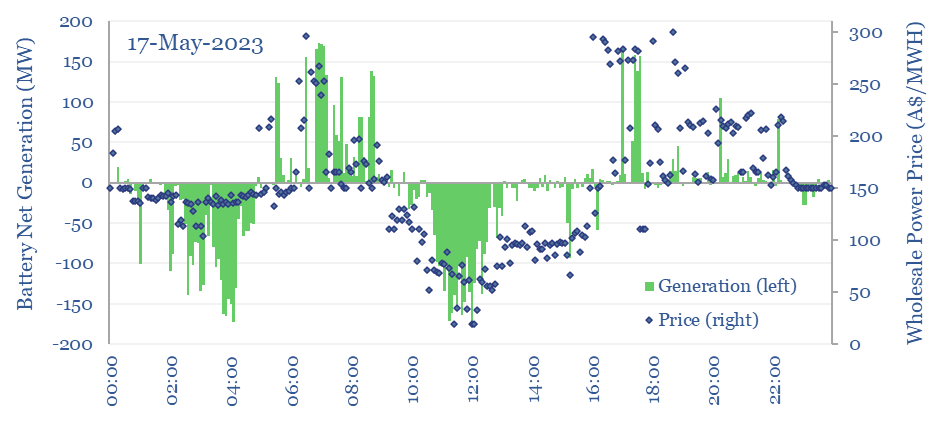
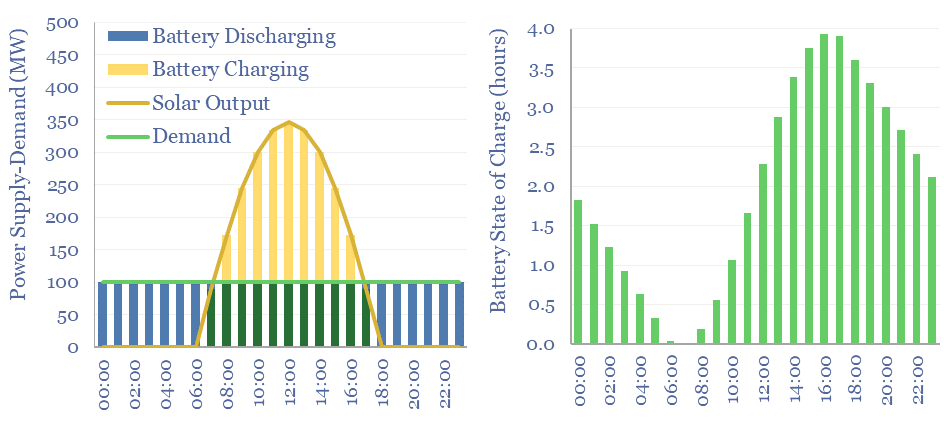
Grid-scale battery operation: a case study?
Download
Compressed air energy storage: costs and economics?
Download
Electrochemistry: redox potential?
Download
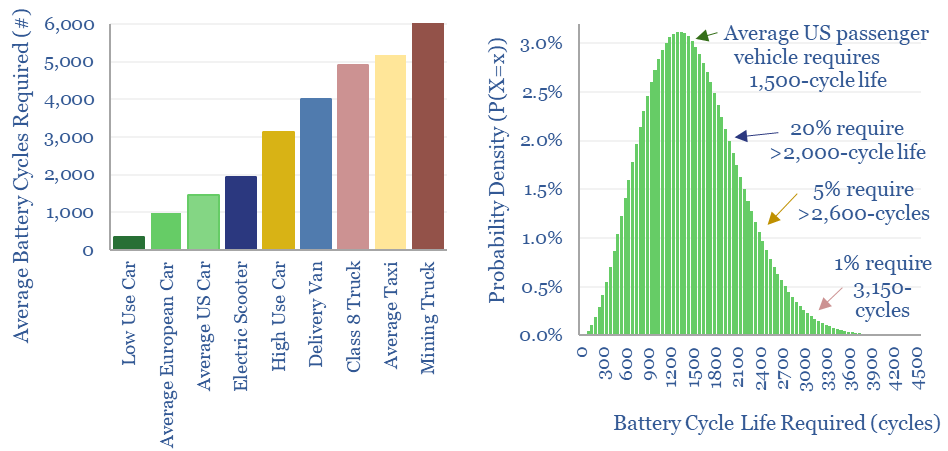
Electric vehicle: battery life?
Download
Thermal energy storage: heat of the moment?
Download
Renewable grids: solar, wind and grid-scale battery sizing?
Download
Thermal energy storage: leading companies?
Download
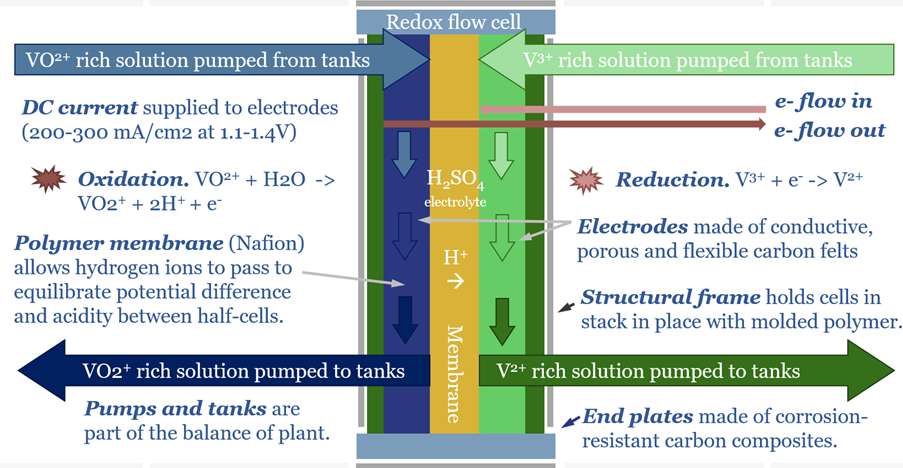
Redox flow batteries: for the duration?
Download
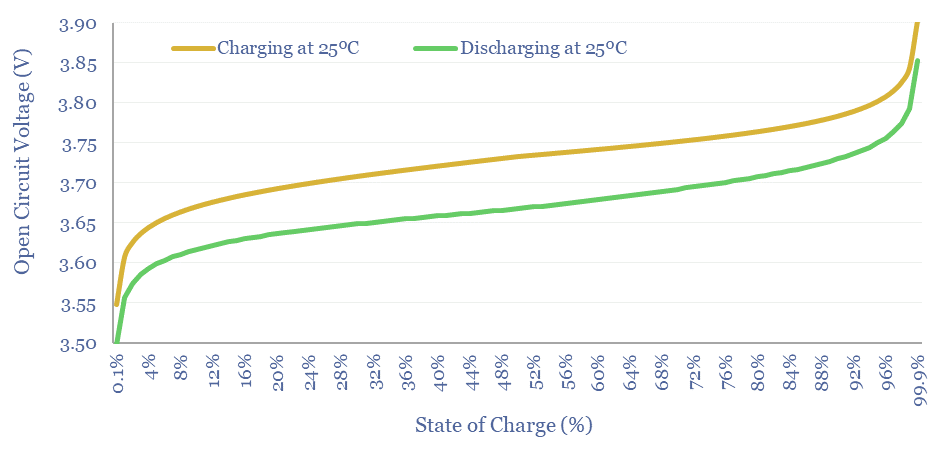
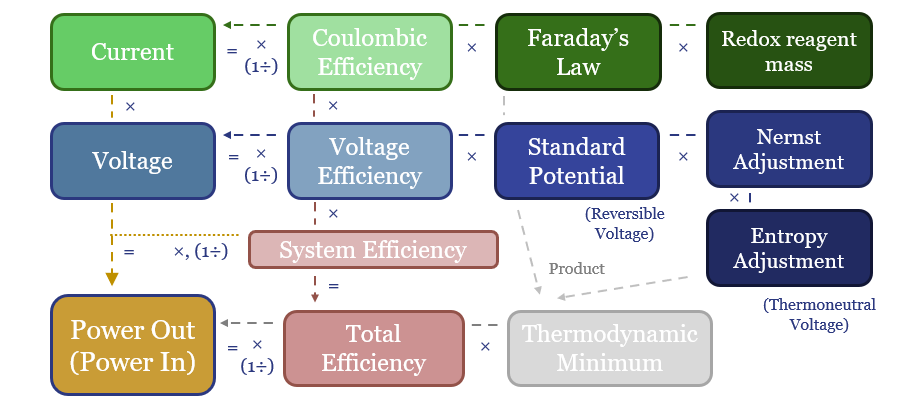
Electrochemistry: battery voltage and the Nernst Equation?
Download
Redox flow batteries: costs and capex?
Download
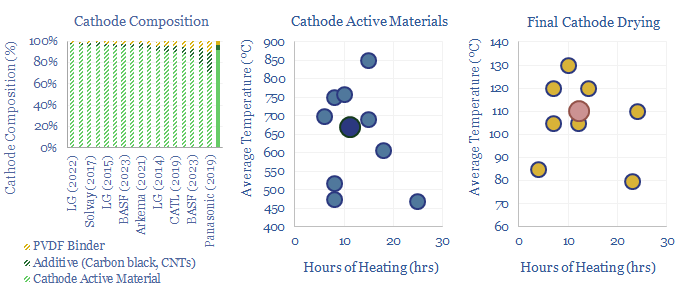
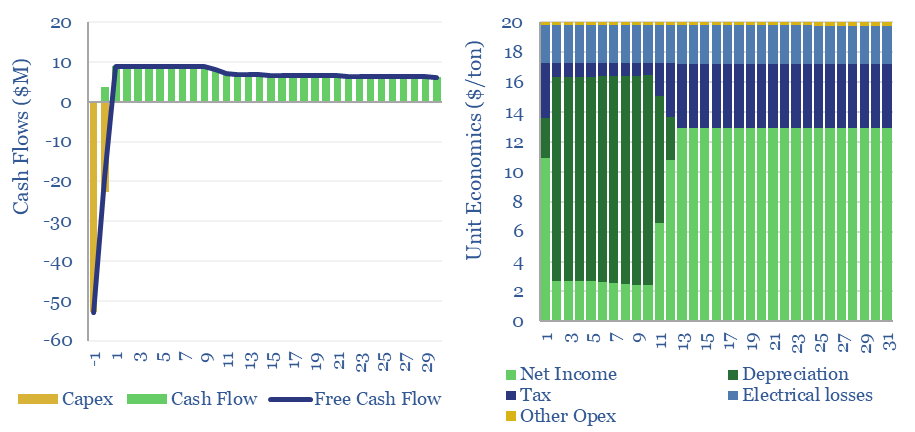
Battery cathode active materials and manufacturing?
Download
Solvay: lithium ion battery binders and additives?
Download
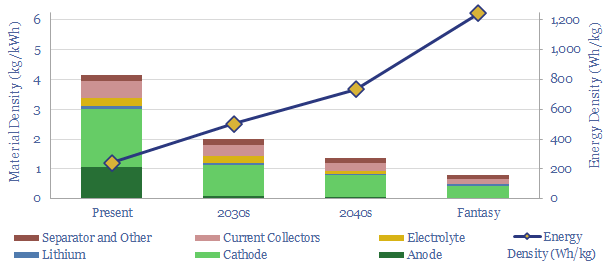
Lithium ion batteries: energy density?
Download
Electric vehicles: breaking the ICE?
Download
Power Grids and Power Electronics Research
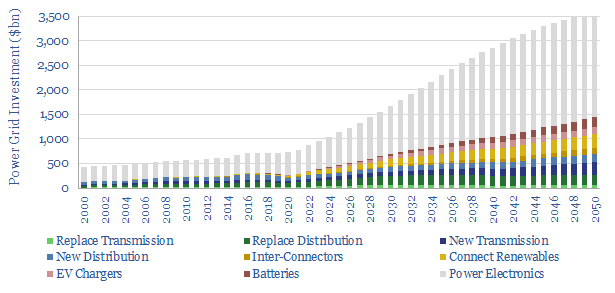
Power grids: opportunities in the energy transition?
Download
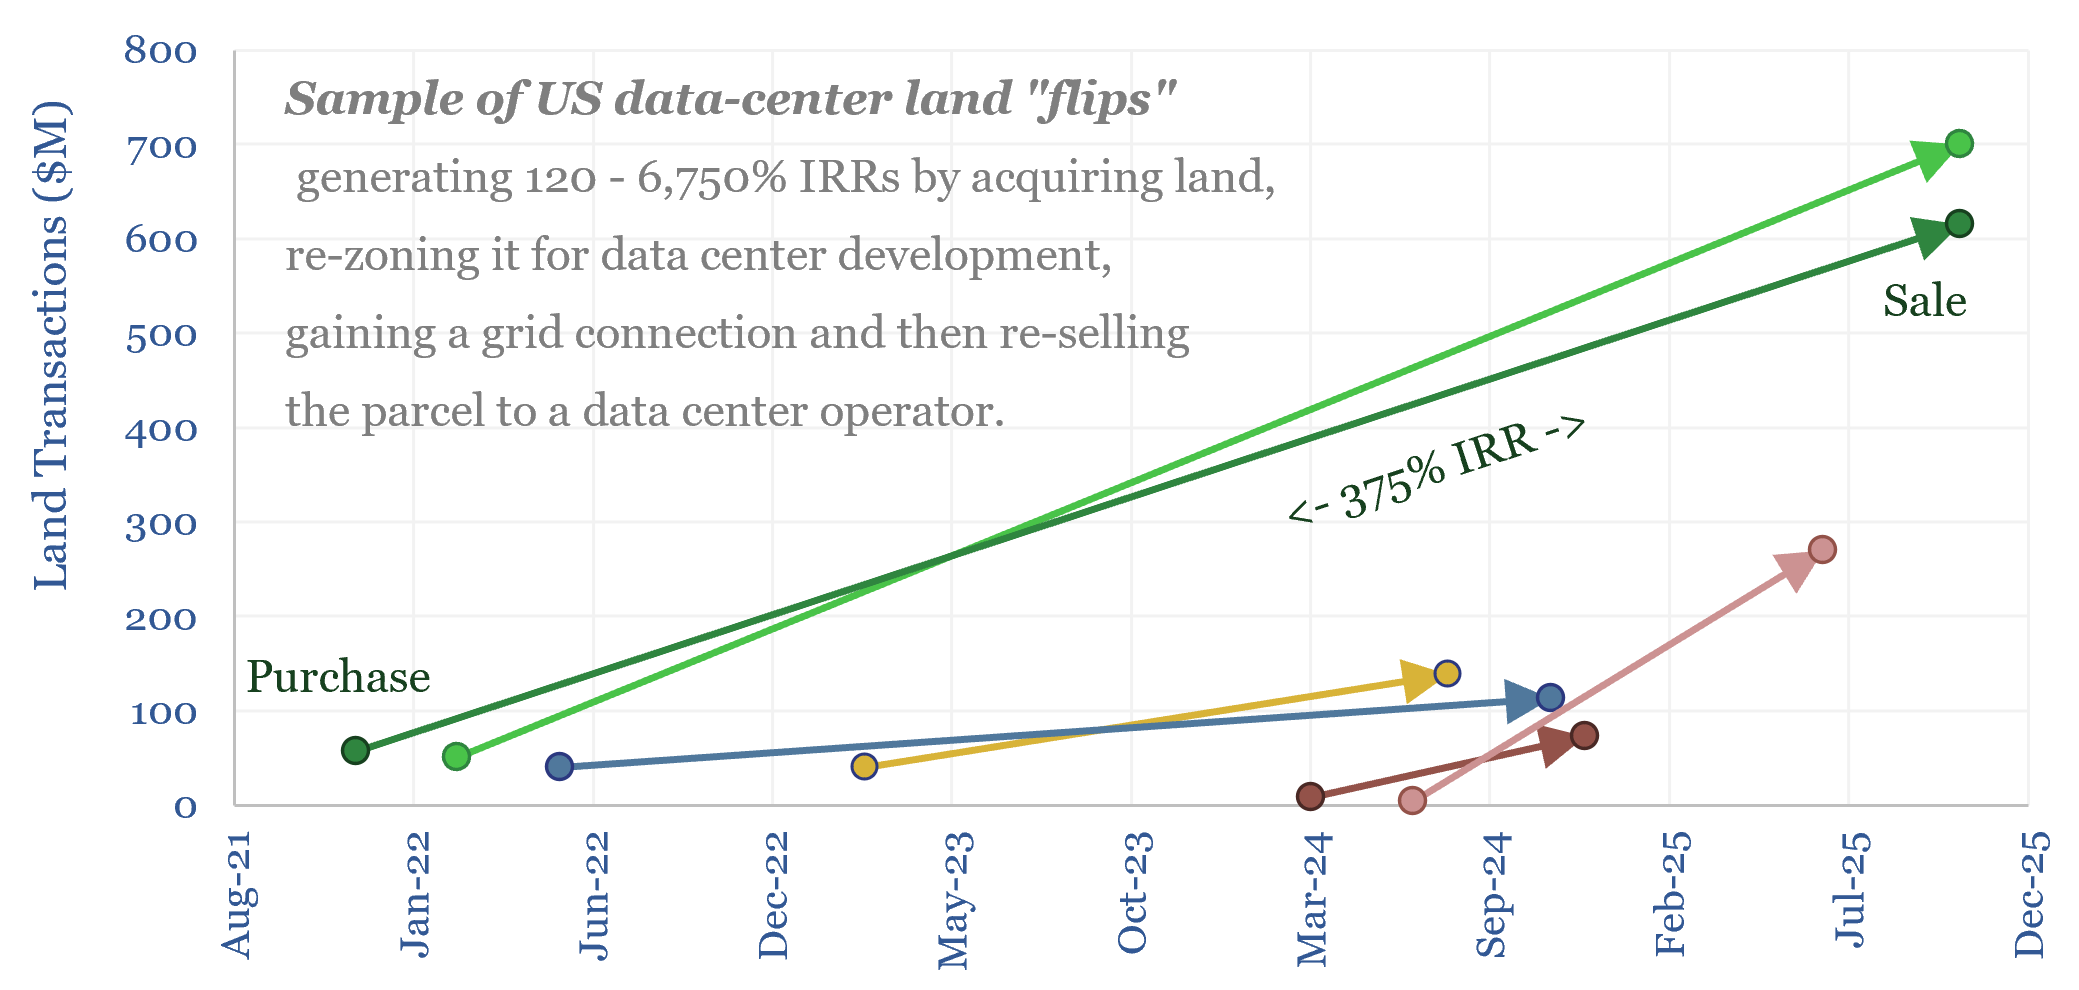
Electrical service agreements: how real are those data centers?
Download

Heat potential: what if AI can load-shift hot water tanks?
Download

Residential heating energy from first principles?
Download
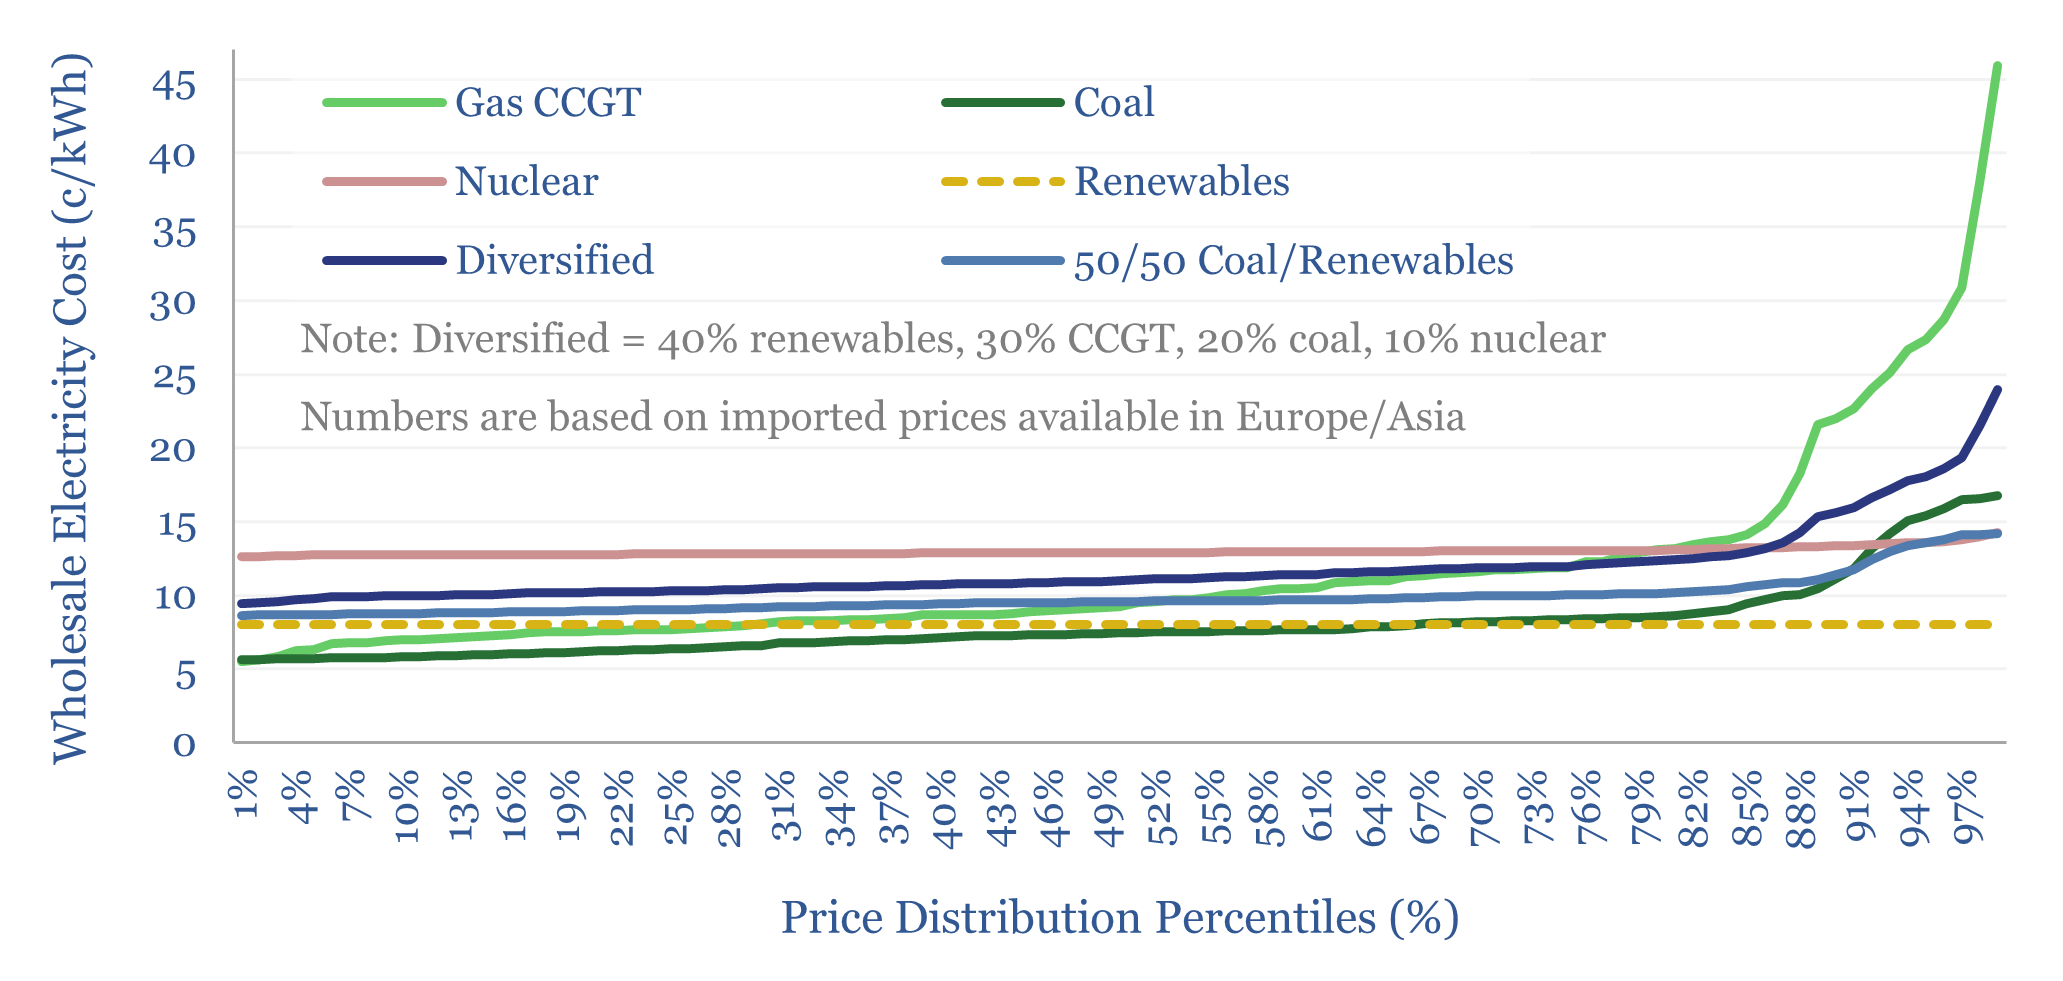
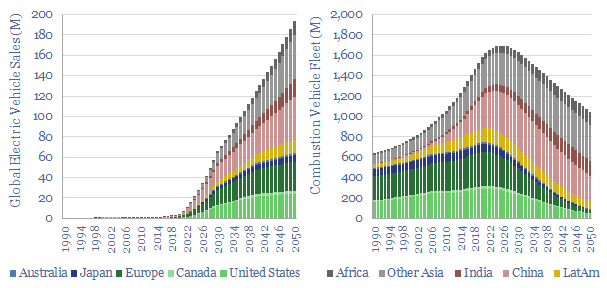
Global power: what grid mix is most stable?
Download

Global electricity: by source, by use, by region?
Download
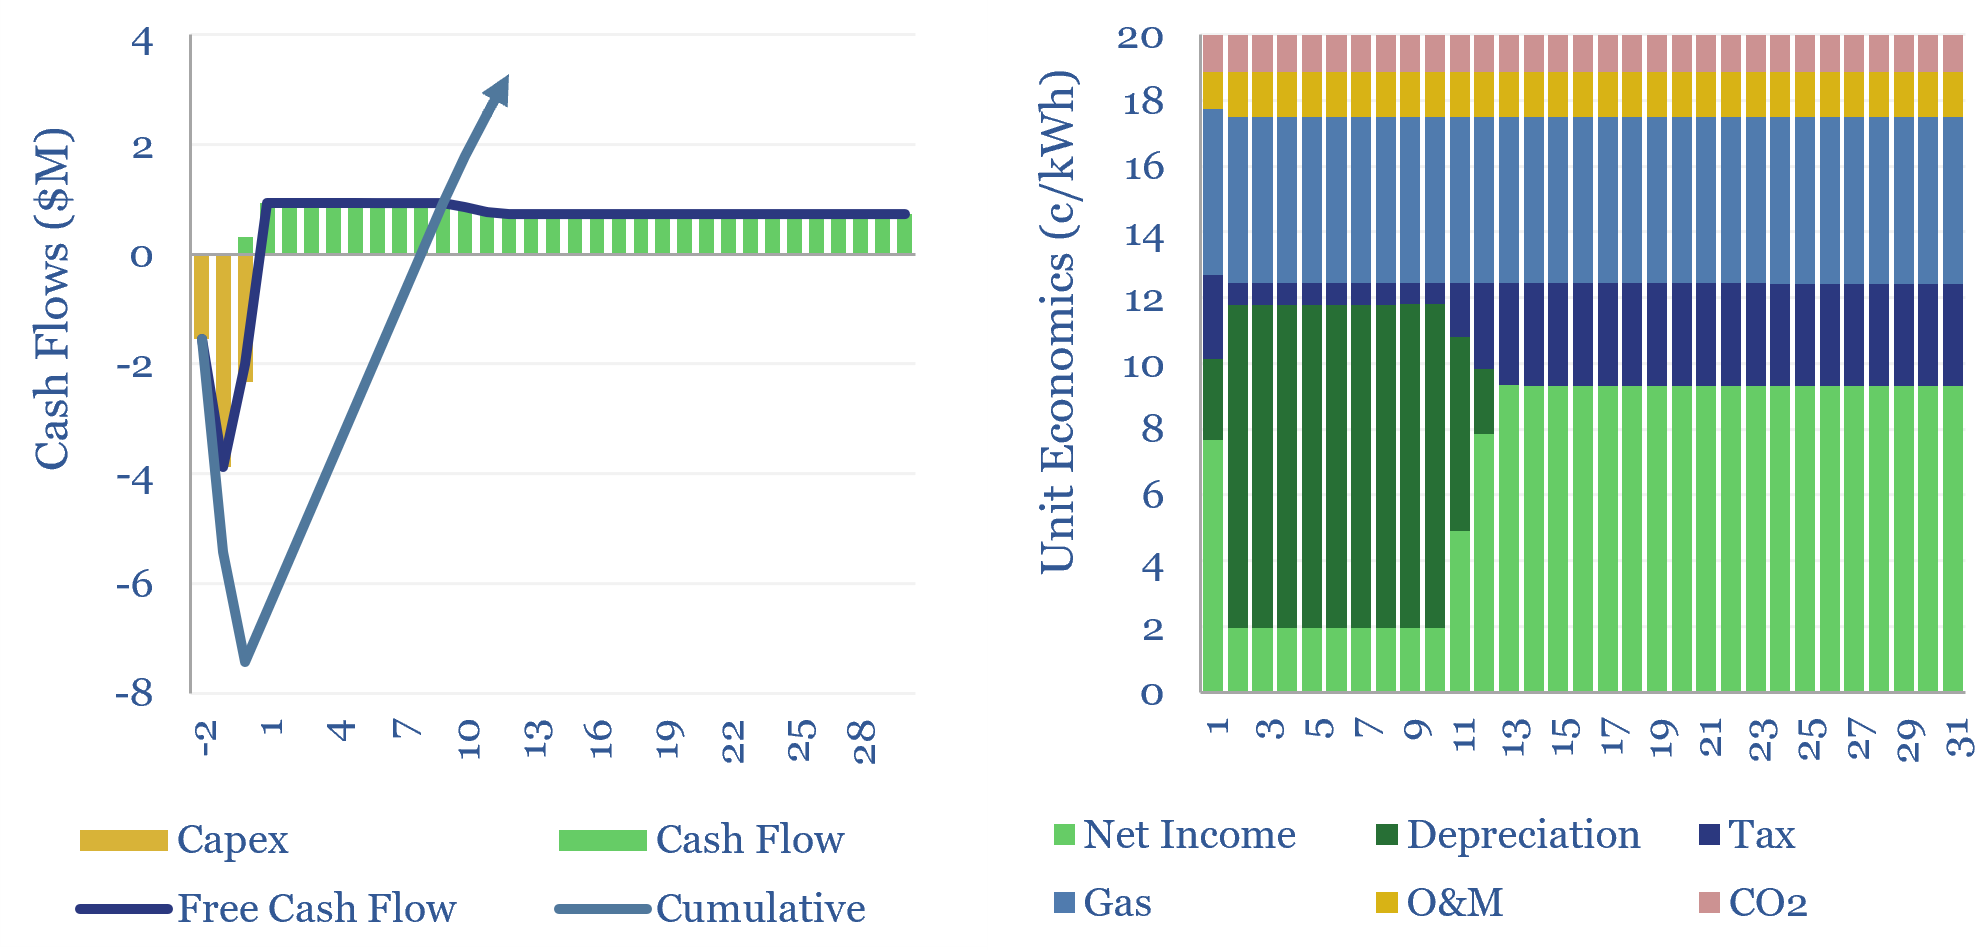
Renewables+gas LCOEs versus standalone gas turbines?
Download
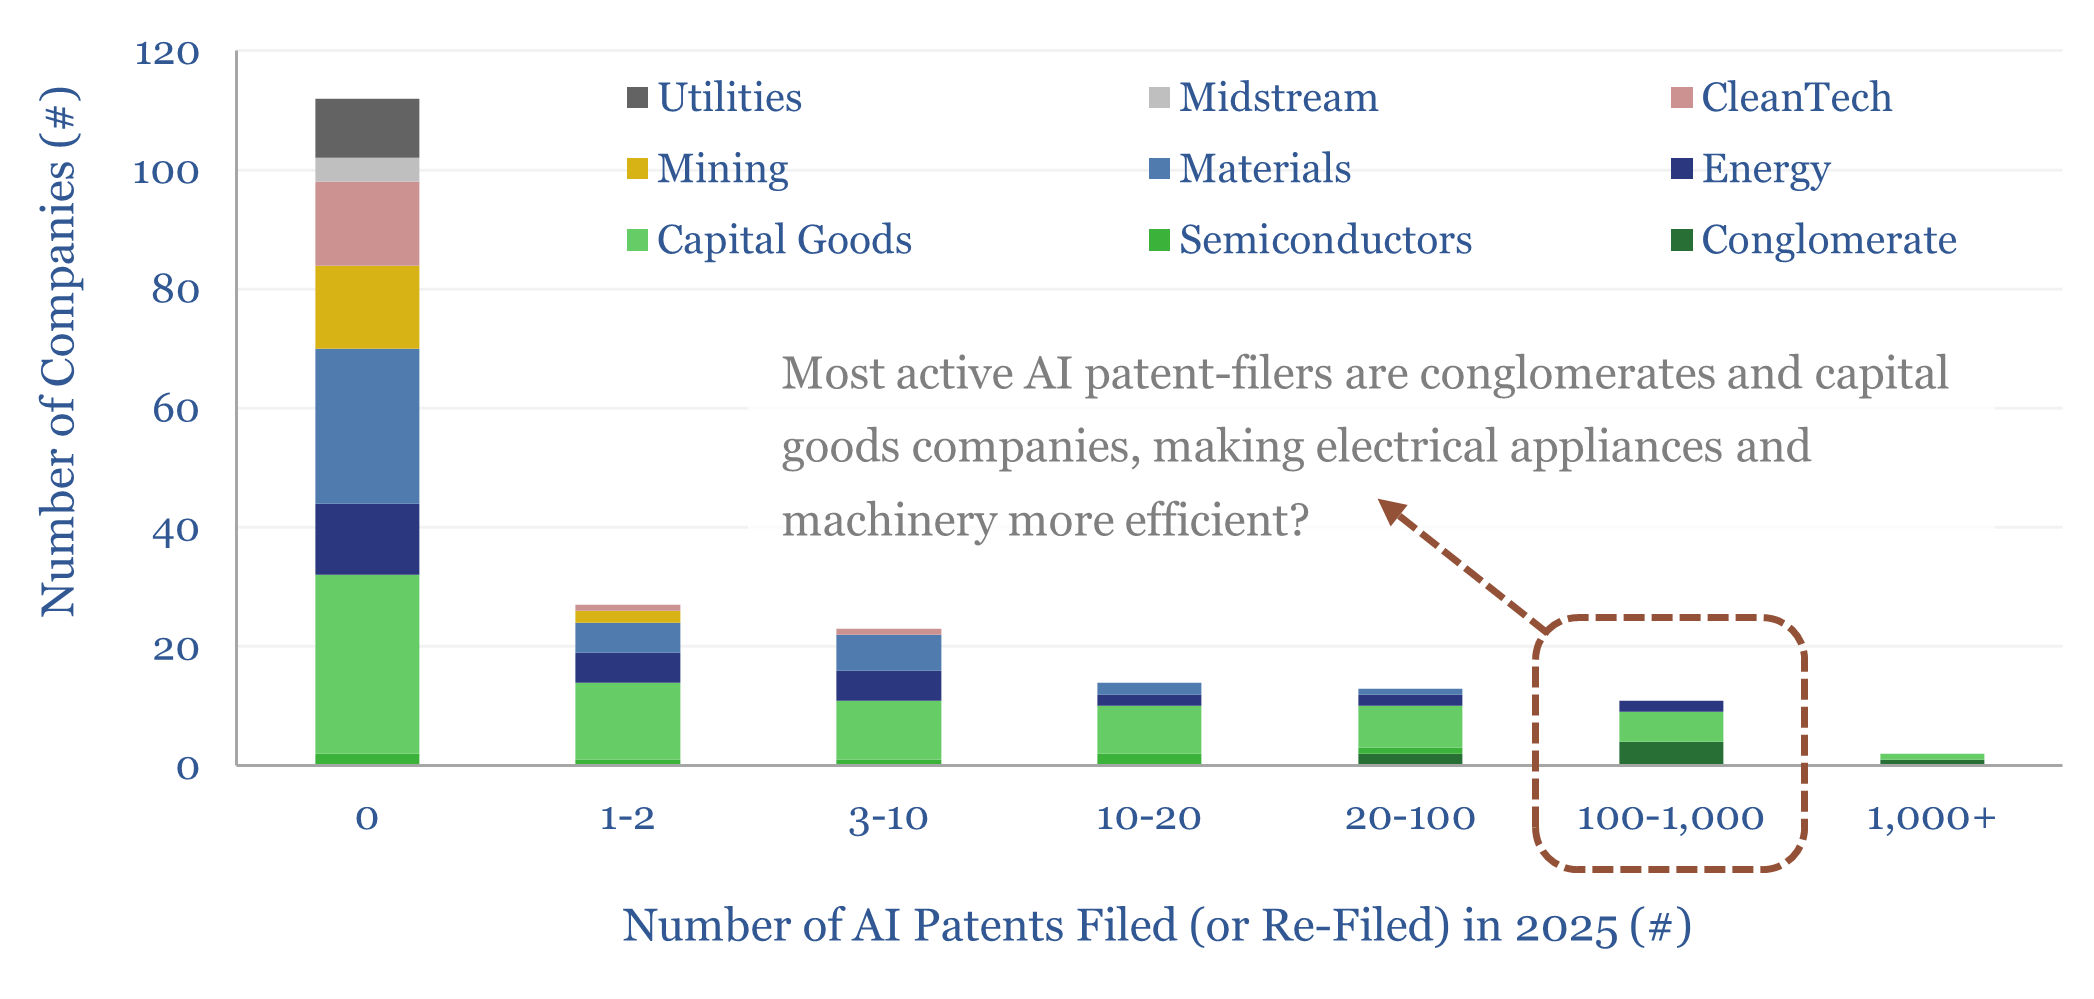
Electrical appliances: will AI accelerate efficiency gains?
Download

Wind and solar: curtailments over time?
Download
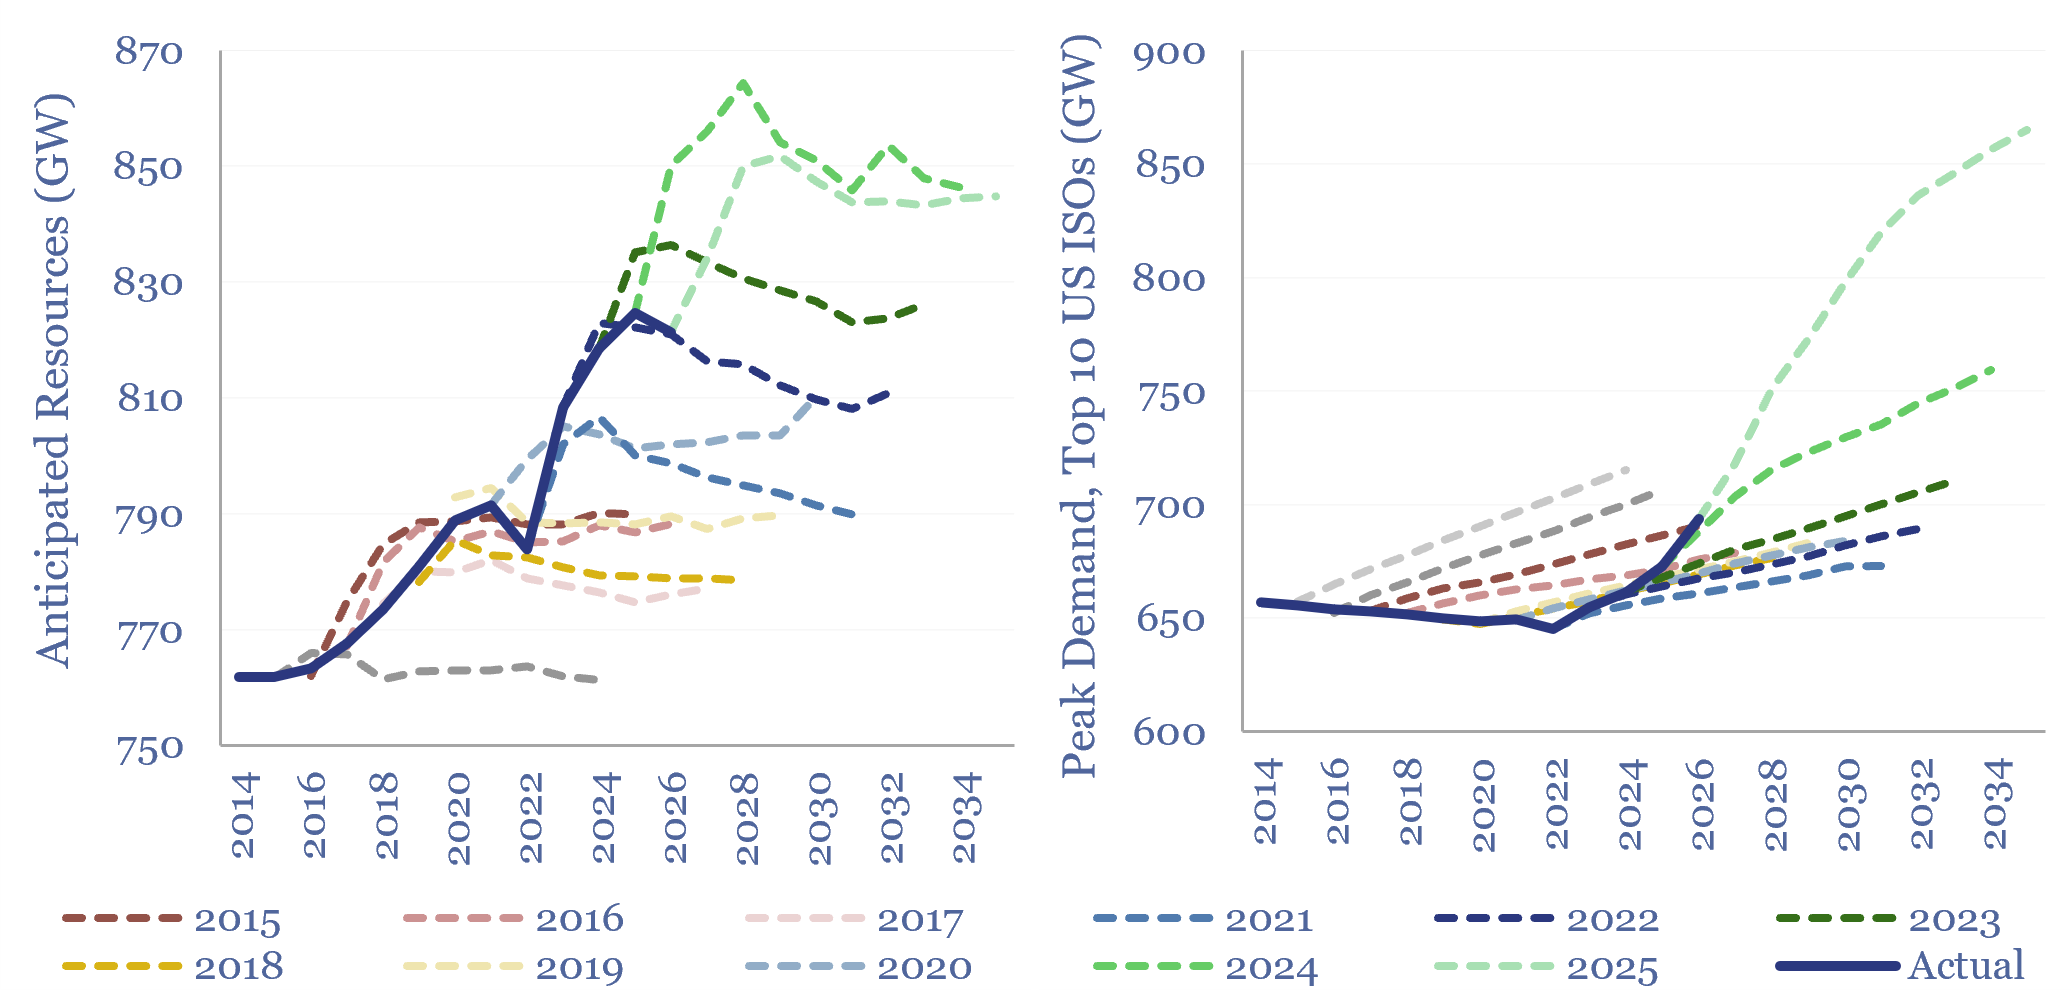
Reserve margins: by ISO and over time?
Download
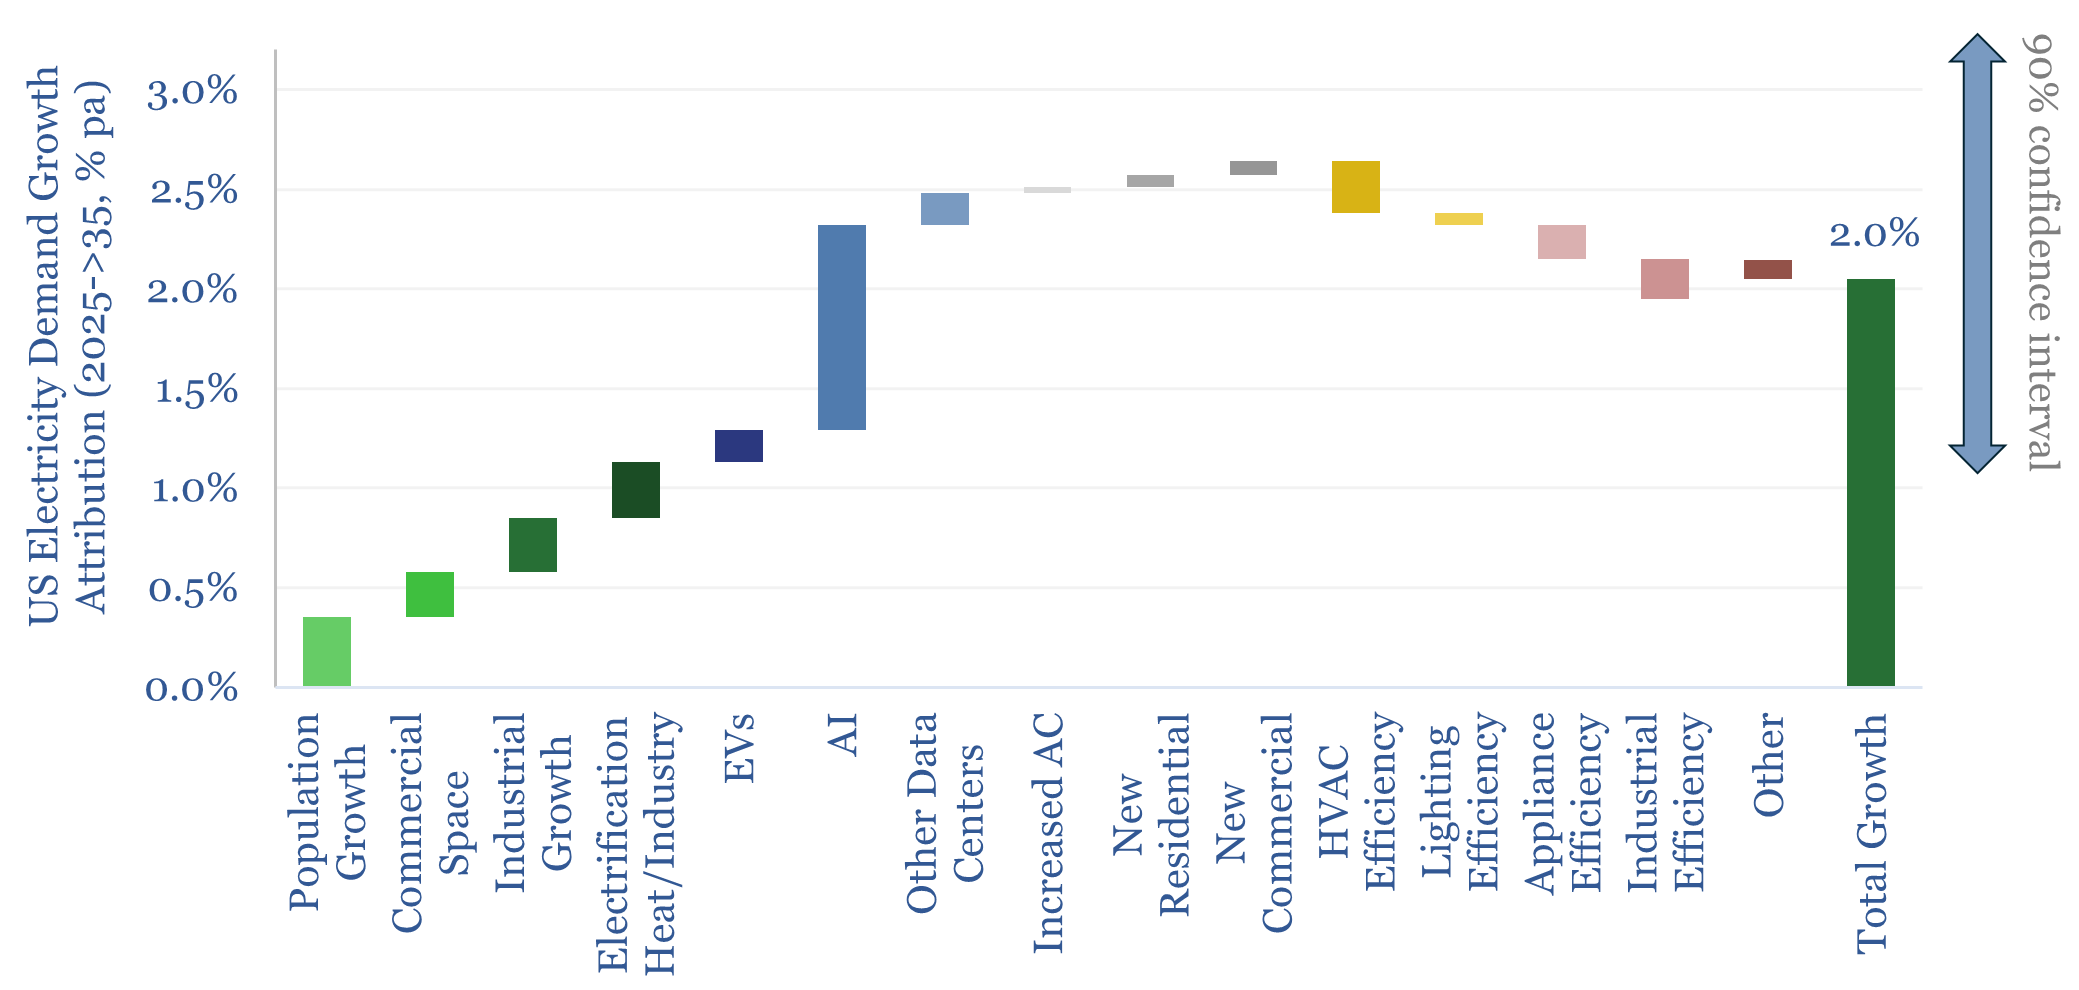
US electricity demand growth: anywhere from 1-3%?
Download
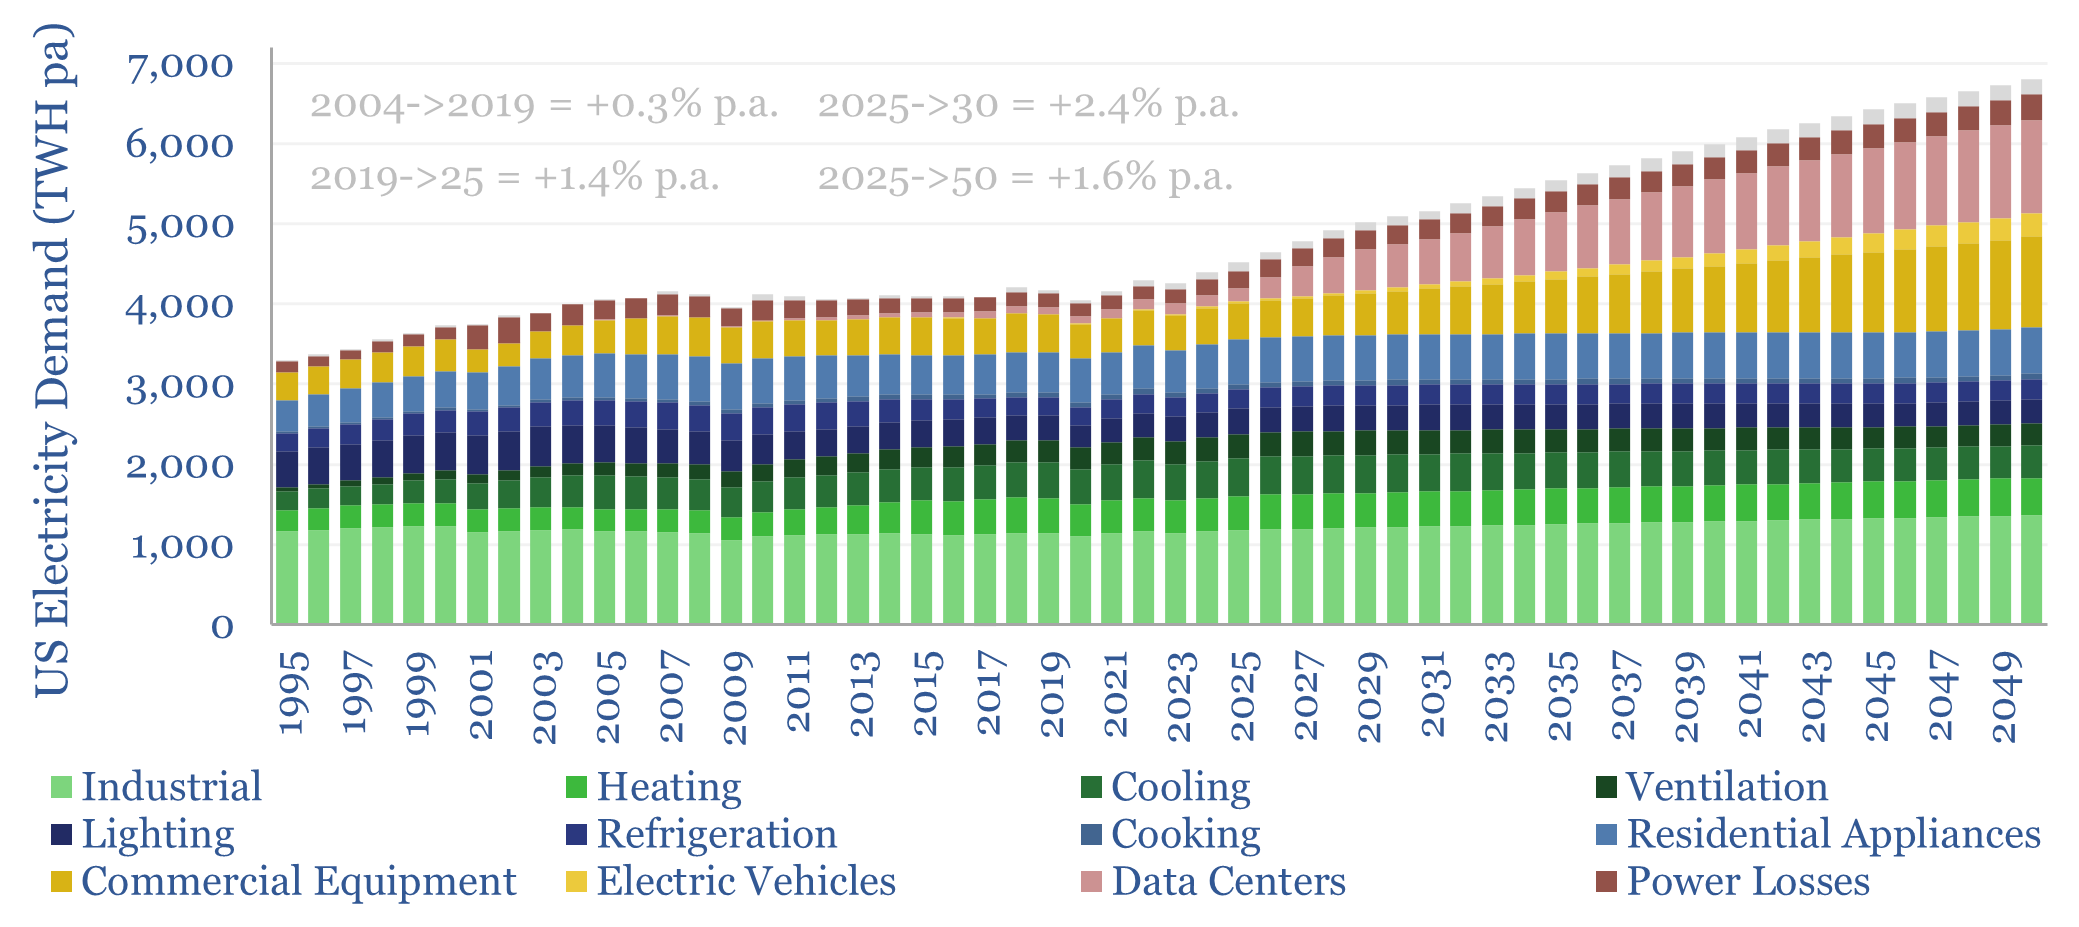
US electricity demand: by sector, by use, over time?
Download
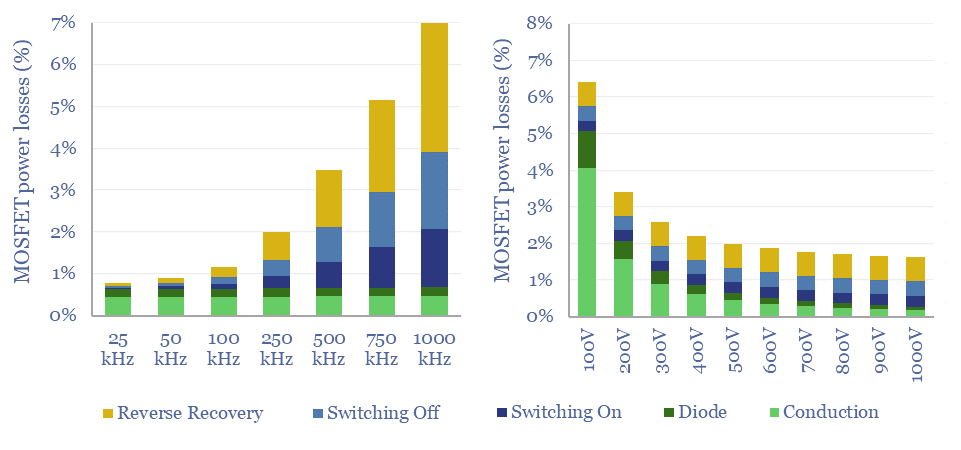
MOSFETs: energy use and power loss calculator?
Download

Duck curves: US power price duckiness over time?
Download
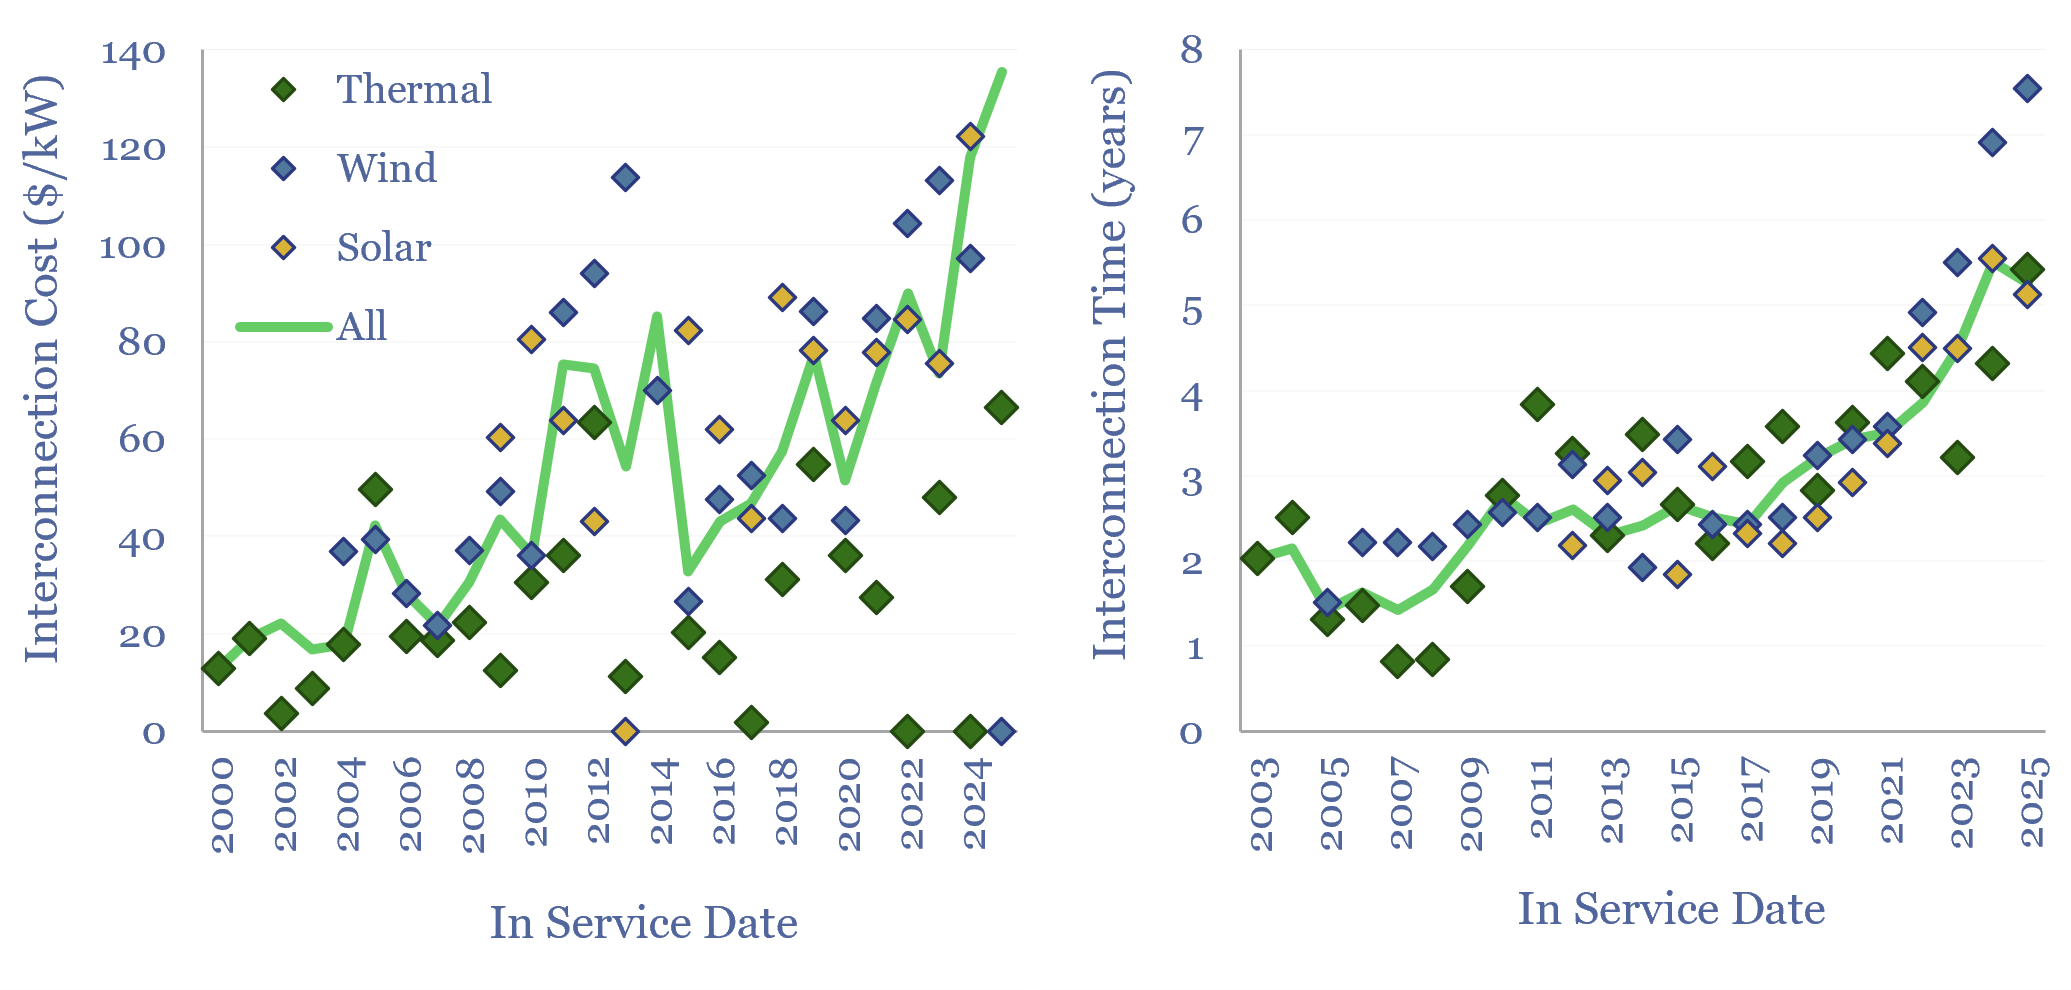
Grid connection costs: wind, solar, power, data centers?
Download
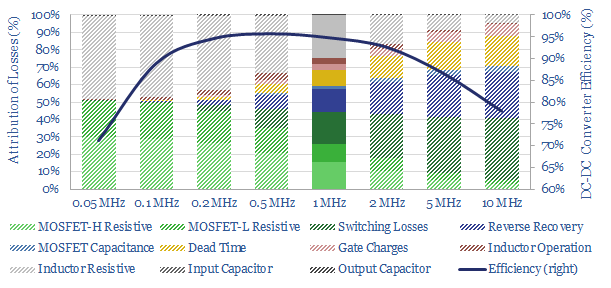
DC-DC power converters: efficiency calculations?
Download
Leading companies in transformer monitoring?
Download
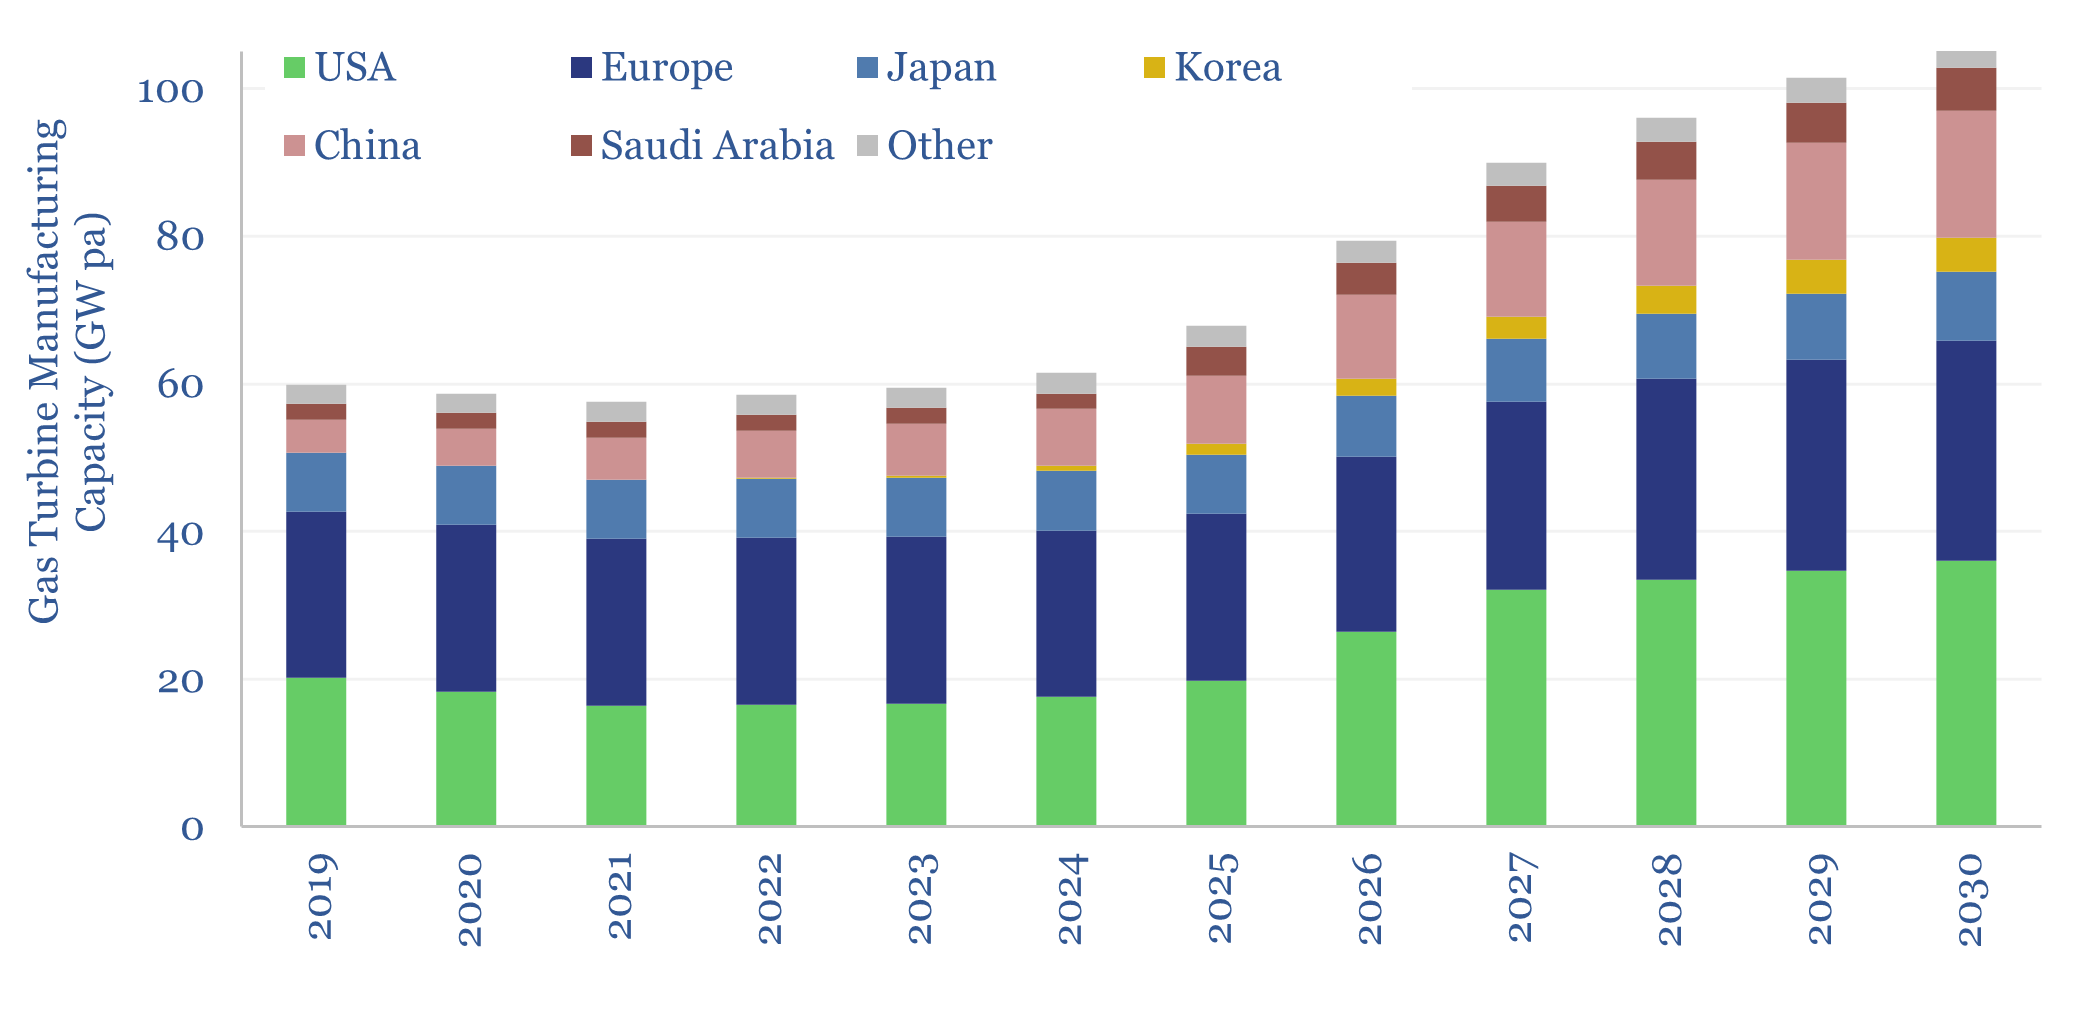
Gas turbine manufacturing: eliminative materialism?
Download
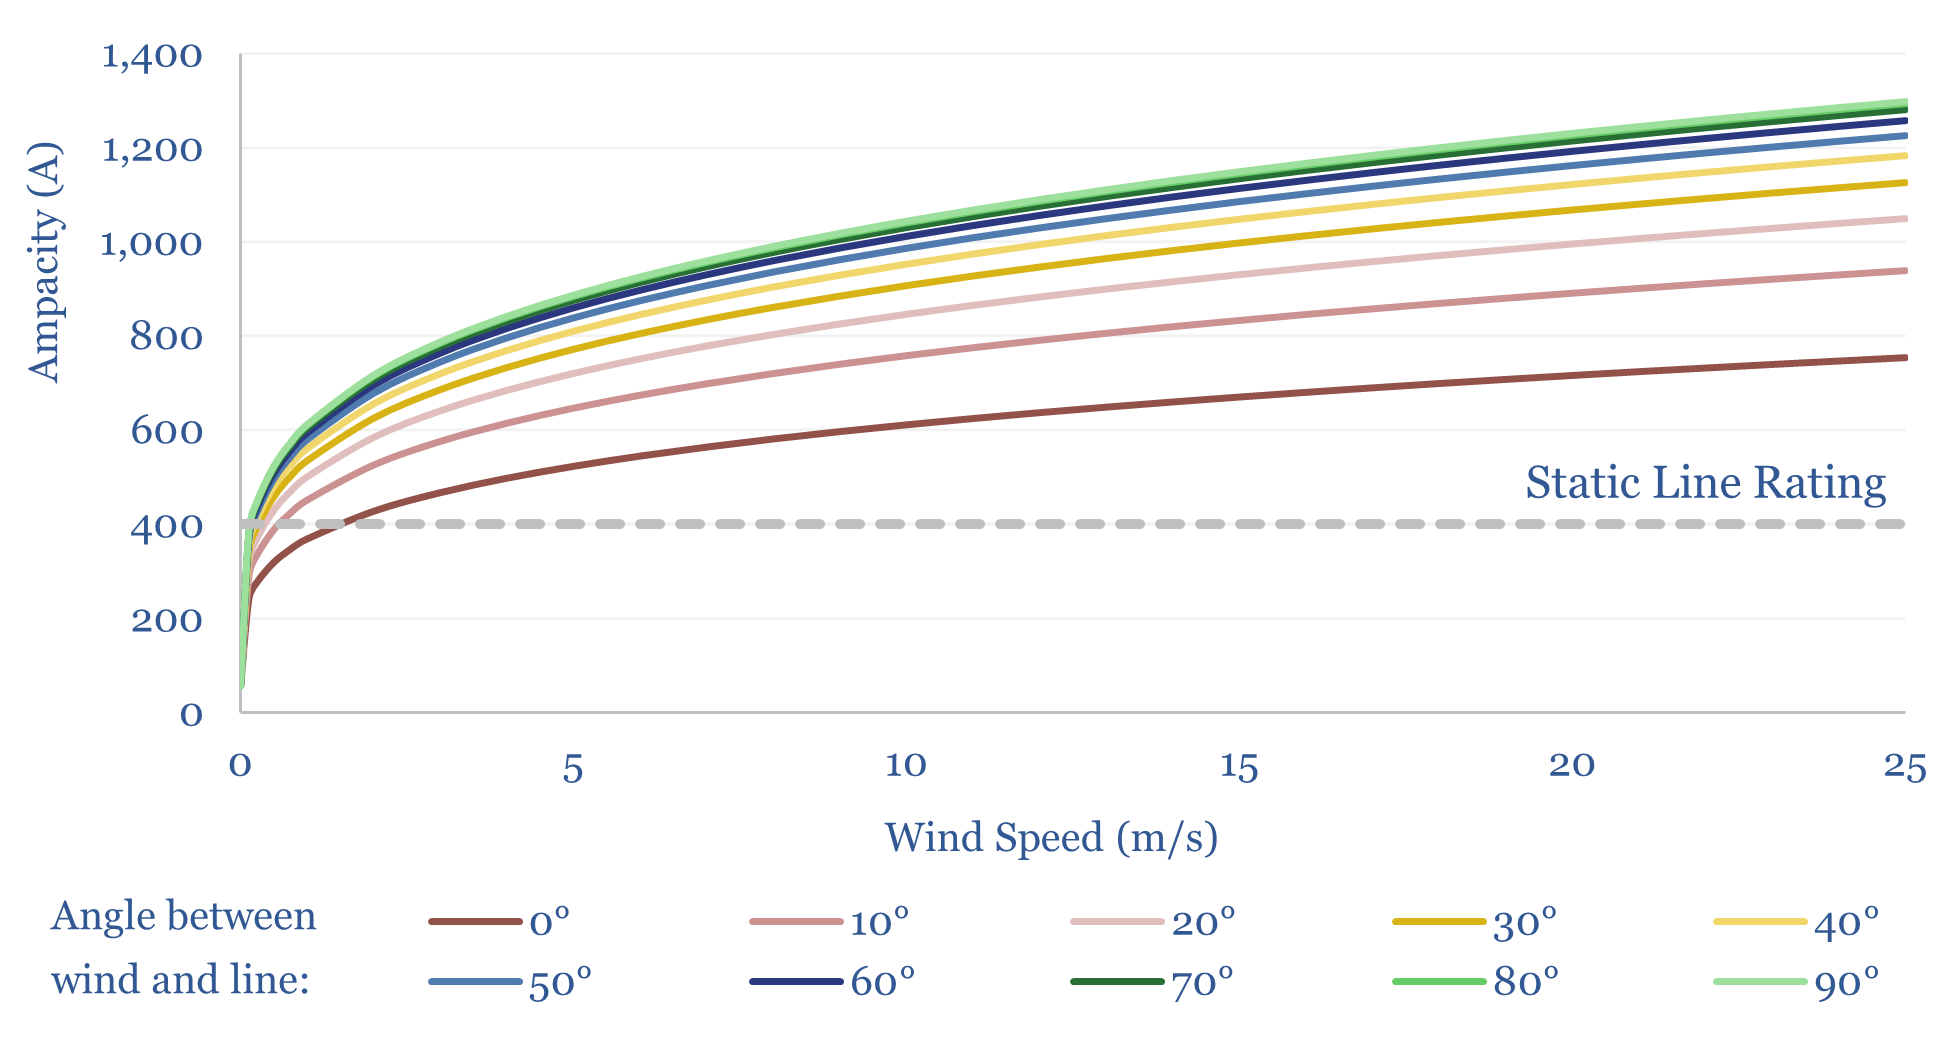
Dynamic line ratings: can AI debottleneck the grid?
Download
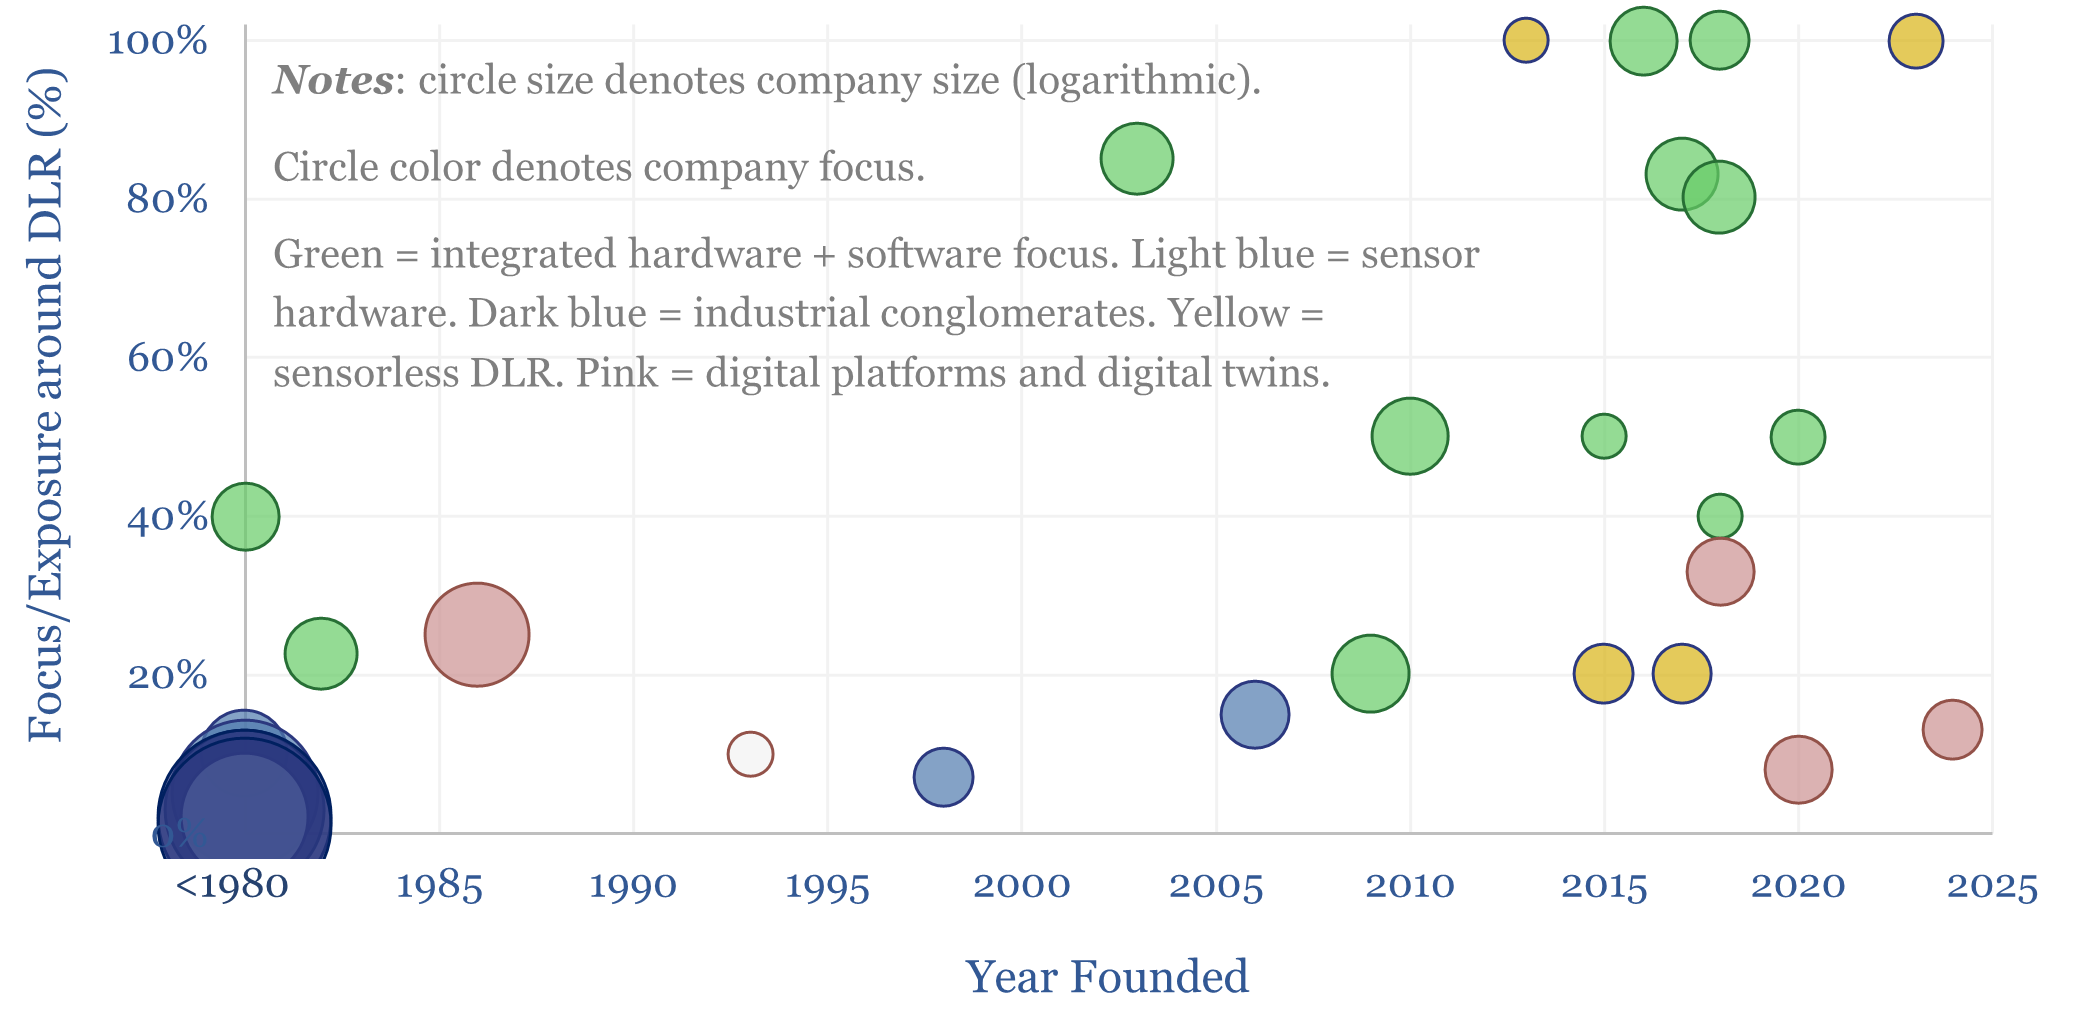
Dynamic line ratings: companies and case studies?
Download
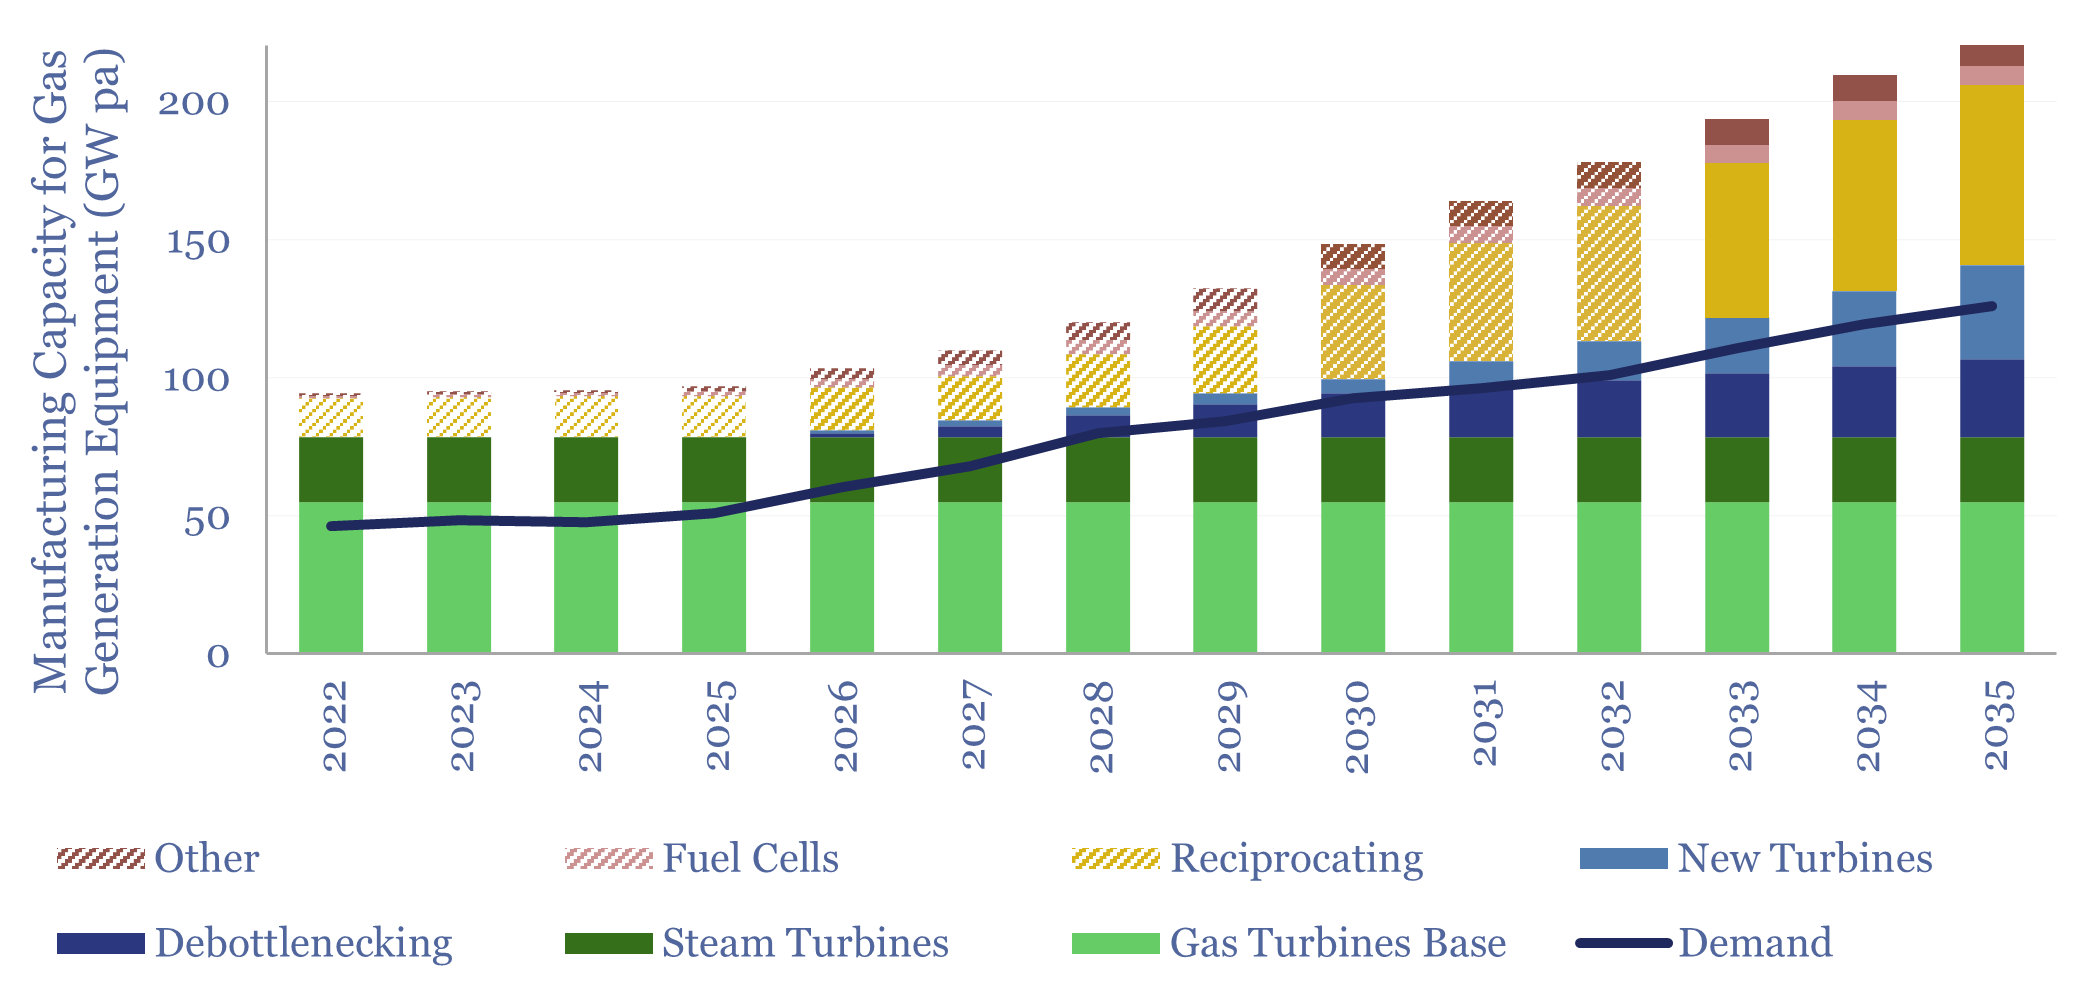
Gas generation: timing the cycle?
Download
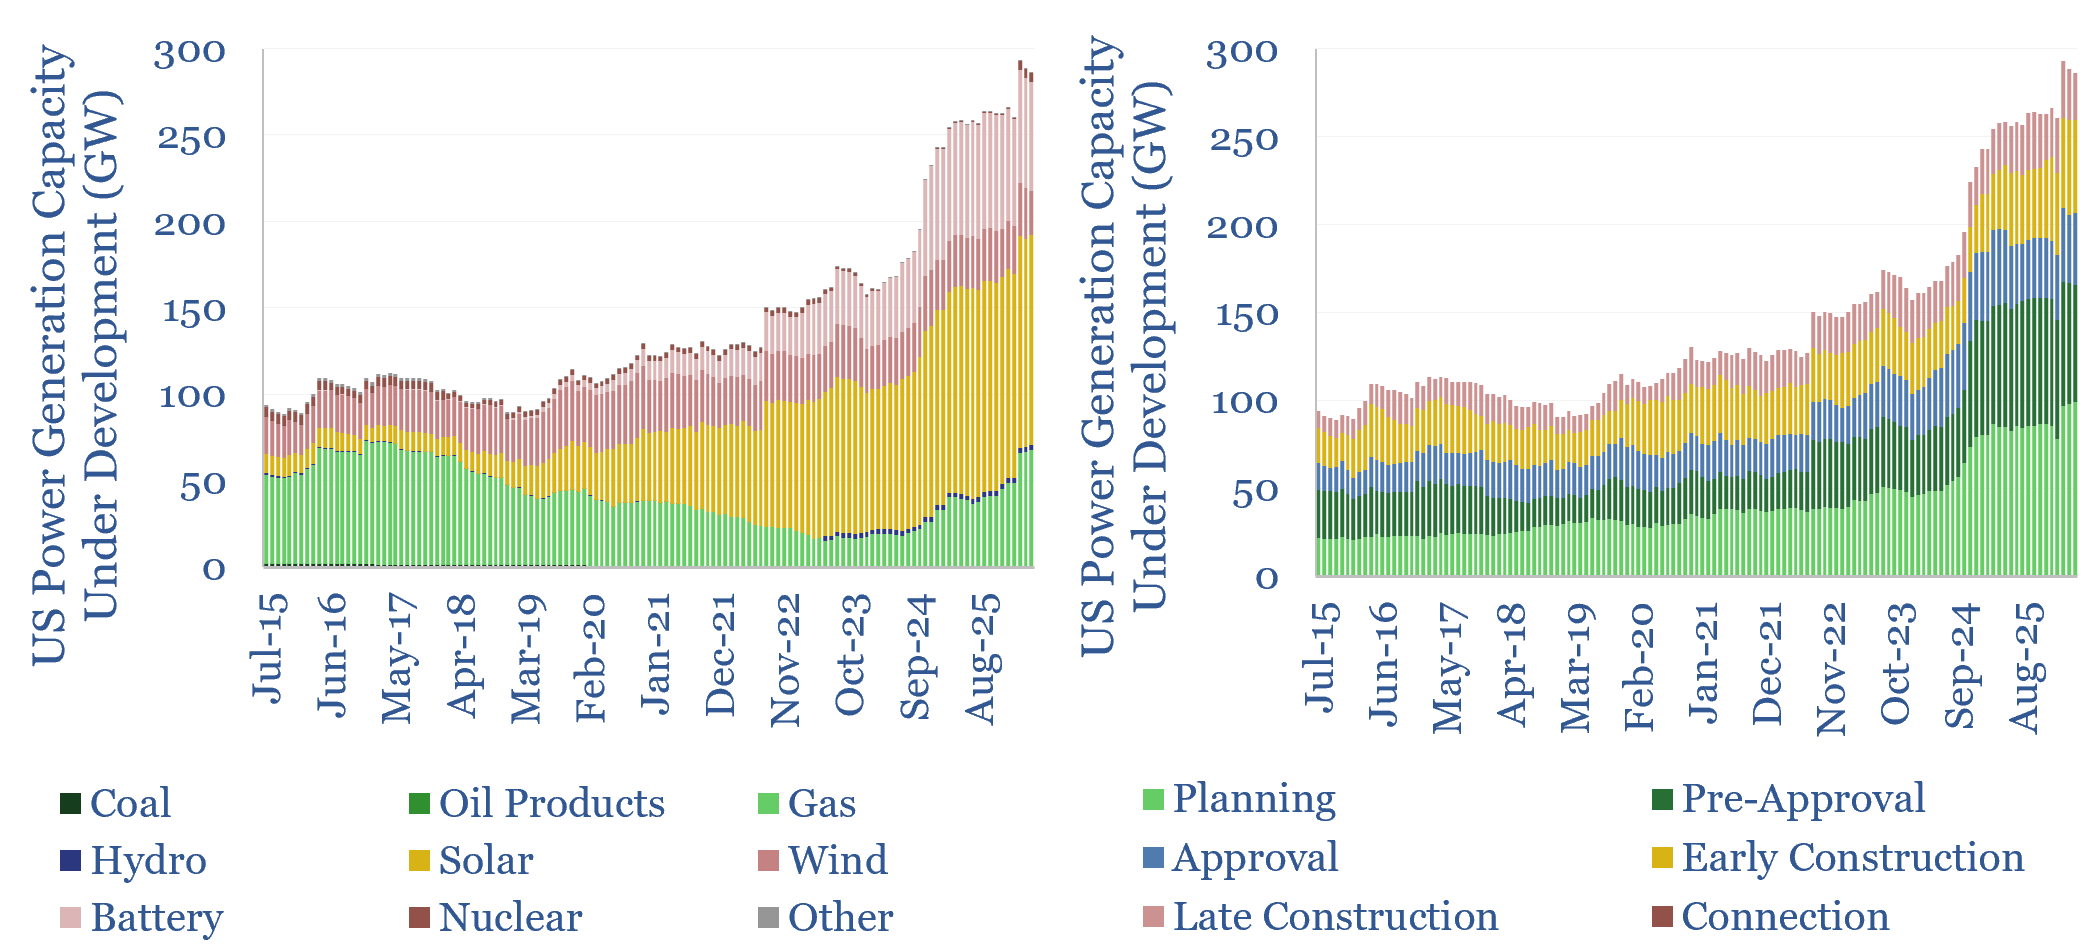
US power generation under development over time?
Download

AI power delivery: hit by a bus?
Download
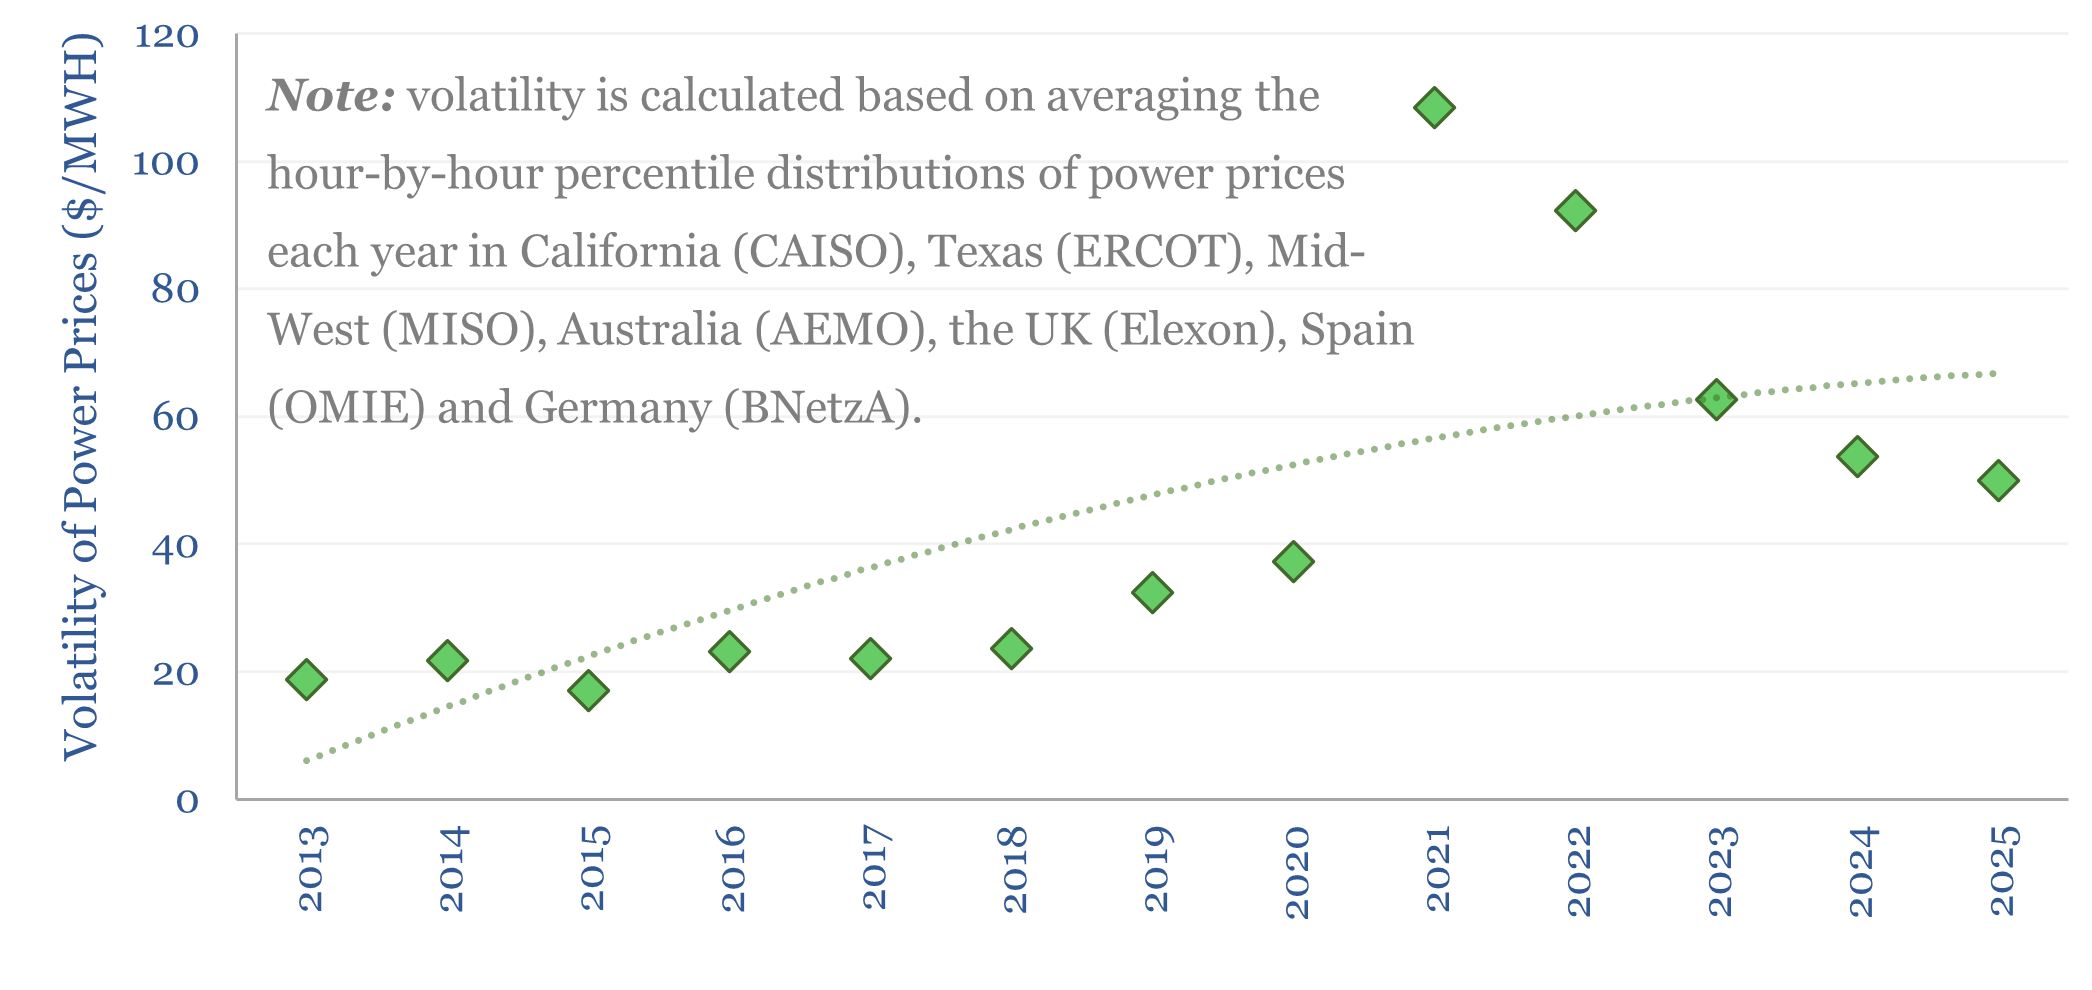
Global power price volatility tracker?
Download
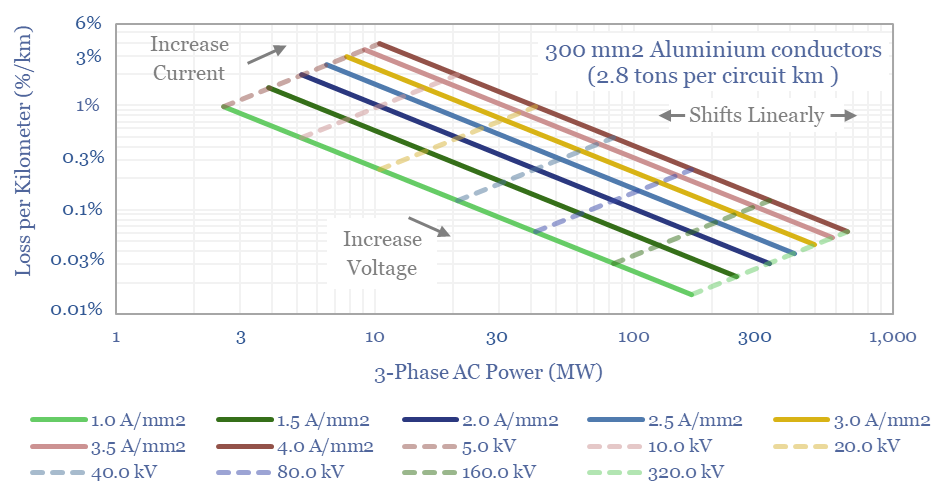
Power cables: carrying capacity and loss rates?
Download

Power cuts: how frequent are grid disruptions?
Download

Power markets: classical economics?
Download

Electricity pricing: time-of-use tariffs by region?
Download
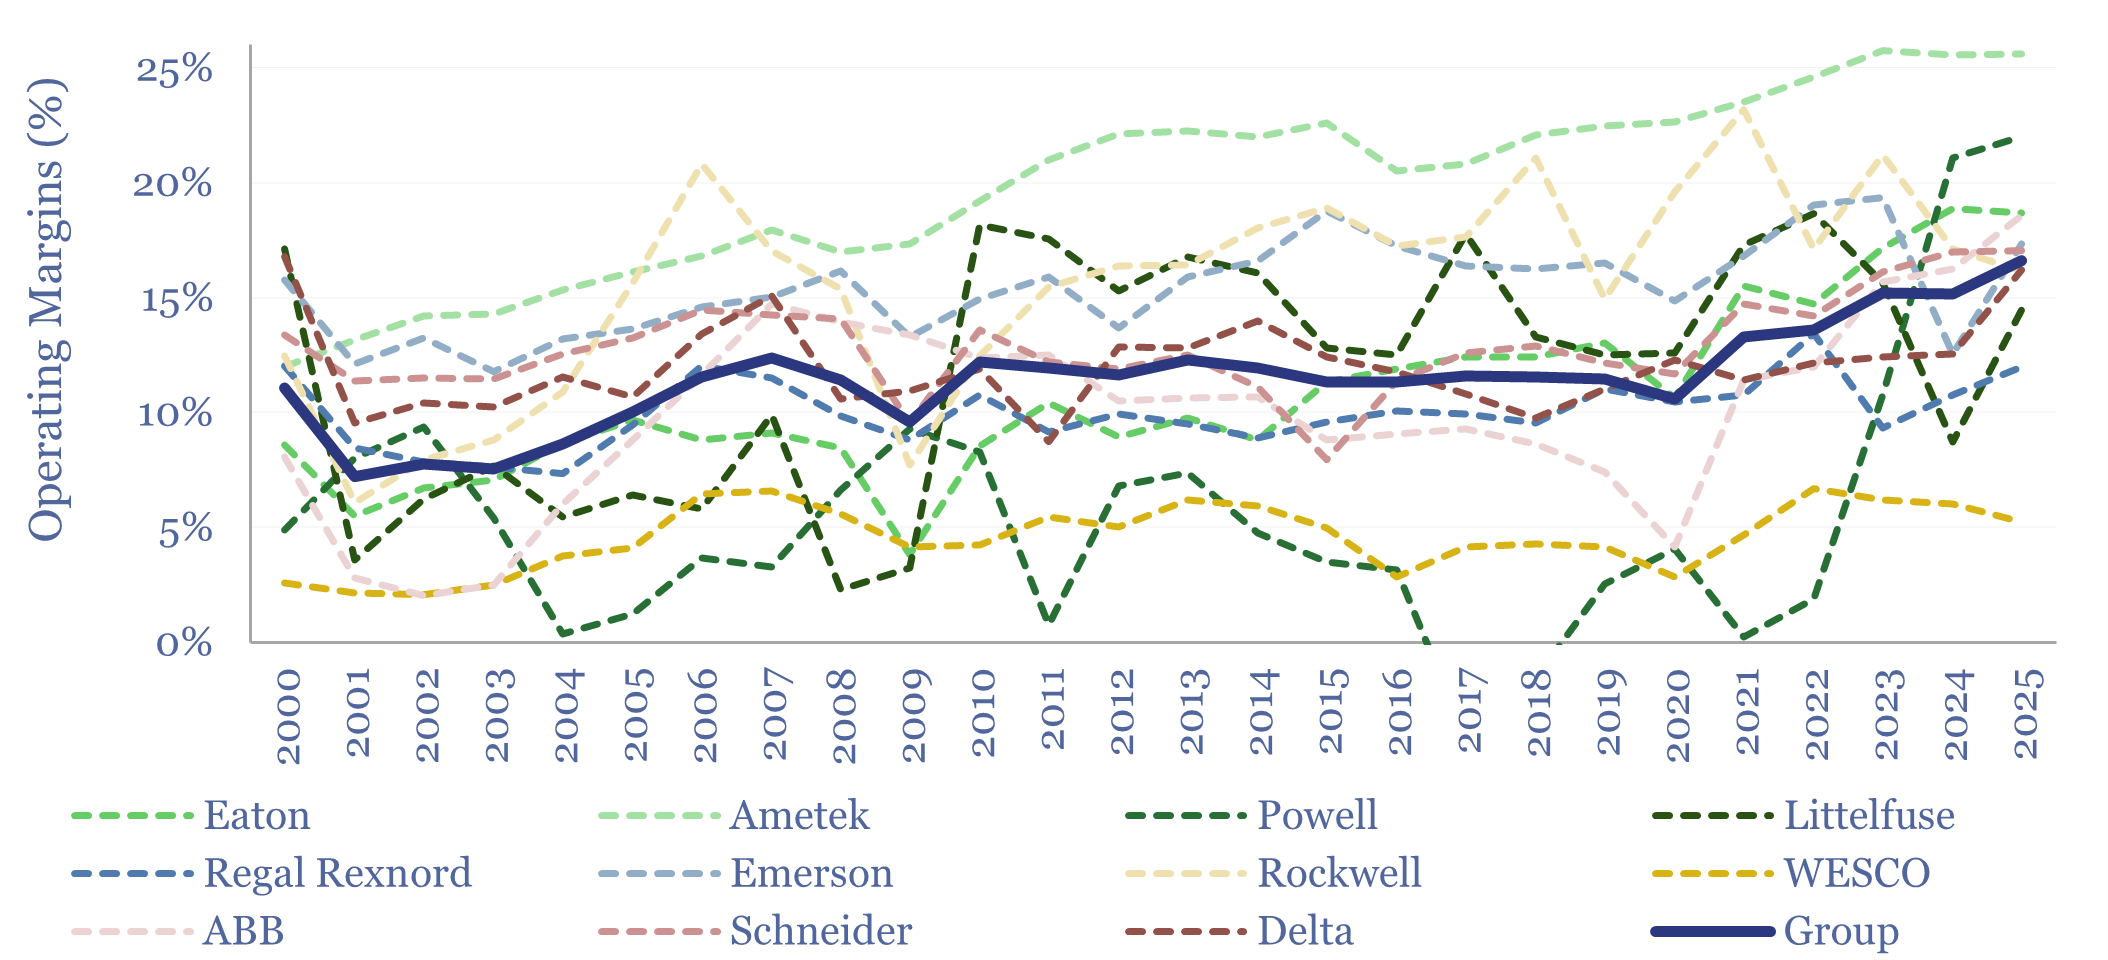
Power electronic capital goods: margins over time?
Download
Industrial heat pump costs: economic model?
Download
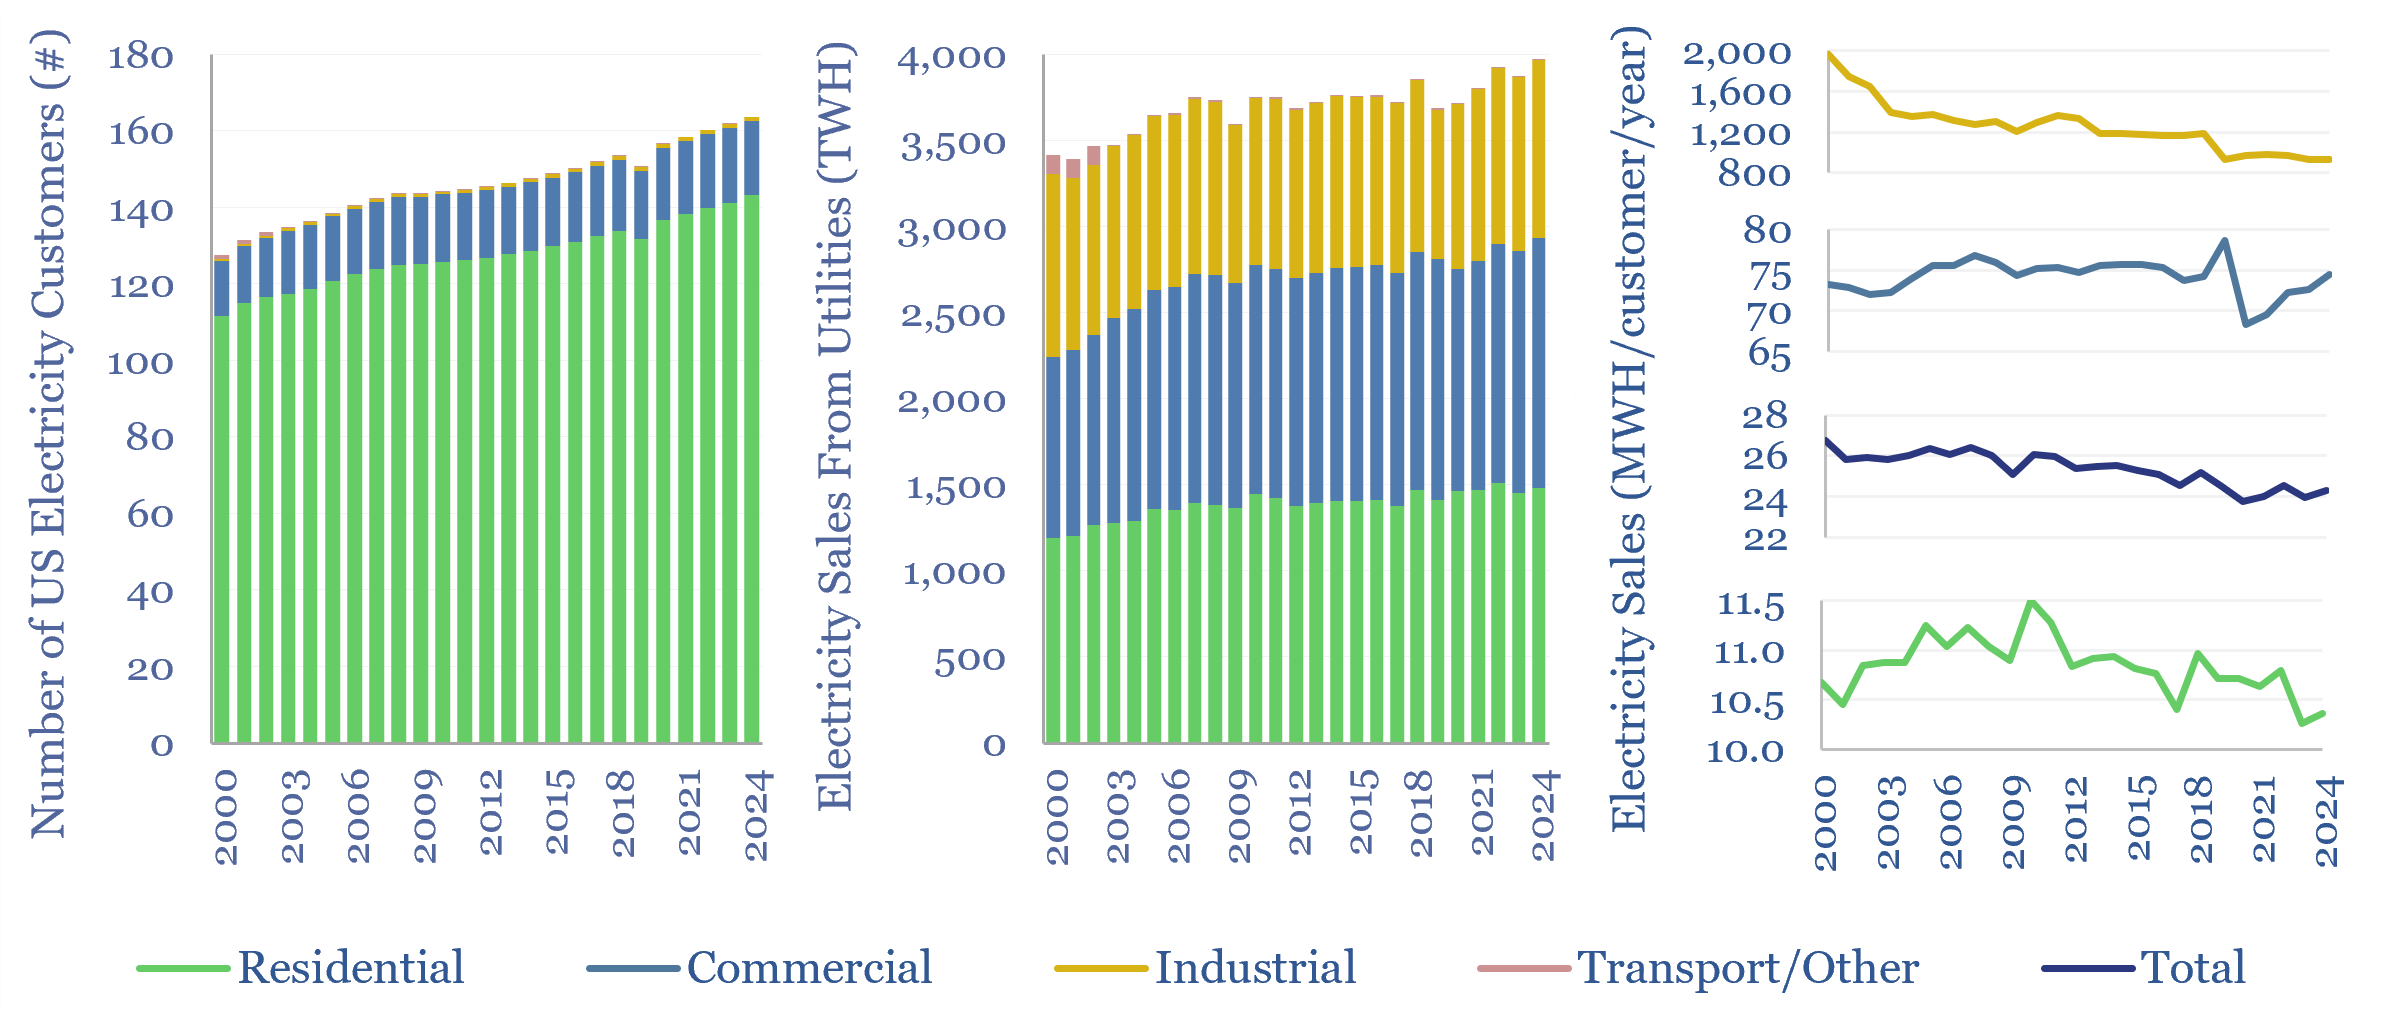
US electricity customers: sales, pricing, metering, load-shifting?
Download
Electric vehicle charging: the economics?
Download
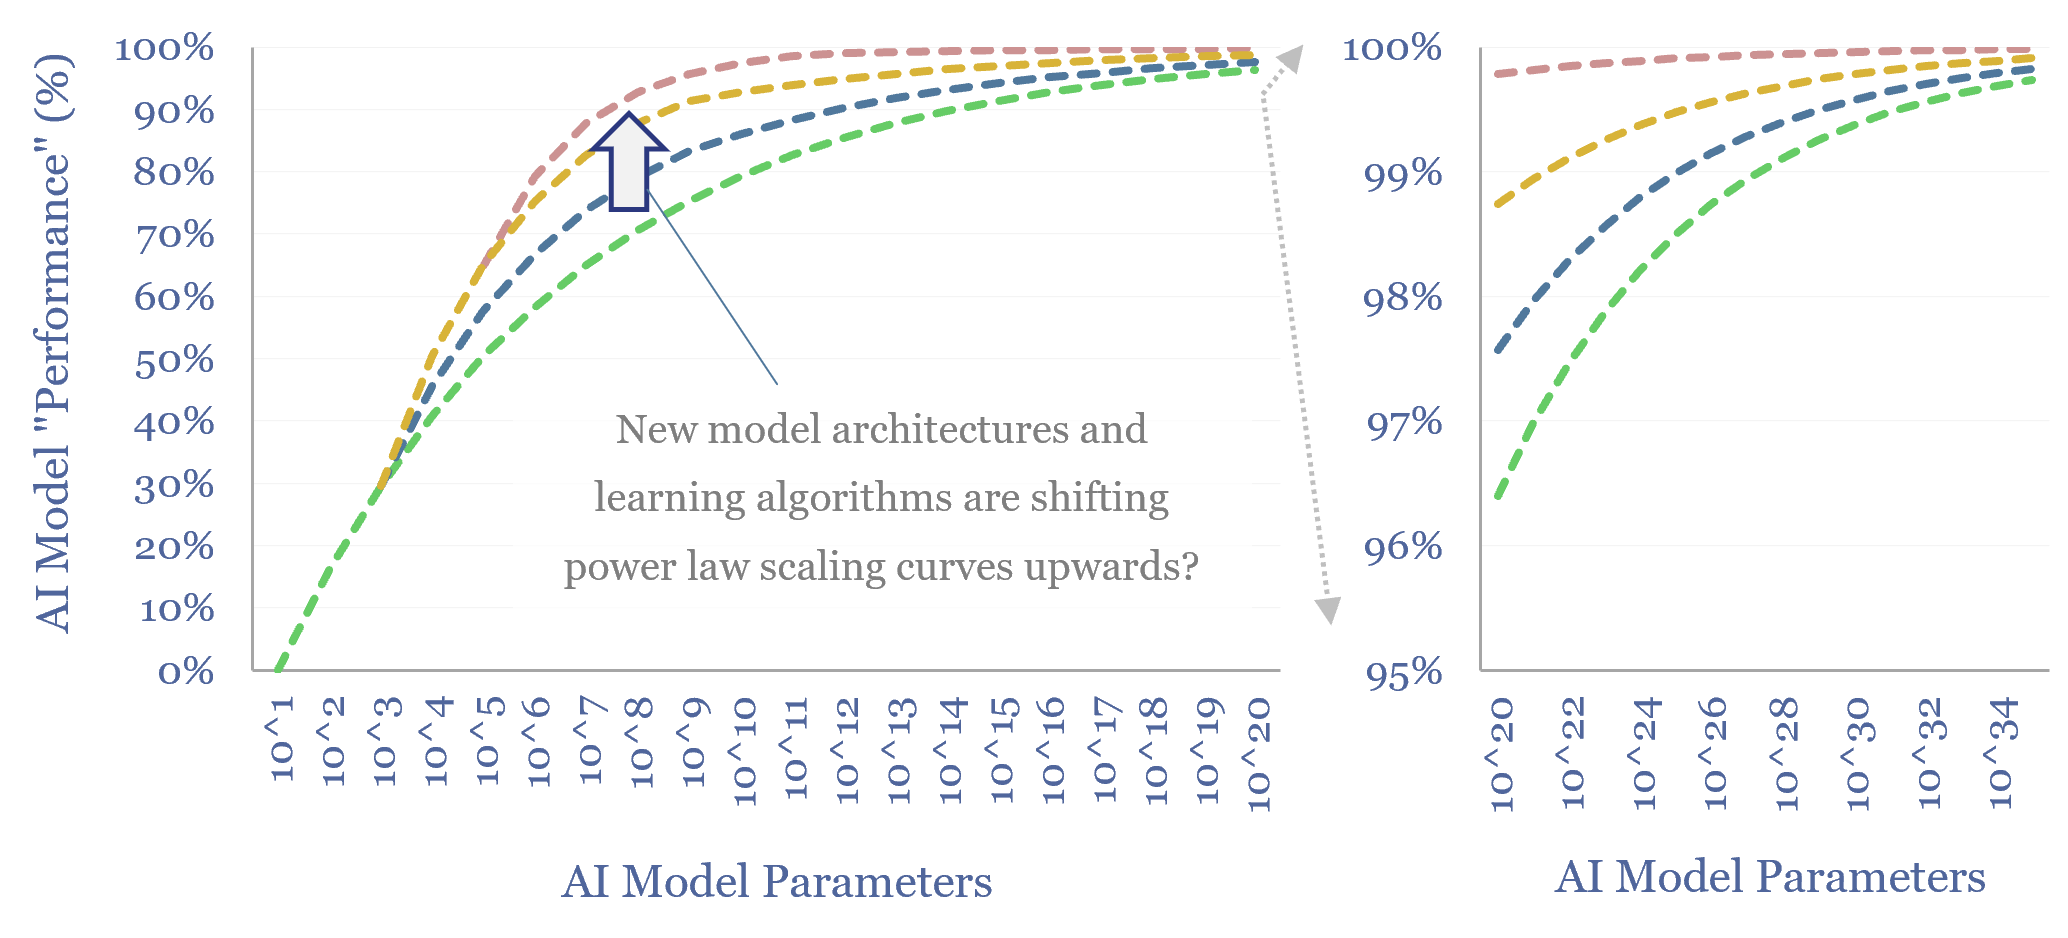
AI training energy: breaking the power laws?
Download

US load growth: electrical grounding?
Download

Microgrids: plug-and-play?
Download

ELCCs: reliability of power sources?
Download
Microgrids: the economics?
Download

Costs of demand response: Voltus case studies?
Download

Dunkelflaute: how big do the batteries need to be?
Download
Renewable-heavy grids: total system costs?
Download
Hydrogen Research
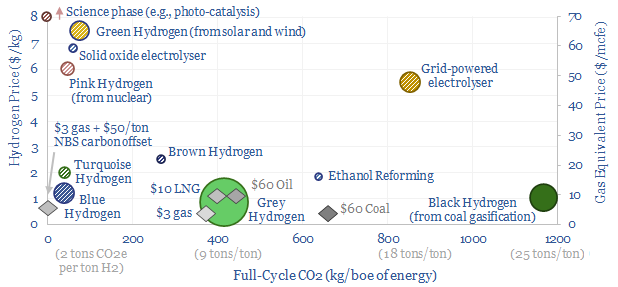
Hydrogen: overview and conclusions?
Download
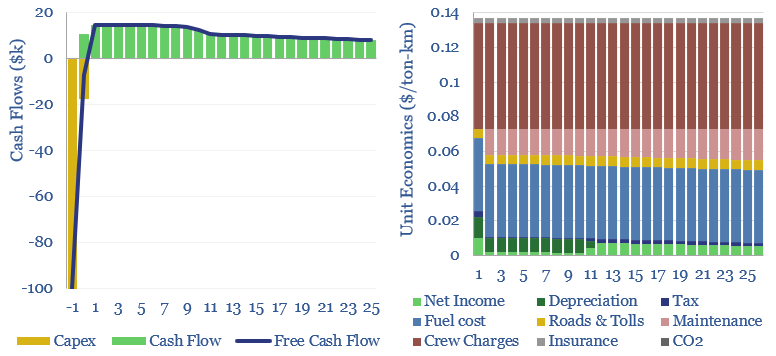
Heavy truck costs: diesel, gas, electric or hydrogen?
Download
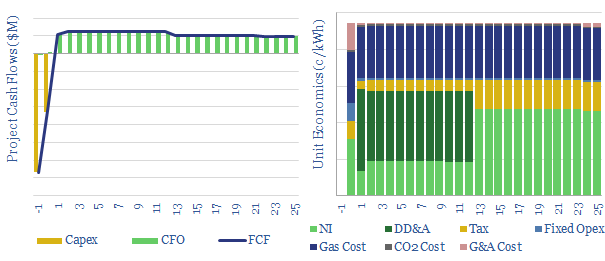
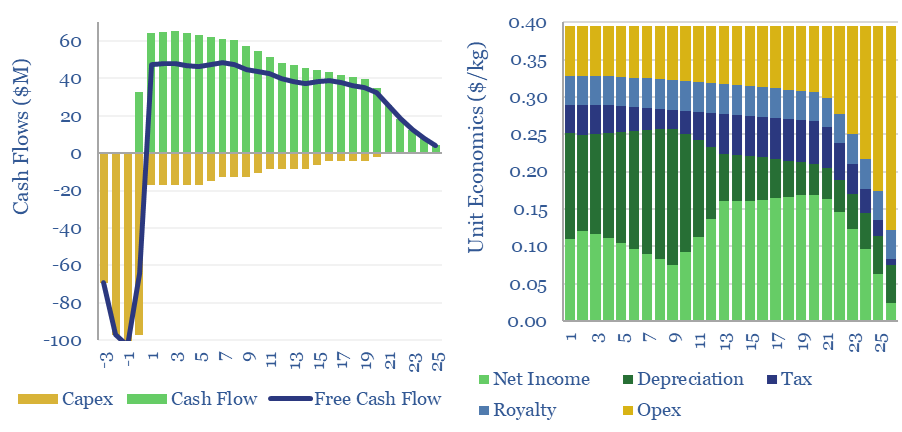
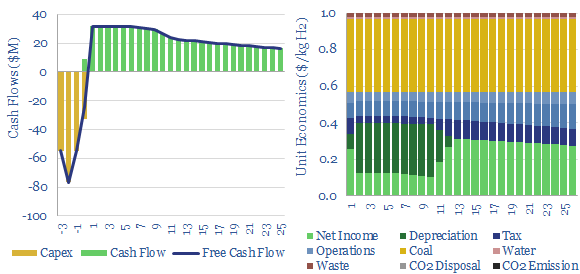
Green hydrogen: the economics?
Download
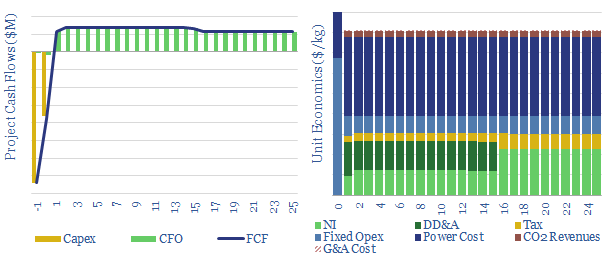
Fuel Cell Power Project Economics
Download
Methane reforming: costs of grey hydrogen, costs of blue hydrogen?
Download
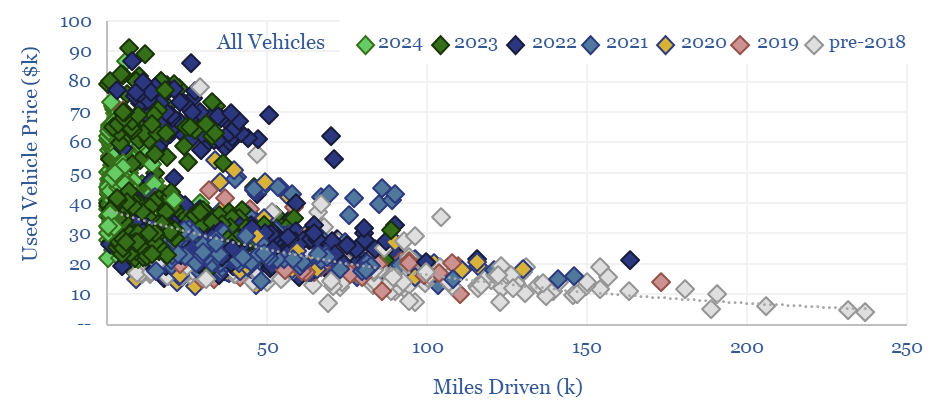
Vehicle depreciation rates: EVs versus ICEs?
Download
Air Products: ammonia cracking technology?
Download
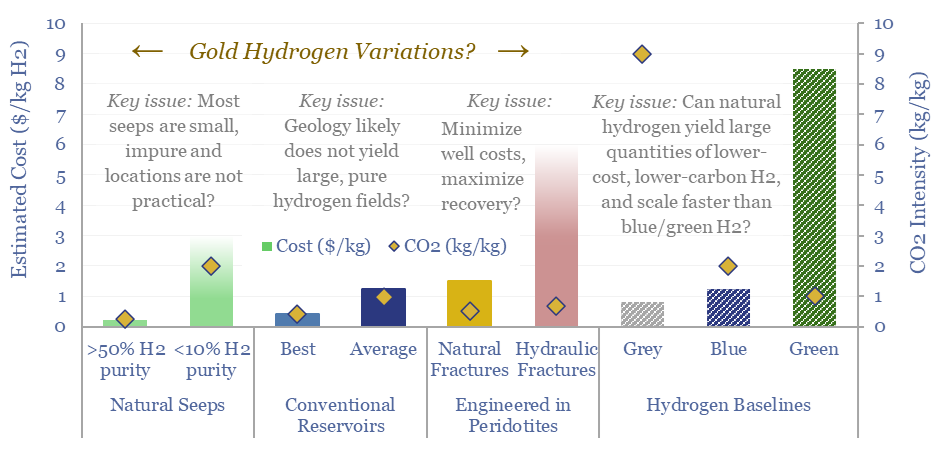
Natural hydrogen: going for gold?
Download
Cemvita Factory: microbial breakthroughs?
Download
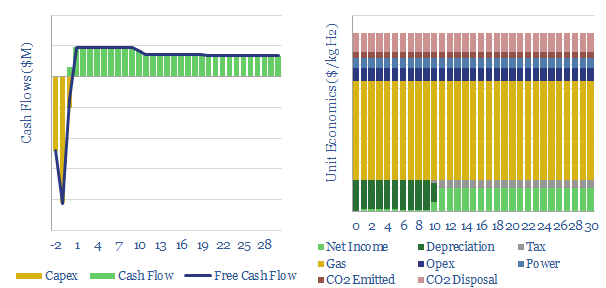
Gold hydrogen: the economics?
Download
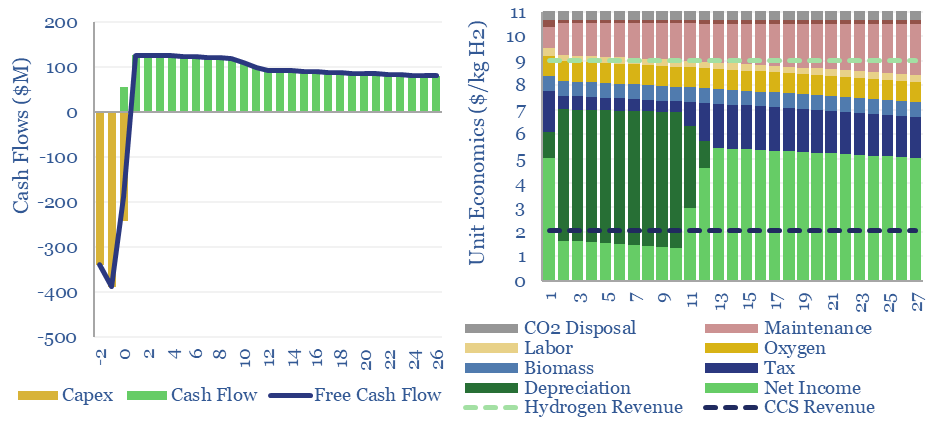
Bright green hydrogen from biomass gasification?
Download
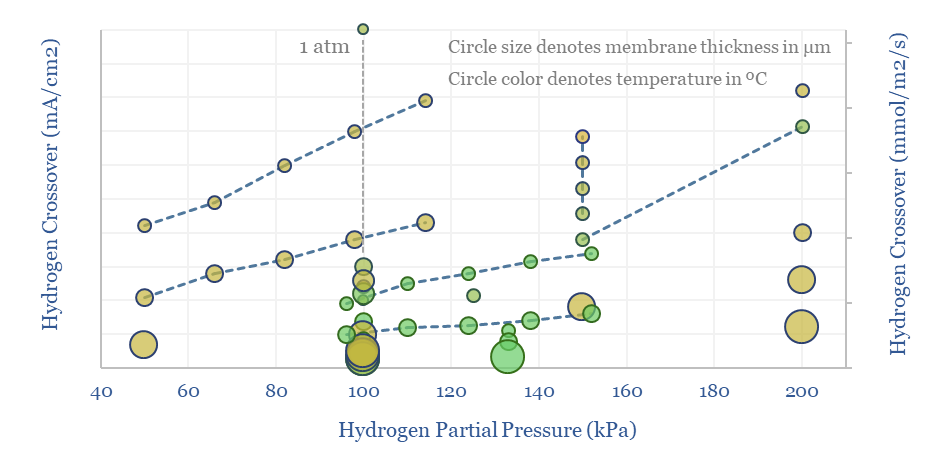
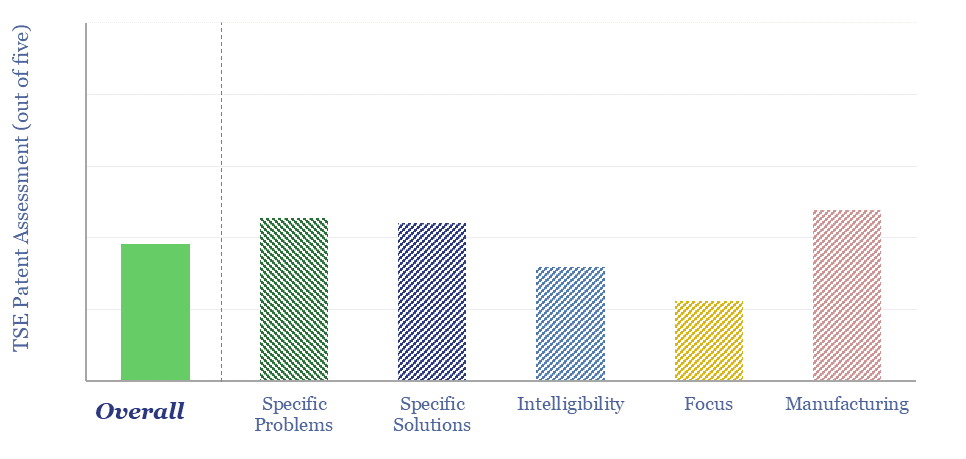
Nafion membranes: costs and hydrogen crossover?
Download
Electrochemistry: redox potential?
Download
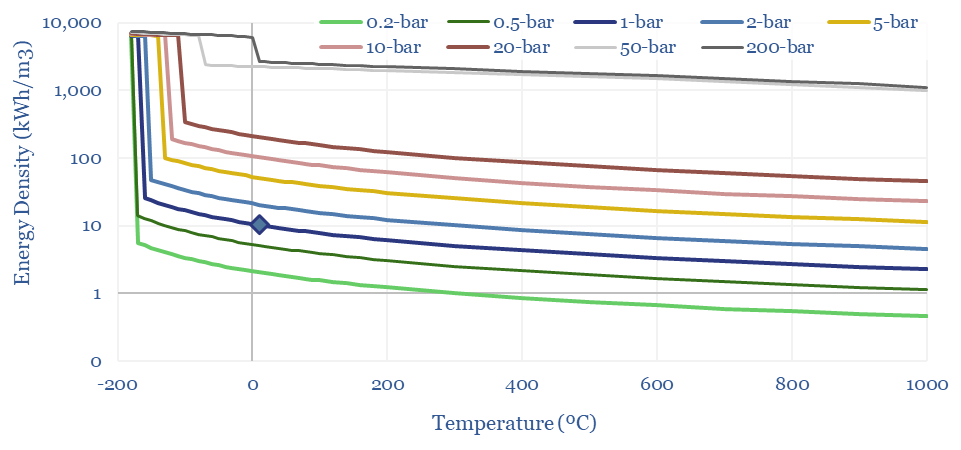
Density of gases: by pressure and temperature?
Download
Hydrogen evolution: outlook for industrial gases?
Download
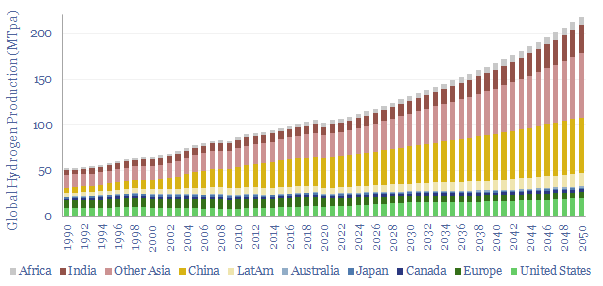
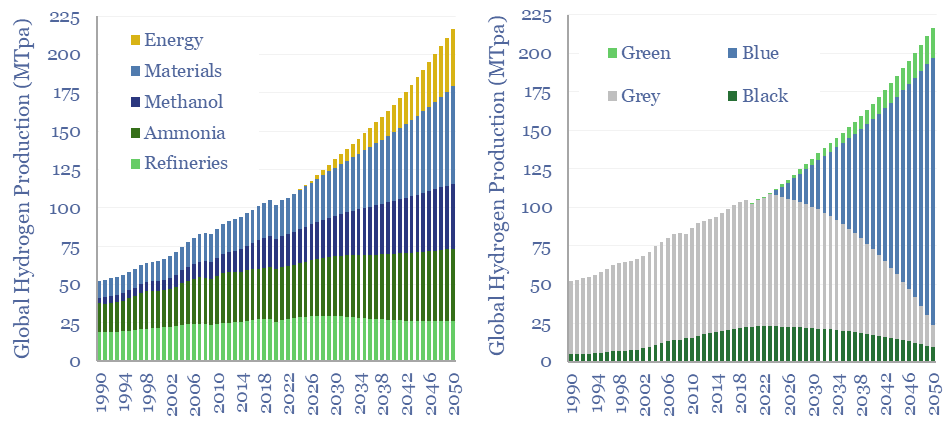
Global hydrogen supply-demand: by region, by use & over time?
Download
Plug power: green hydrogen breakthroughs?
Download
MIRALON: turquoise hydrogen breakthrough?
Download
Bloom Energy: solid oxide fuel cell technology?
Download
Hydrogen reformers: SMR versus ATR?
Download
US hydrogen production: by facility and by company?
Download
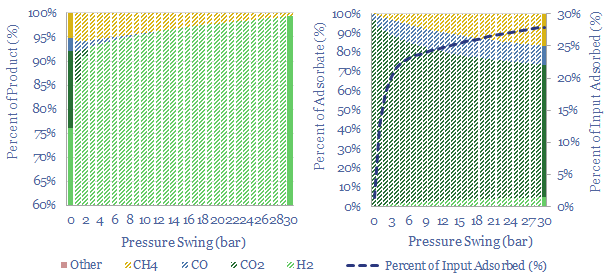
Industrial gas separation: swing producers?
Download
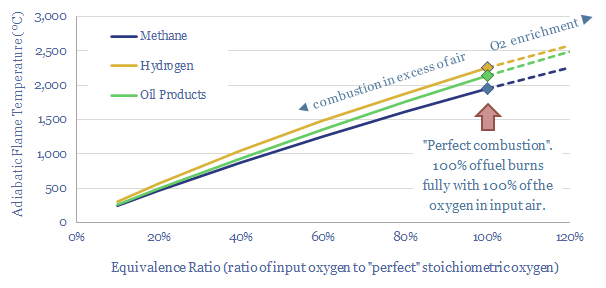
Adiabatic flame temperature: hydrogen, methane and oil products?
Download
Topsoe: autothermal reforming technology?
Download
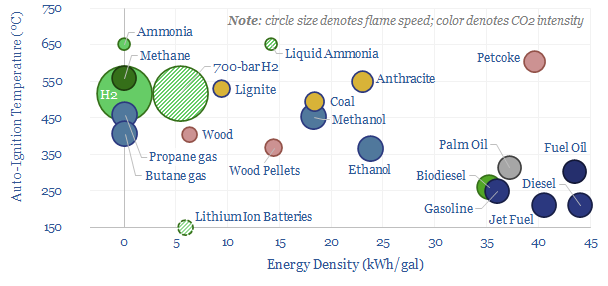
Combustion fuels: density, ignition temperature and flame speed?
Download
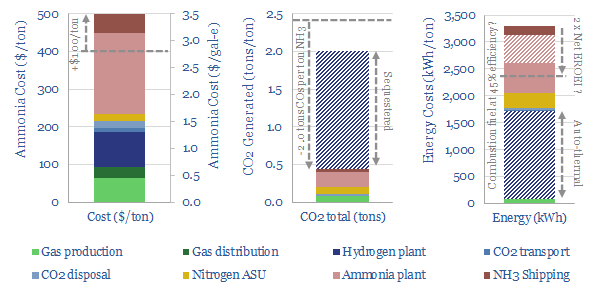
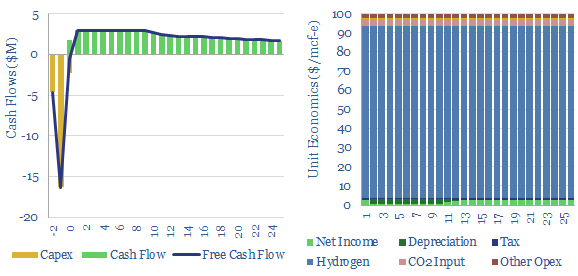
Blue ammonia: options strategy?
Download
Sabatier process: synthetic natural gas costs?
Download
NEL: green hydrogen technology review?
Download
Energy policy: unleashing new technologies?
Download
Costs of hydrogen from coal gasification?
Download
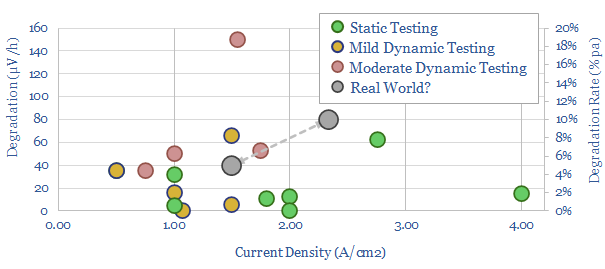
Green hydrogen: can electrolysers run off renewables?
Download
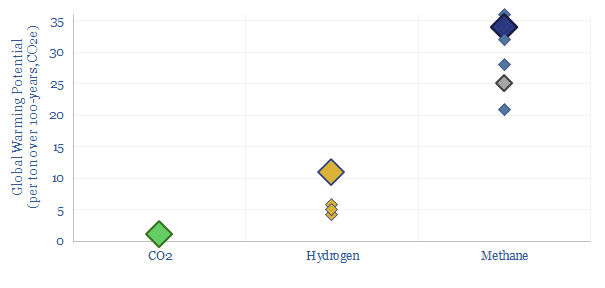
Hydrogen: what GWP and climate impacts?
Download
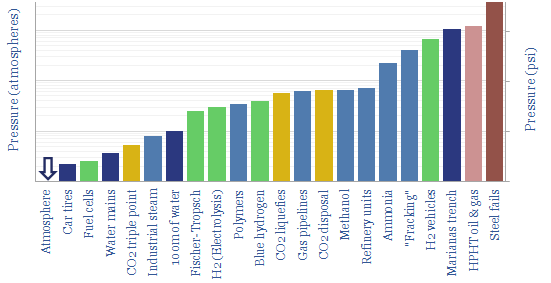
Pressure ratings: industrial and energy processes?
Download
Monolith: turquoise hydrogen breakthrough?
Download
Turquoise hydrogen from methane pyrolysis: economics?
Download
Electro-fuels: start out as a billionaire?
Download
Green hydrogen electrolysers in Europe: a database?
Download
Power-to-liquids: companies commercializing electro-fuels?
Download
Power-to-liquids: the economics?
Download
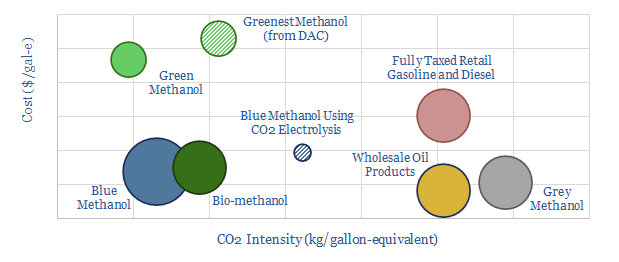
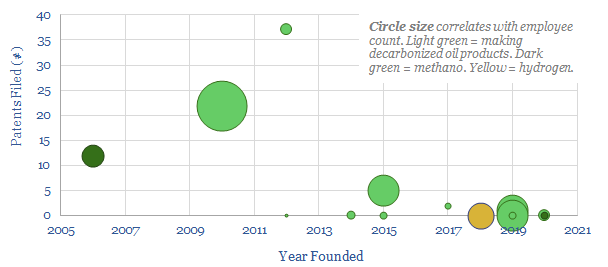
Methanol: the next hydrogen?
Download
Biofuels Research
Biofuel technologies: an overview?
Download
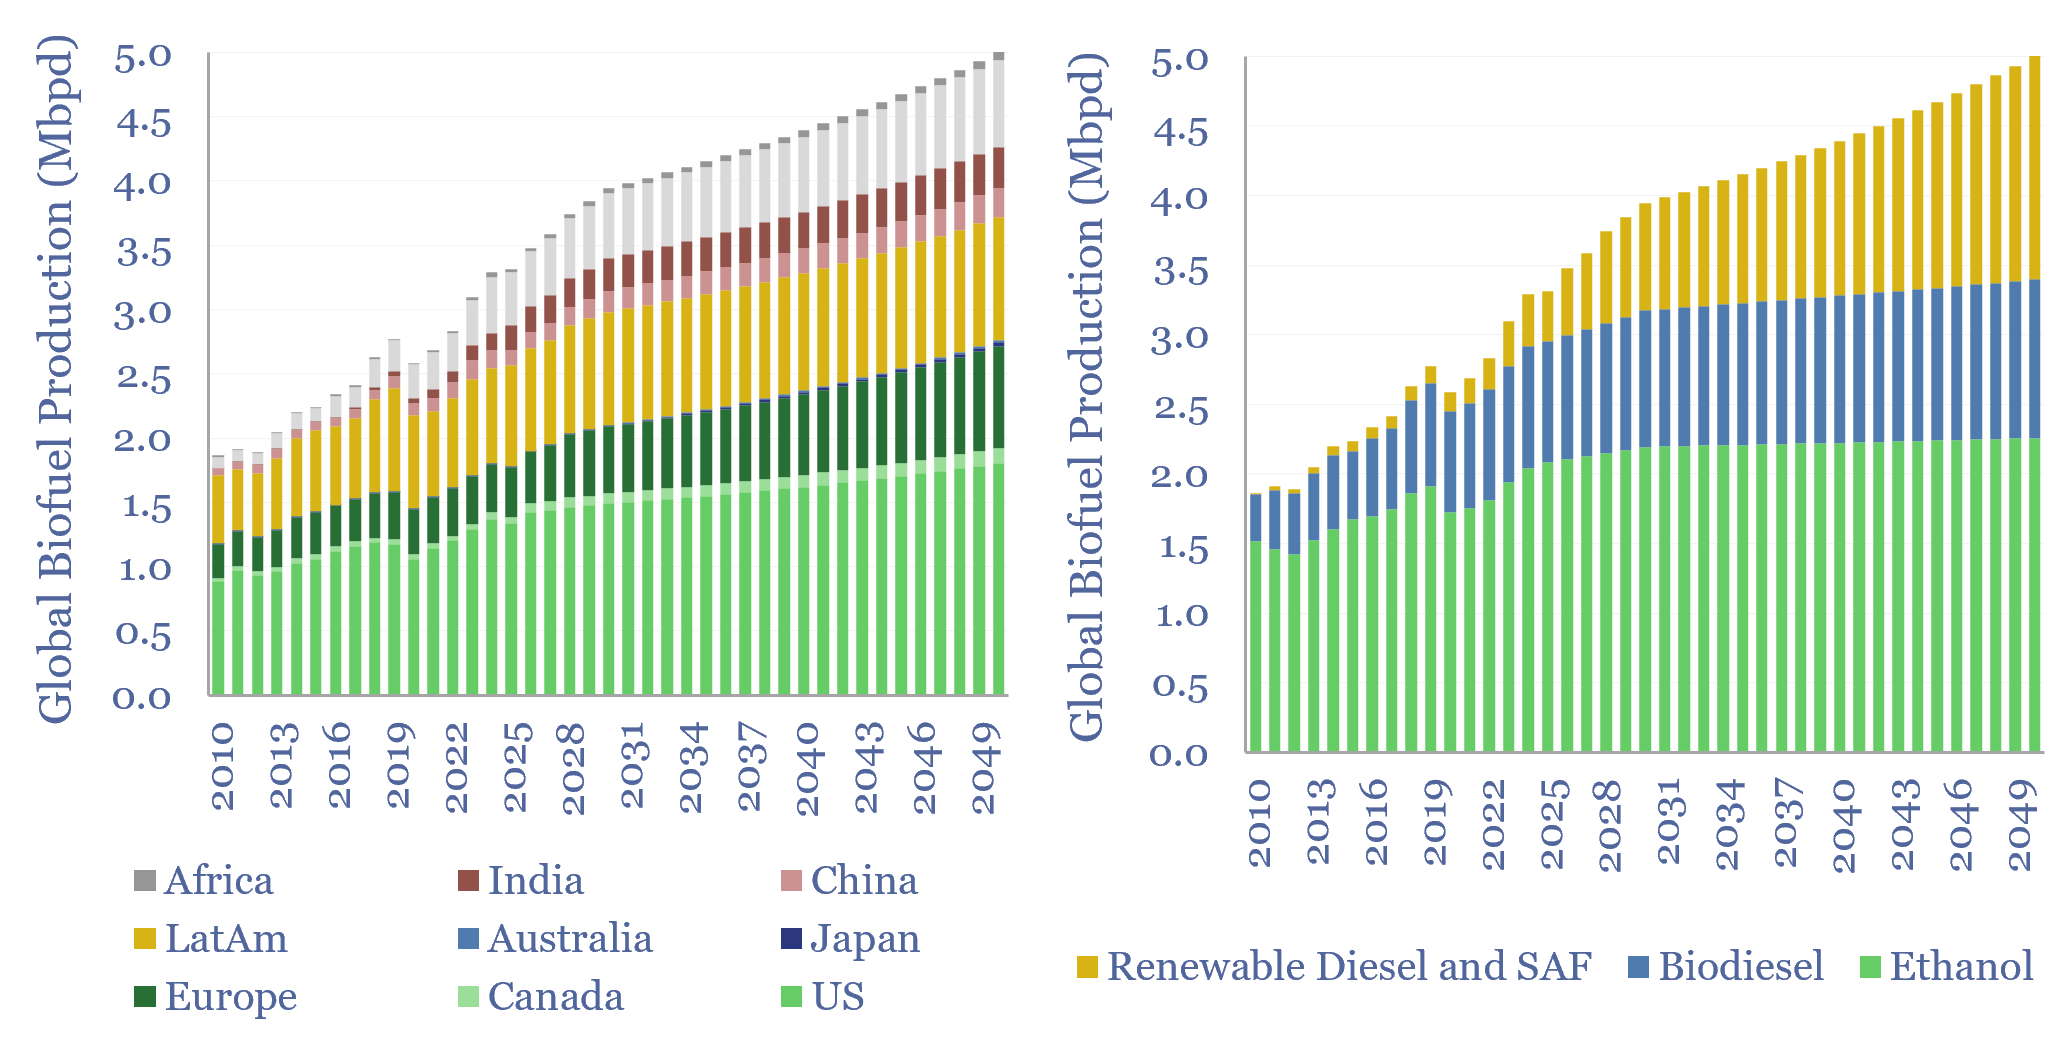
Global biofuel production: by region, by liquid fuel?
Download
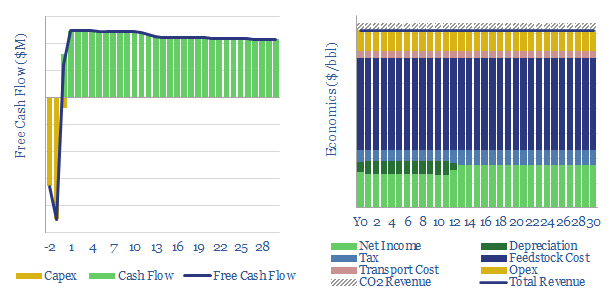
Renewable diesel: the economics?
Download
Sustainable aviation fuel: flight path?
Download
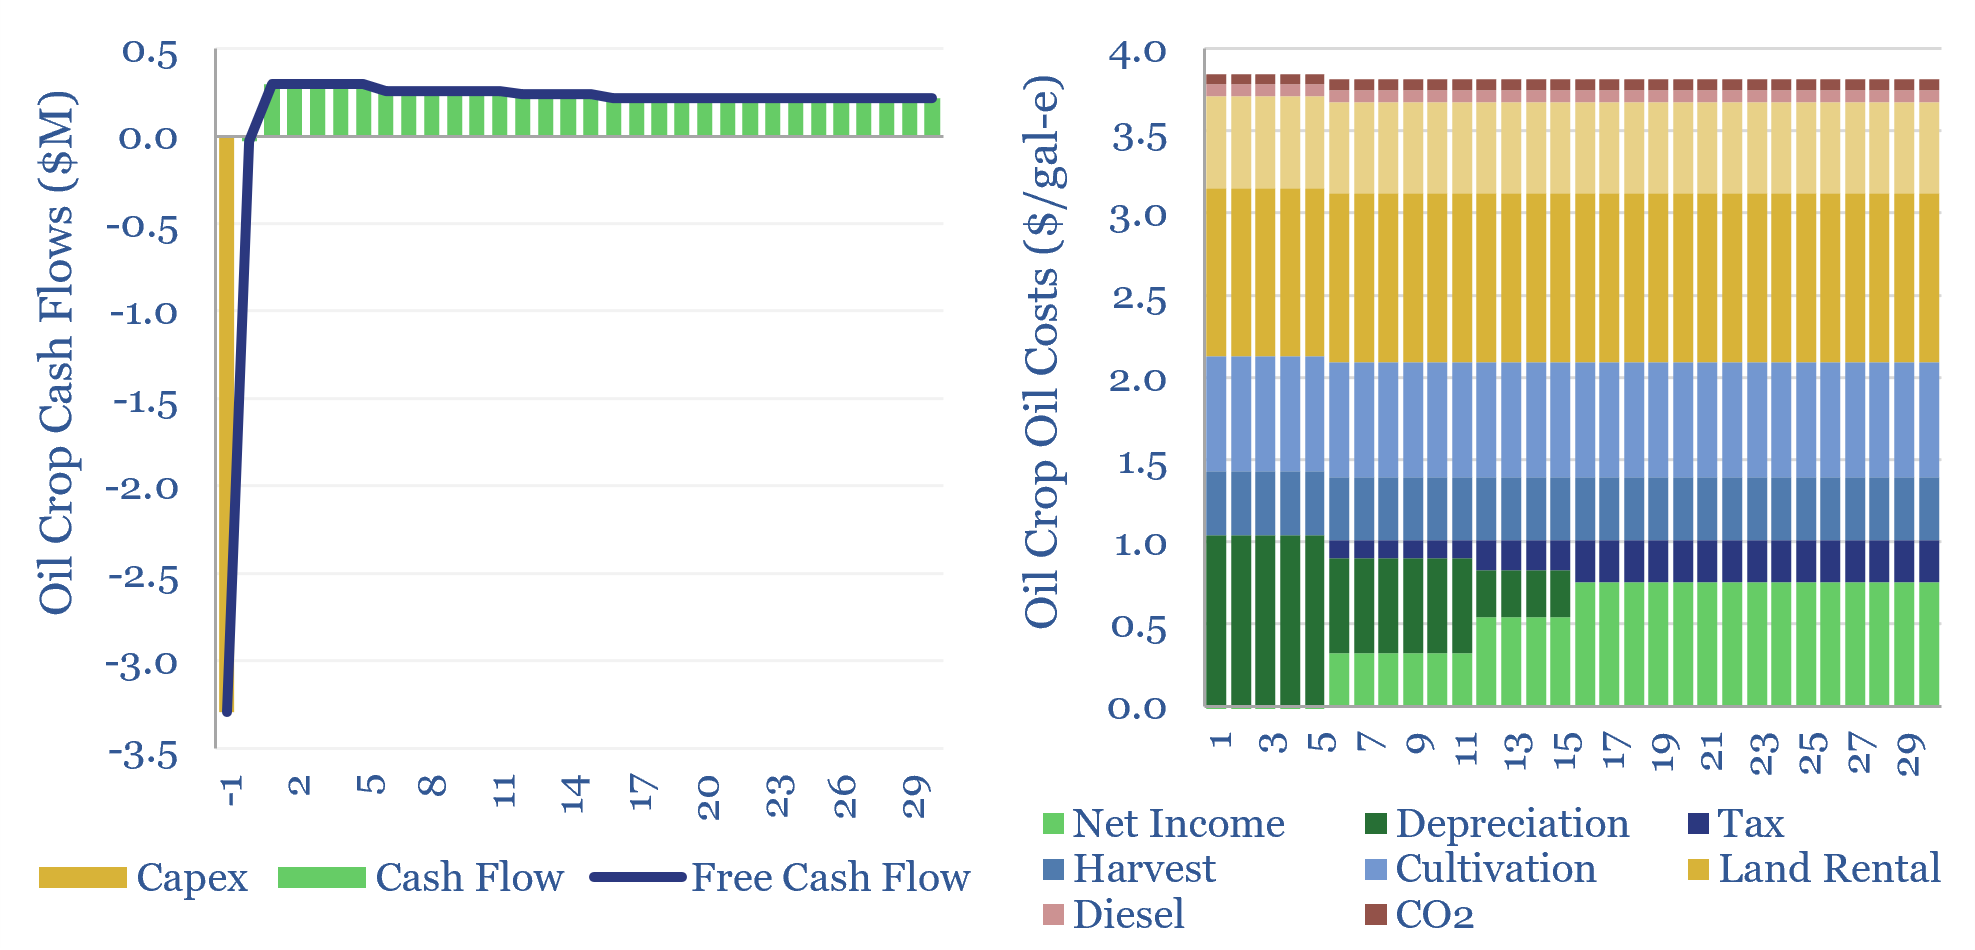
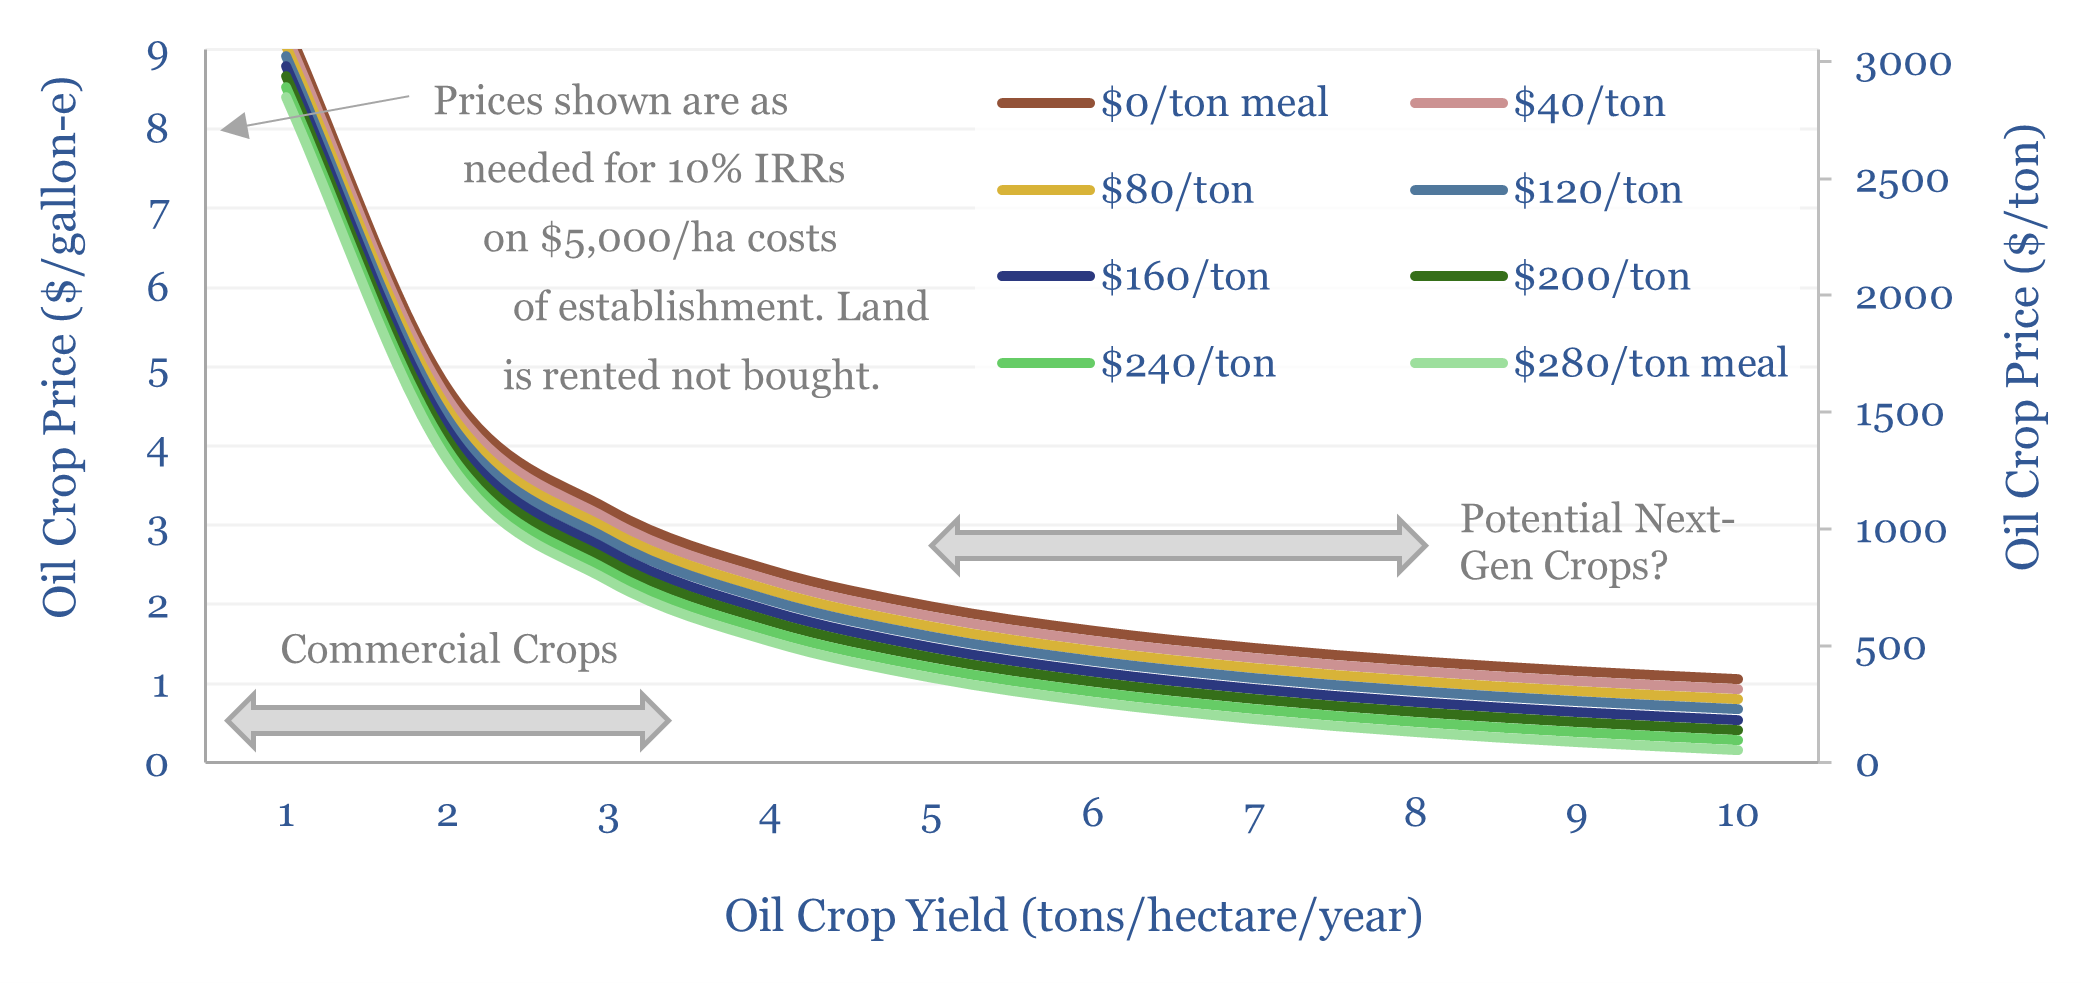
Oil crops: the economics?
Download
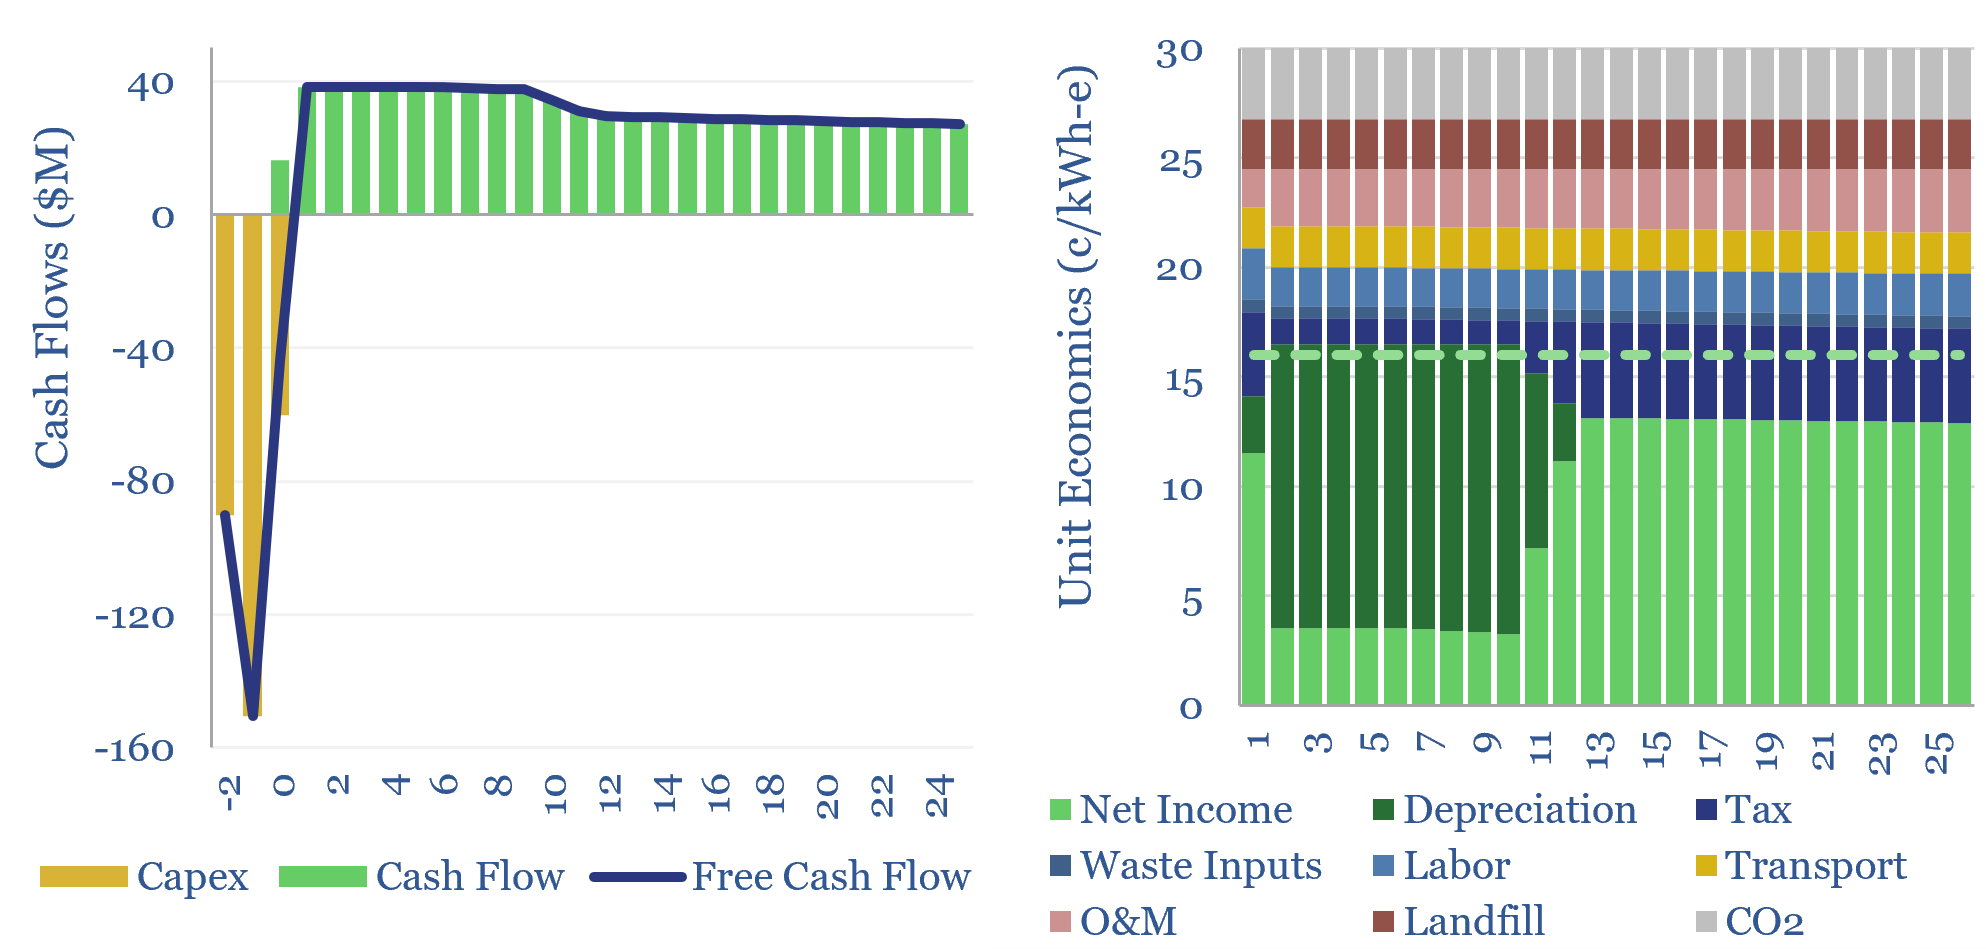
Waste-to-energy: levelized costs of electricity?
Download
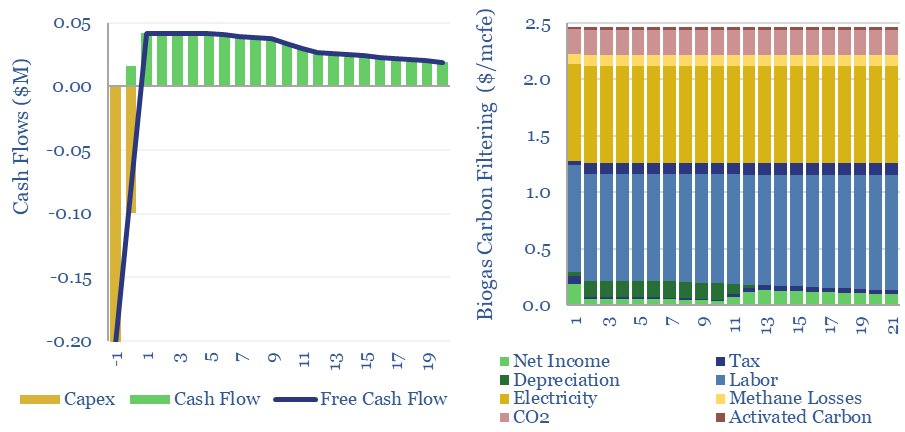
Costs of biogas upgrading to biomethane?
Download
Sugar to ethanol: value in volatility?
Download
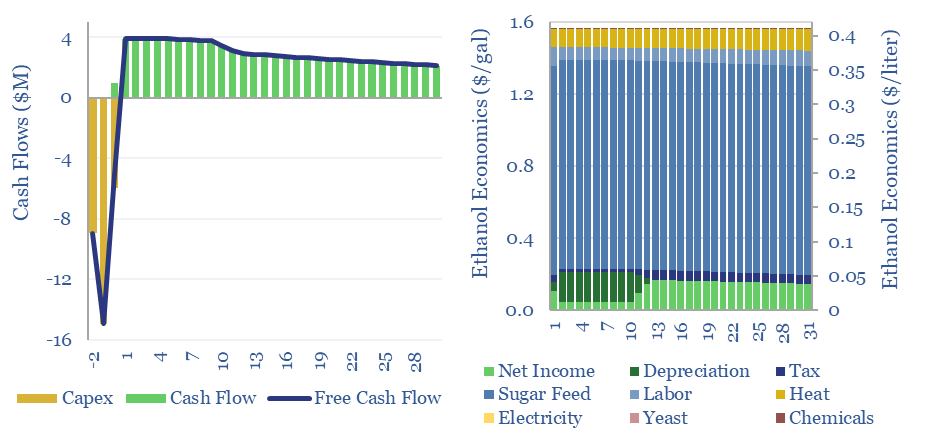
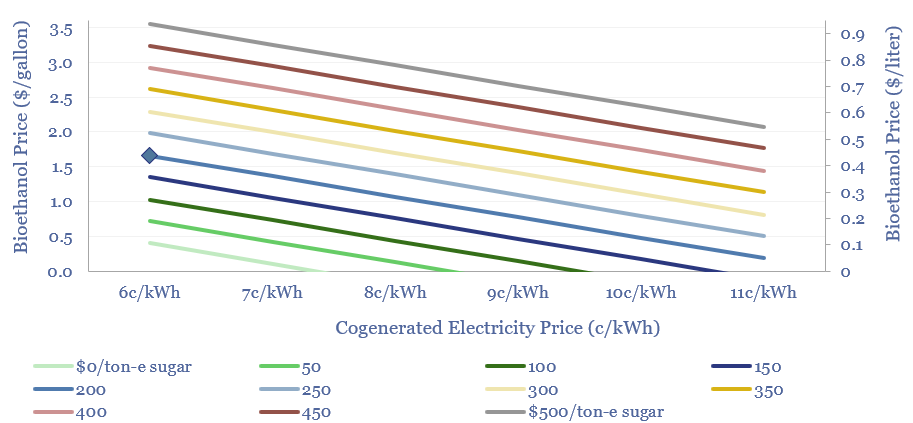
Sugar to ethanol: the economics?
Download
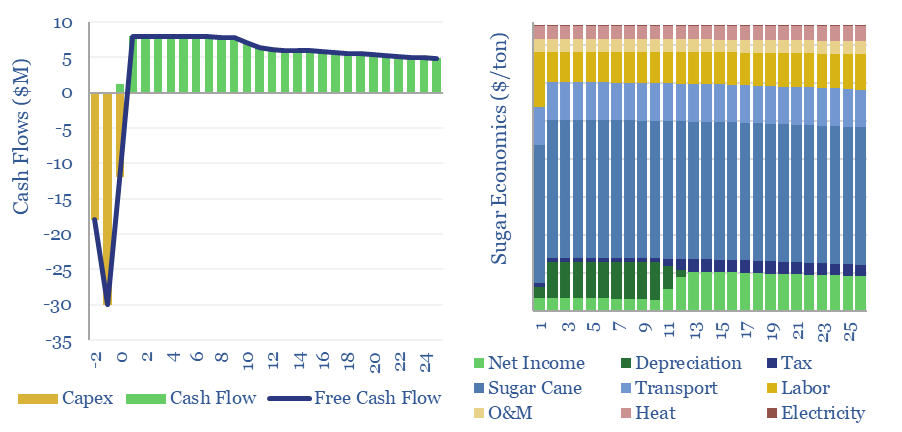
Sugar production: the economics?
Download
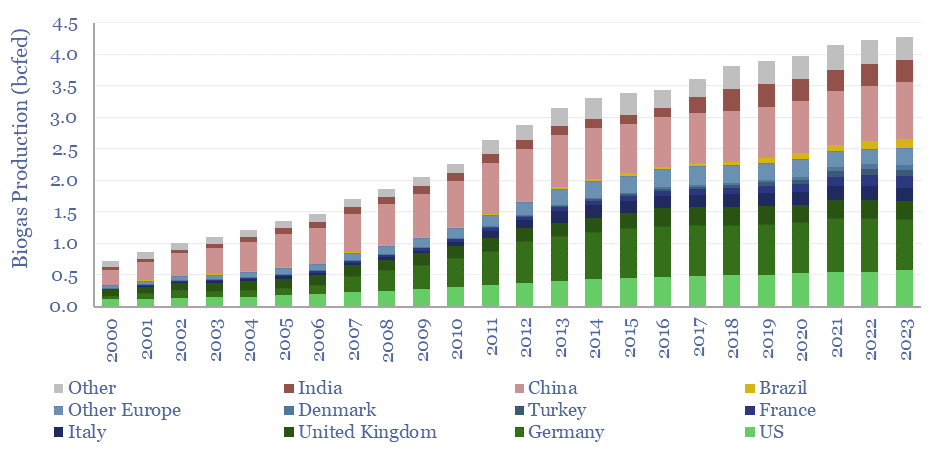
Global biogas production by country?
Download
Biogas: the economics?
Download
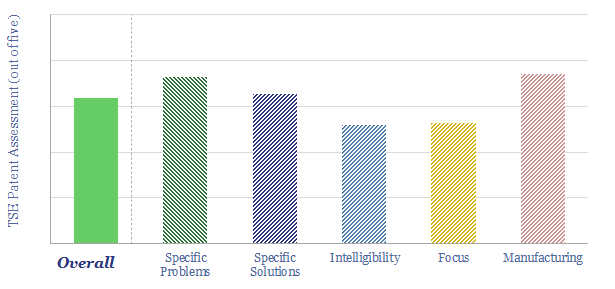
Verbio: bio-energy technology review?
Download
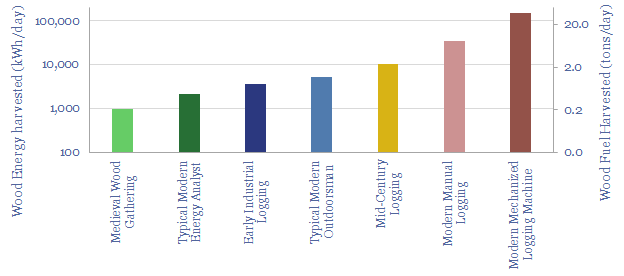
Energy history: how much wood can be cut in a day?
Download
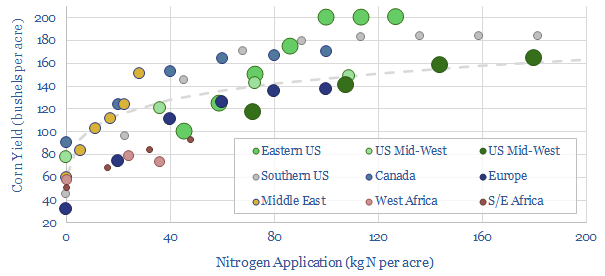
Crop production: how much does nitrogen fertilizer increase yields?
Download
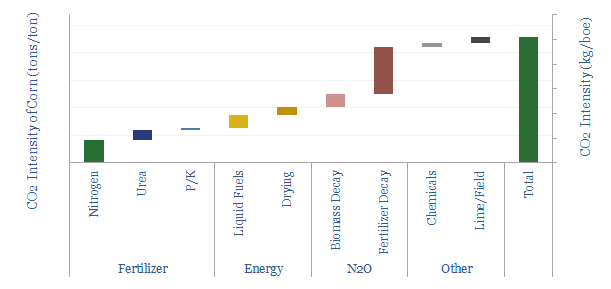
Crop production: what CO2 intensity?
Download
Bio-coke: energy economics?
Download
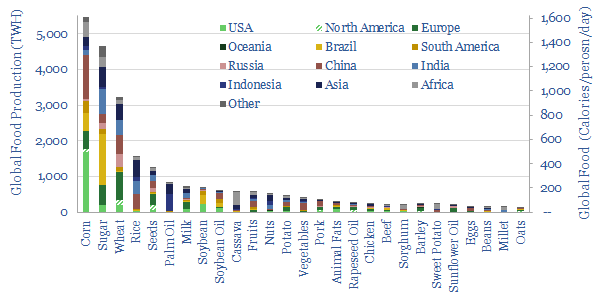
World food production: energy breakdown by crop by country?
Download
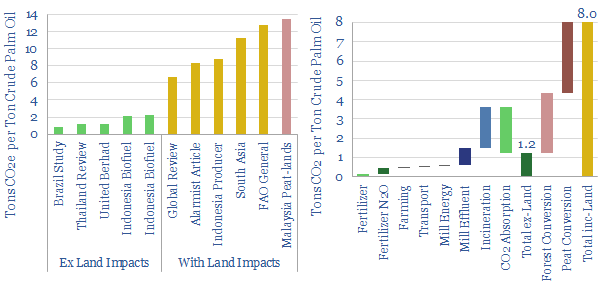
Palm oil: what CO2 intensity?
Download
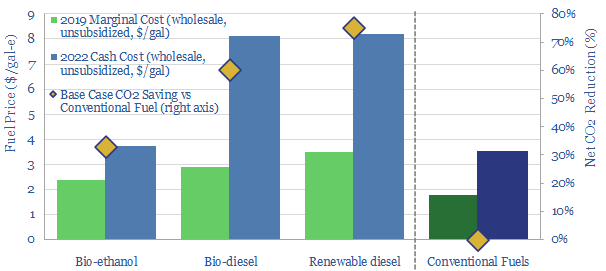
Biofuels: the best of times, the worst of times?
Download
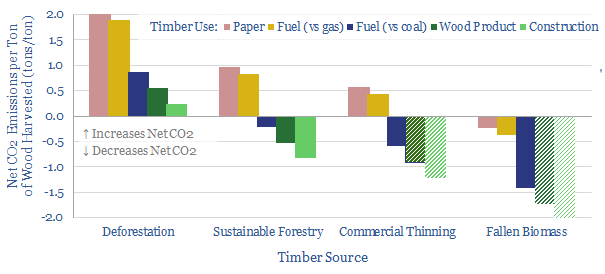
Wood use: what CO2 credentials?
Download
Landfill gas: rags to riches?
Download
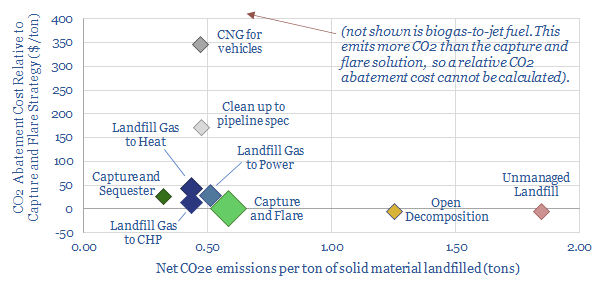
Landfill gas: the economics?
Download
Danimer: bio-plastics breakthrough?
Download
LanzaTech: biofuels breakthrough?
Download
Origin Materials: bio-plastics breakthrough?
Download
Ethanol: hangover cures?
Download
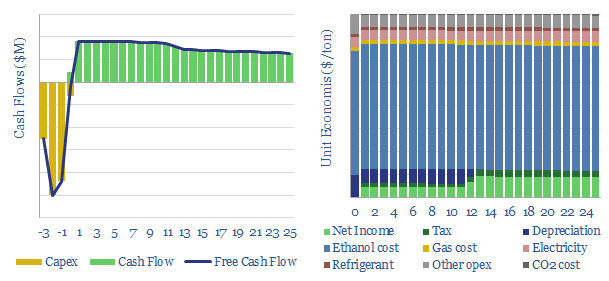
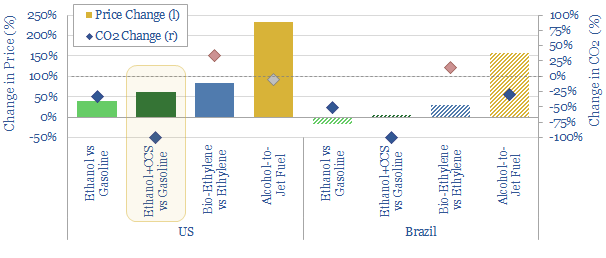
Ethanol-to-ethylene: the economics?
Download
Ethanol: getting wasted?
Download
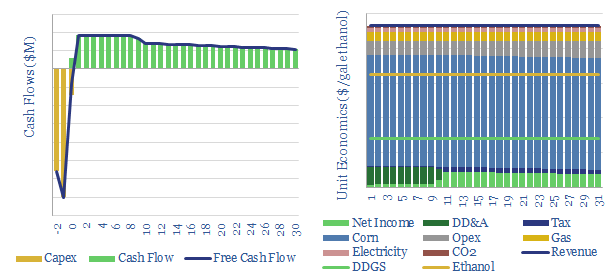
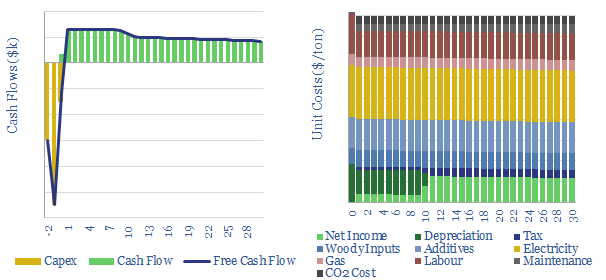
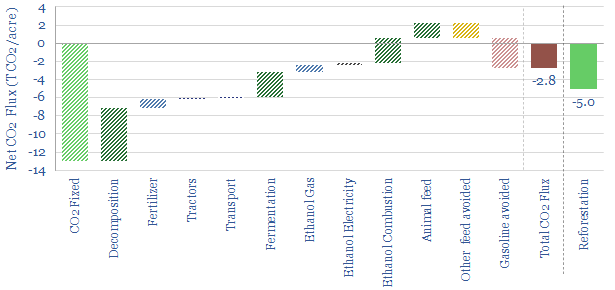
Ethanol from corn: the economics?
Download
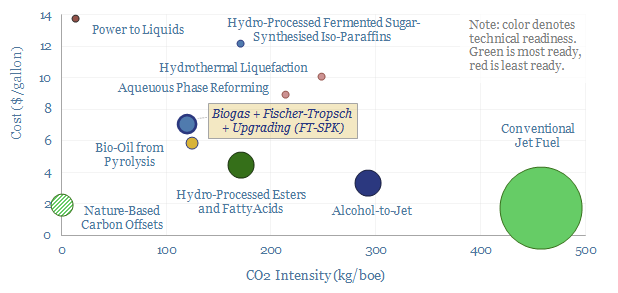
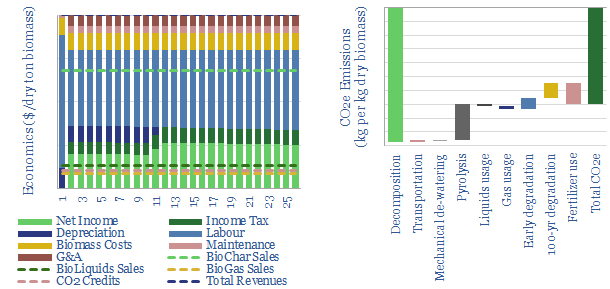
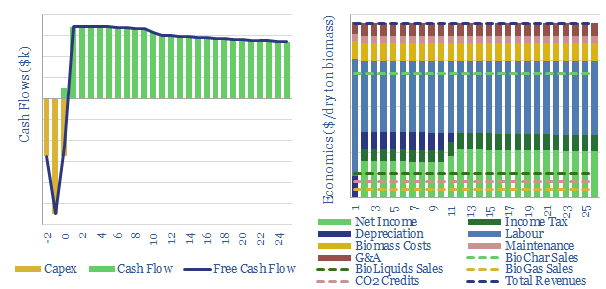
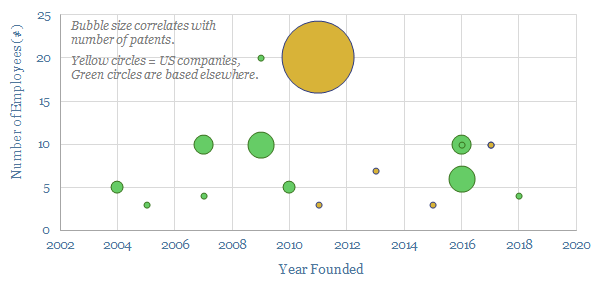
Biogas-to-liquids: decarbonize aviation fuels?
Download
Biochar: burnt offerings?
Download
Biomass to biochar: the economics?
Download
Leading companies in biochar?
Download
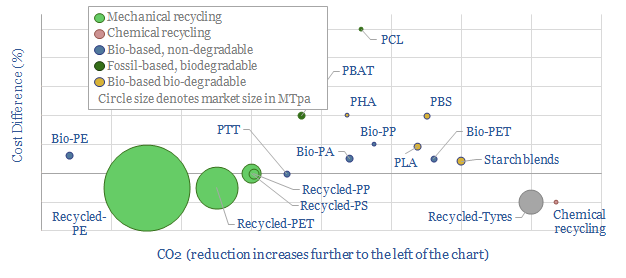
Next-generation plastics: bioplastic, biodegradable, recycled?
Download
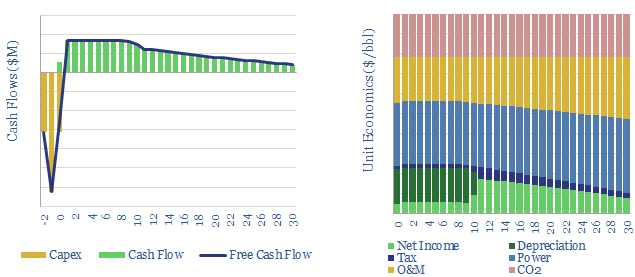
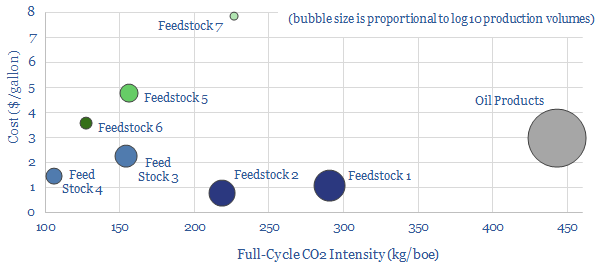
Methanol production: the economics?
Download
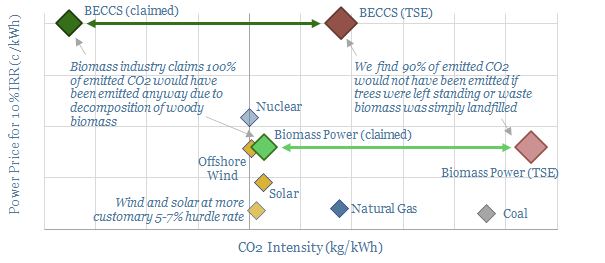
Biomass and BECCS: what future in the transition?
Download
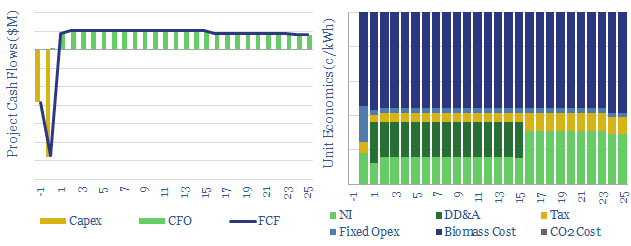
Biomass power: costs, levelized costs and BECCS?
Download
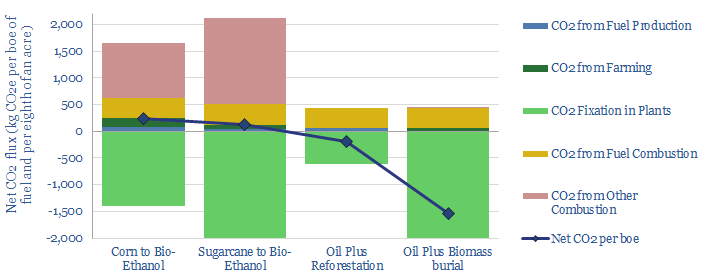
Biofuels: better to bury than burn?
Download
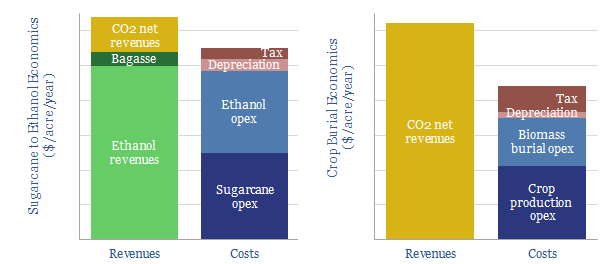
Biomass to biofuel, or biomass for burial?
Download