
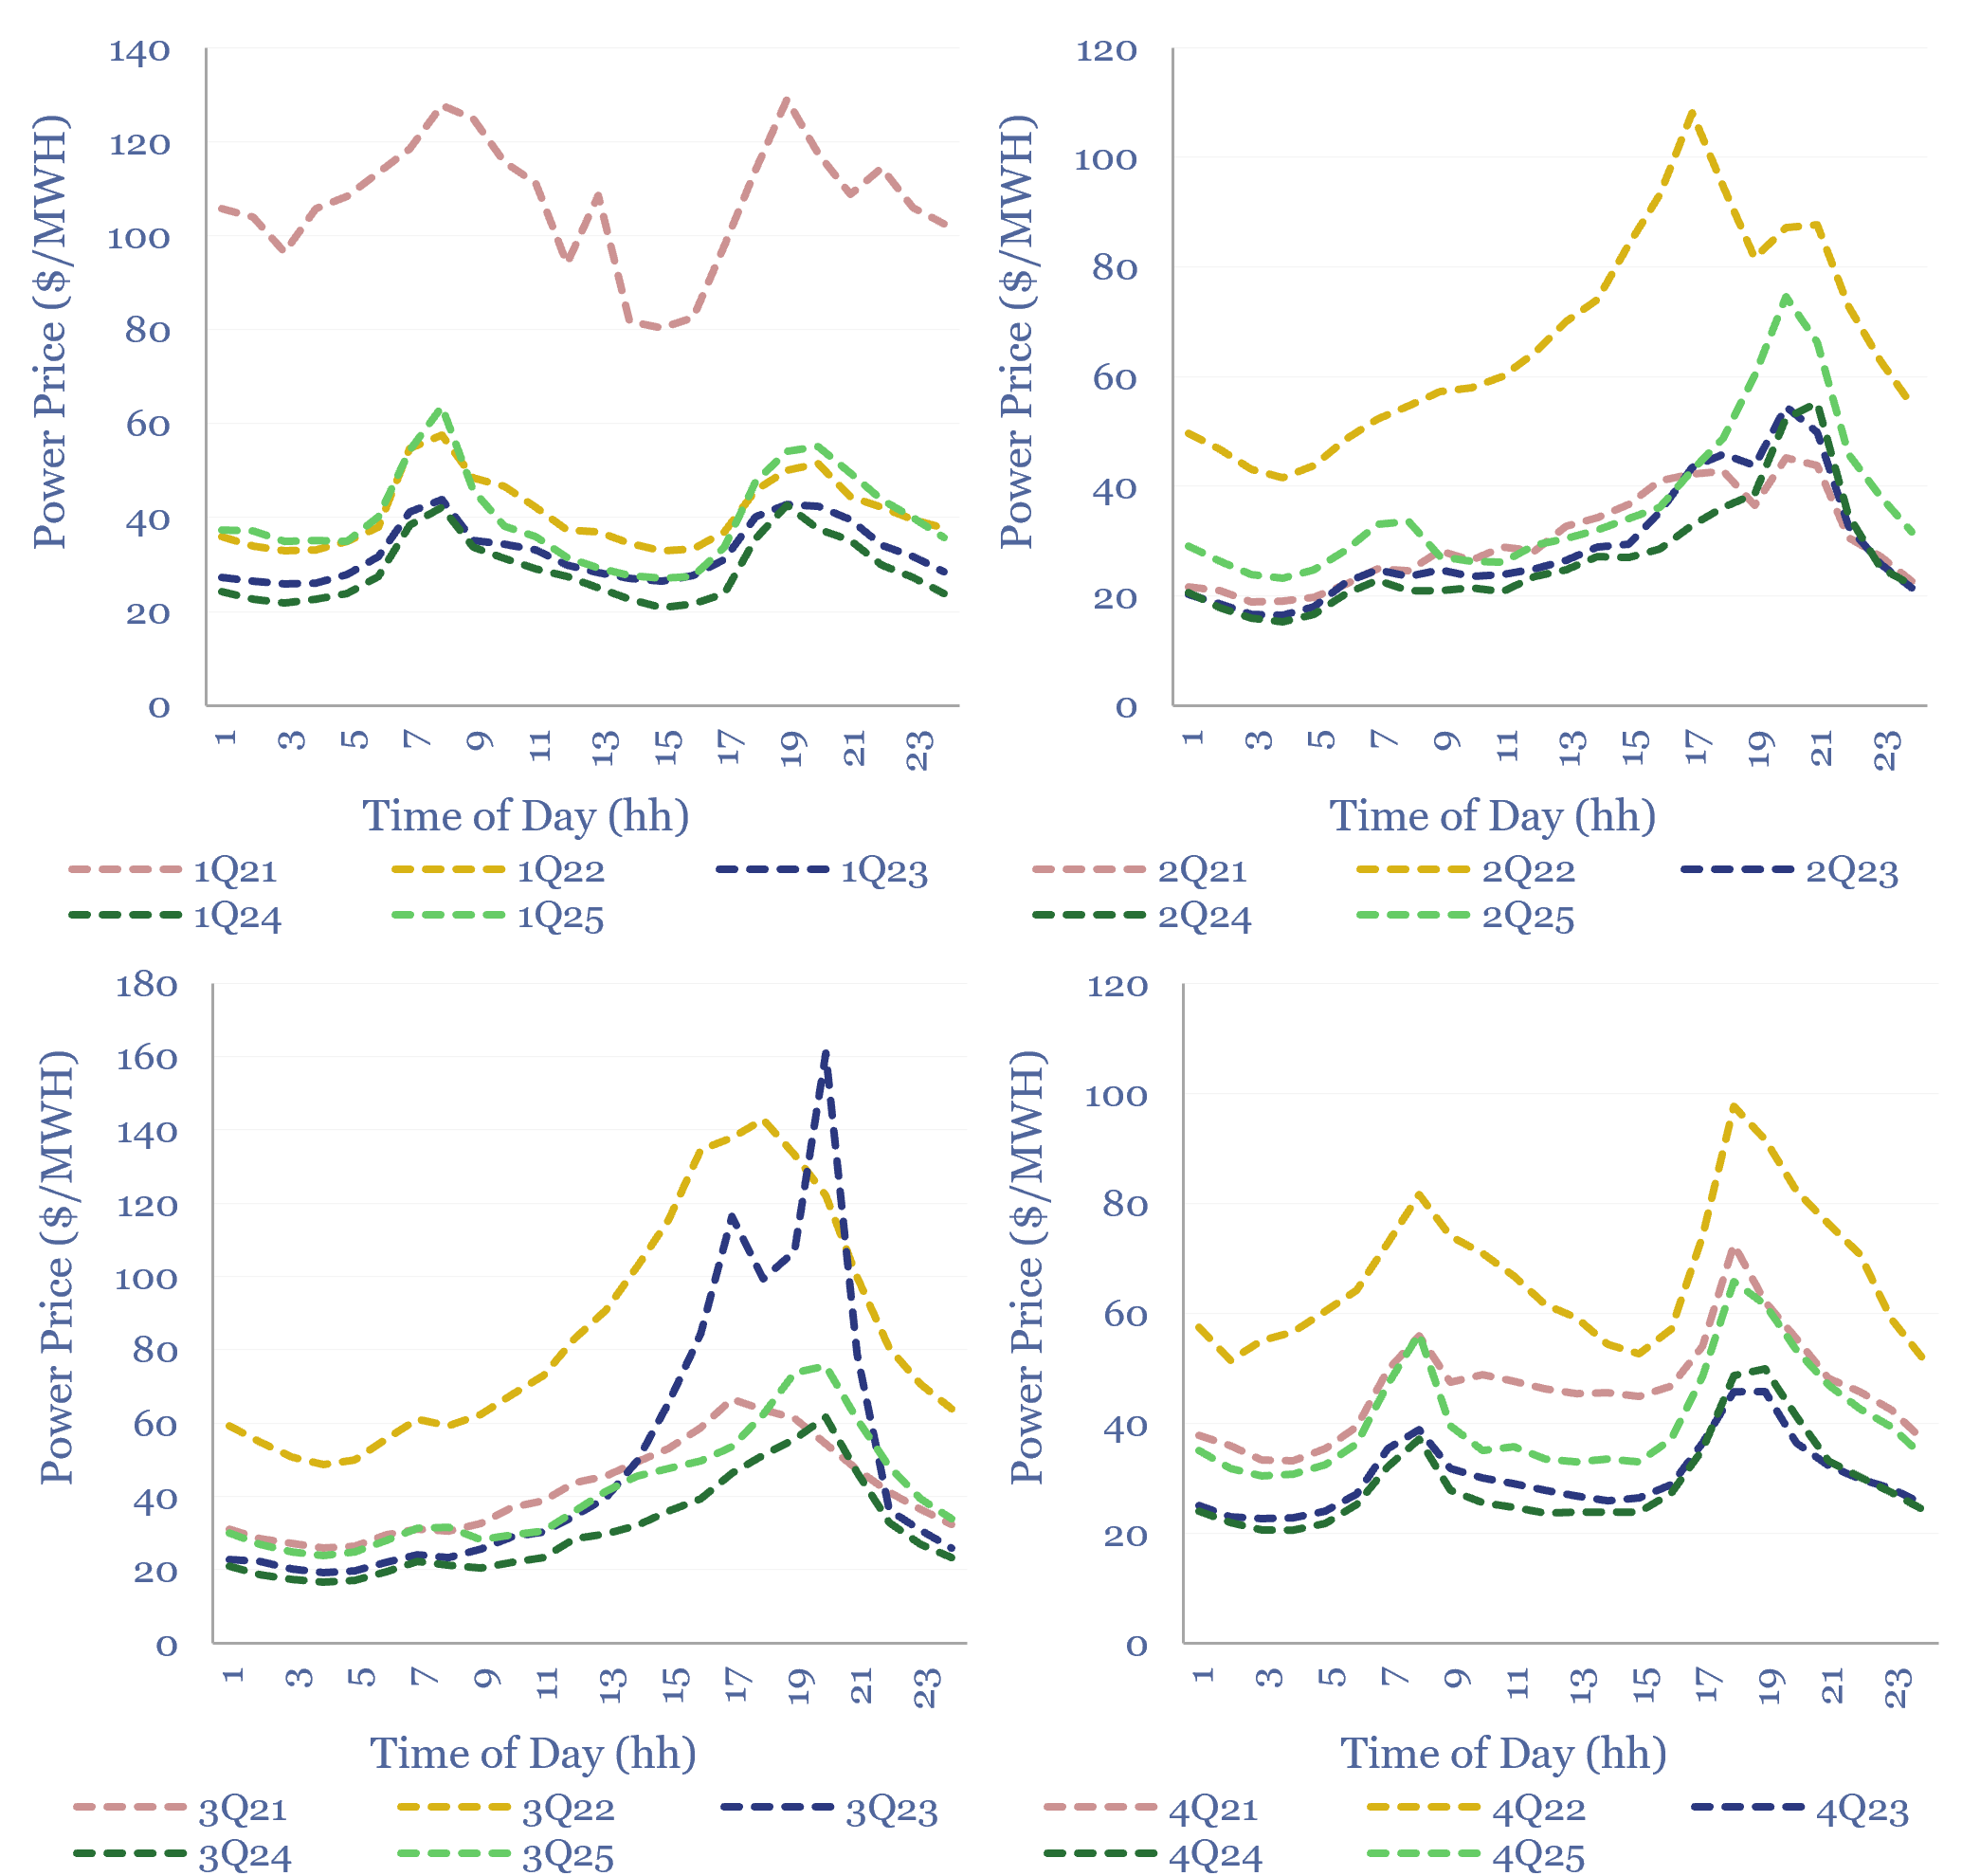
In solar-heavy grids, power prices trough around mid-day, then ramp up rapidly as the sun sets. This price distribution over time is known as the duck curve. US power prices are getting 25-30% more ducky each year, based on some forms of measurement. Power prices are clearly linked to the instantaneous share of wind/solar in grids.
The famous duck curve shows how intra-day power prices are impacted by the rise of solar, rising gently in the morning, troughing in the middle of the day, then rising rapidly in the evenings after the sun has set. Apparently this looks like a duck. But is the duck curve getting more ducky over time, as solar gets built out?
This data-file aims to measure the duckiness of duck curves, over time, across the big five US grid regions: CAISO, ERCOT, MISO, PJM and SPP. On average, over the past 3-years, pricing ramps from c$30/MWH at mid-day to $60/MWH at 6-8pm, partly due to solar generation profiles, and partly due to other demand patterns.
The duckiness of the duck curve has risen over time, across these grid regions, as utility-scale solar scaled up from 3% of US electricity in 2020 to 7% in 2025. In 2021, power pricing at 6-8pm was 30% higher than at 11am-1pm, in 2022 it was 45% higher, in 4Q23 it was +56%, in 3Q24 it was +71% higher and in 3Q25 it was 91% higher (chart below).
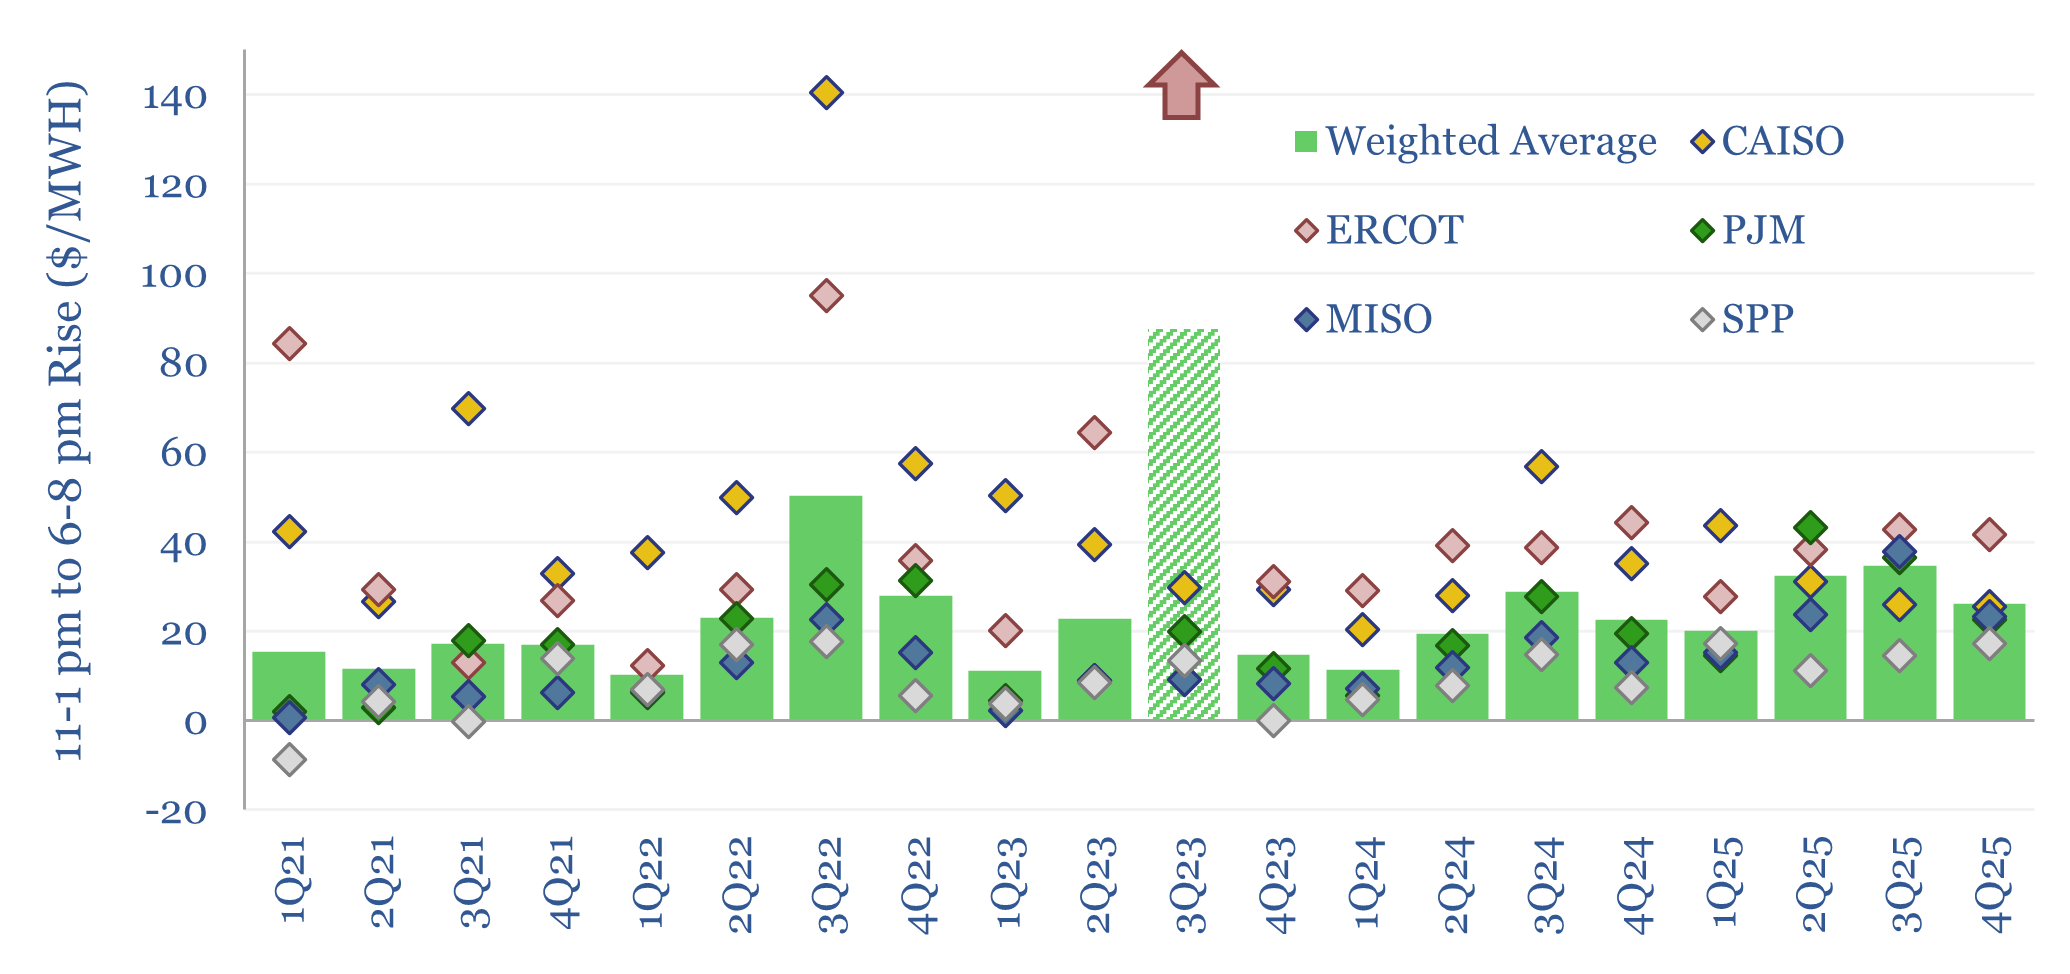
However, there is a vast amount of volatility in the data. Other cuts show a less clear increase in duckiness, as shown below, averaging across our big-five regions.
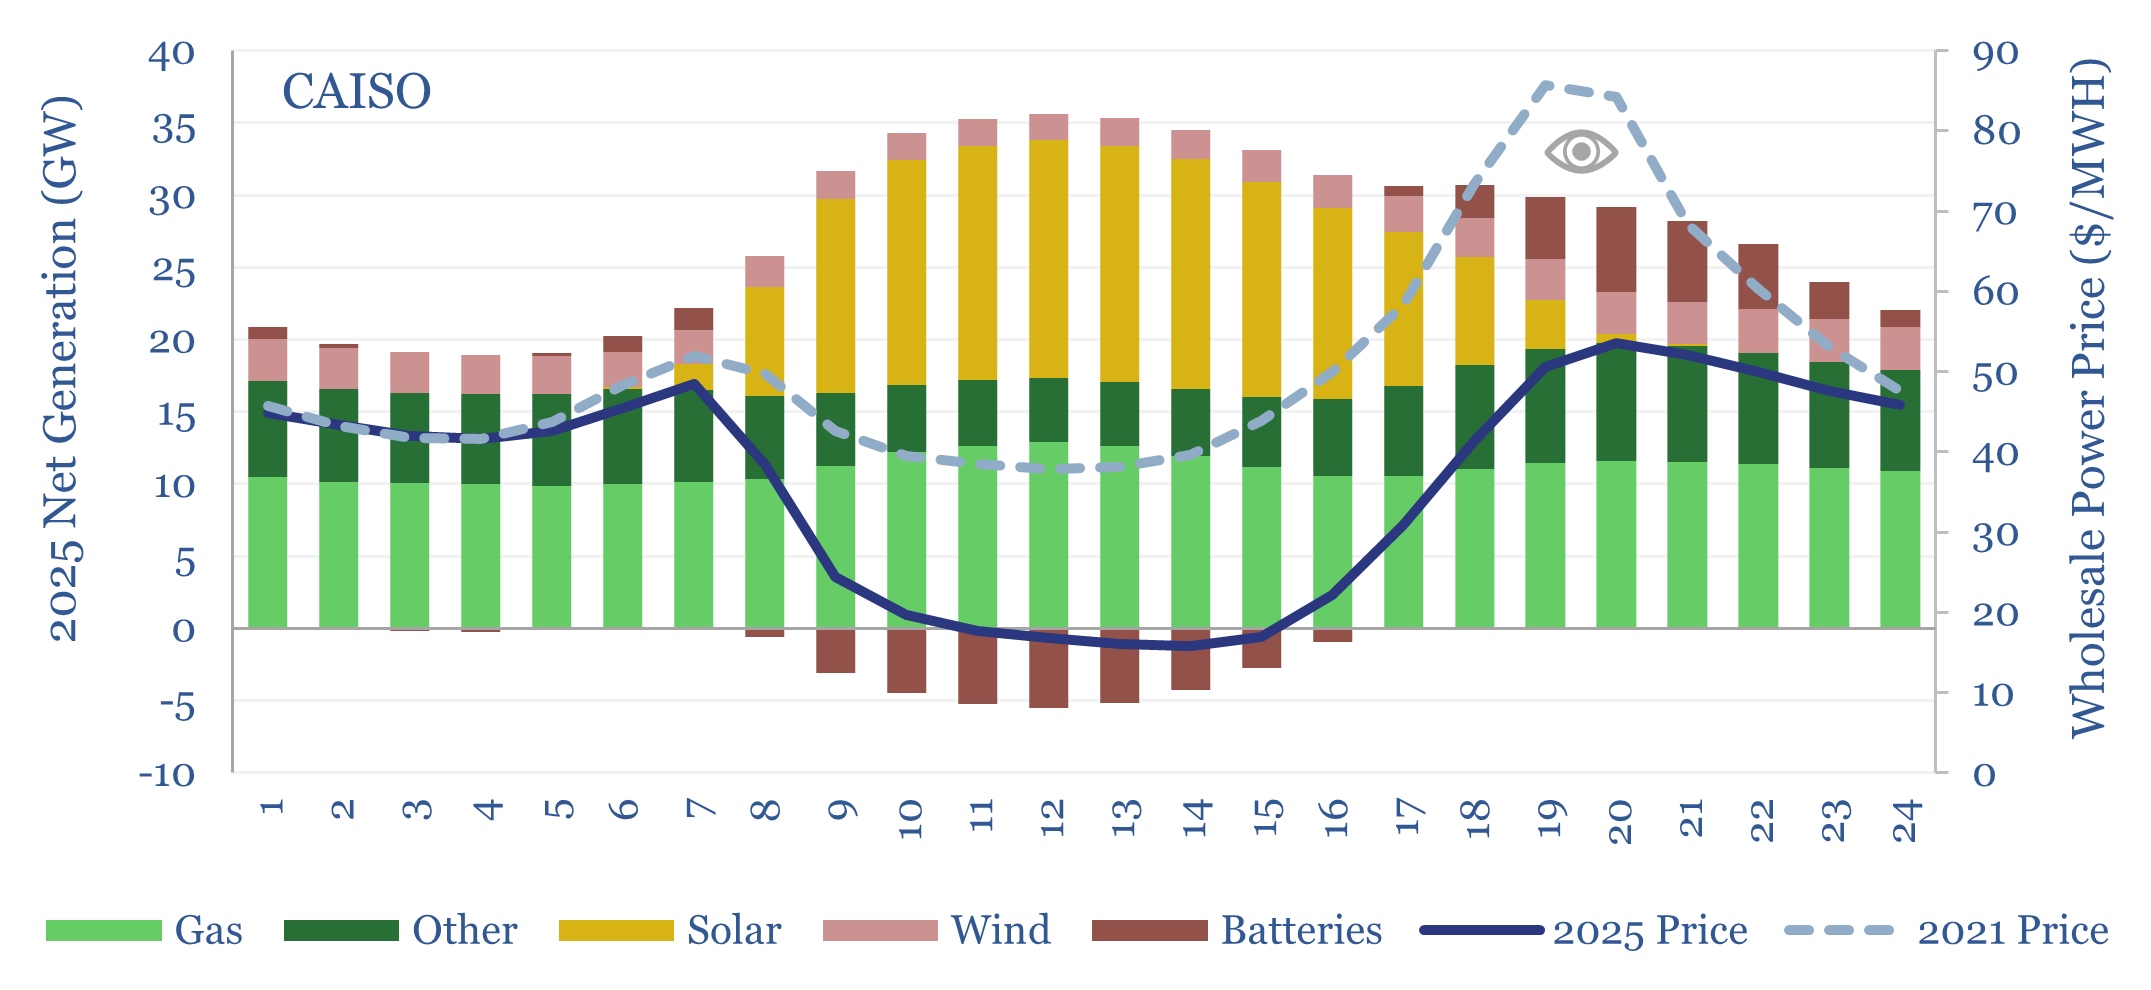
California makes for the most direct case study of duck curves. Grid-connected solar, wind and batteries comprised 26%, 10% and up to 24% of CAISO’s grid mix in 2025, respectively. Yet now the average wholesale power price available to a solar project (ex-PPA) has halved from $46/MWH in 2021 to $23/MWH in 2025. This is well below the 4-6c/kWh needed to cover the levelized cost for solar. Peak pricing for batteries, in the 6-10pm time wind, has also fallen from by a third from $75/MWH in 2021 to $50/MWH in 2025. We think $170/MWH is needed. “One day, the grid will be saturated with renewables and it will no longer be economical to build more”. We made this argument here. Maybe we are getting close in California. The answer depends on whether new flexible demand sources can time their loads to match renewables. This augurs positively for EVs, smart energy systems and flexible data centers.
We once thought power grids were growing structurally more volatile over time. However, we are now tracking grid volatility, and measuring power prices by hour by grid region, in this data-file. The answer now seems to depend on the relative base of renewables, batteries and demand-shifting technologies.