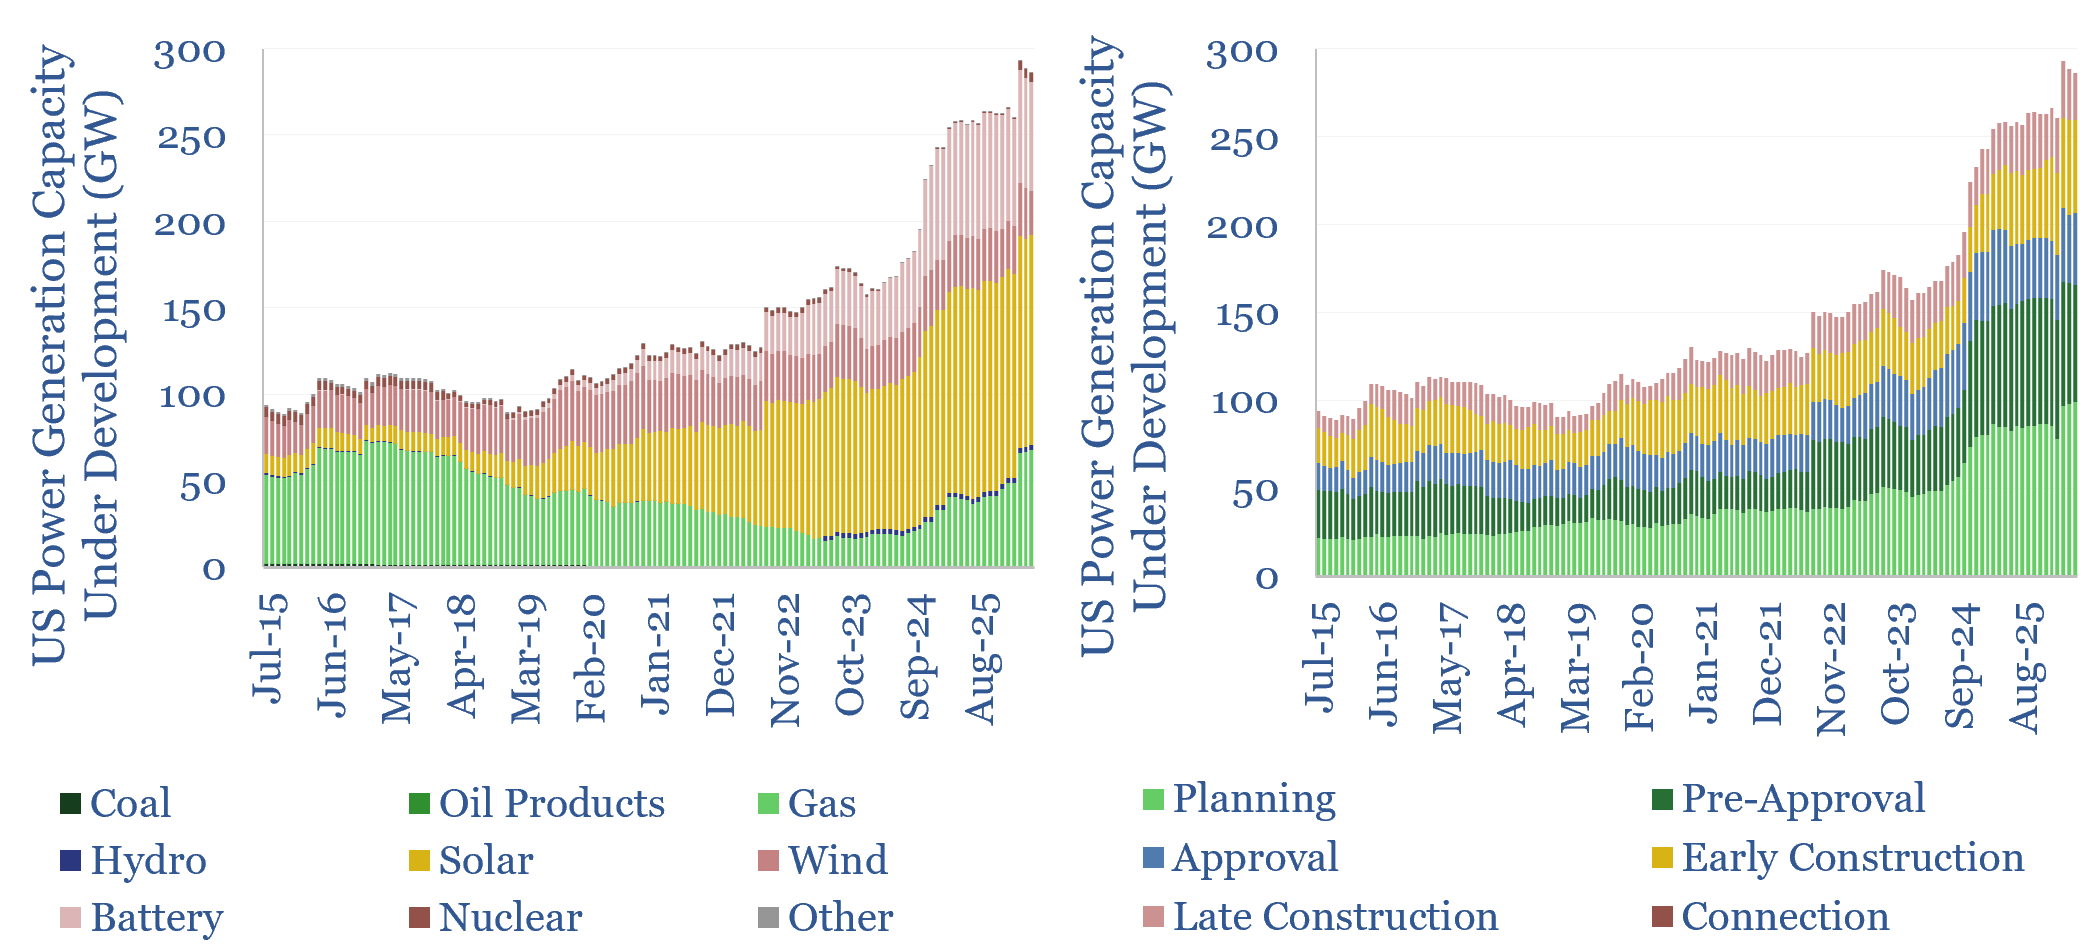
An all-time record 290GW of new power generation capacity is currently under development in the US in 1Q26, enough to expand the US’s 1.3TW power grid by over 3% per year. This data-file tracks US power generation under development, as a leading indicator for gas turbine, wind, solar and battery demand. The pipeline suggests tight power markets may start to soften in 2026-27.
This data-file captures the development pipeline of new US power capacity, based on 860M reports from the EIA, which cover all existing and proposed generating units of >1MW of greater.
As a leading indicator for wind, solar, gas turbine and battery demand, we have aggregated the data in these c120 monthly reports, from 2015 to 2025, to track the pipeline over time, and how expectations have progressed.
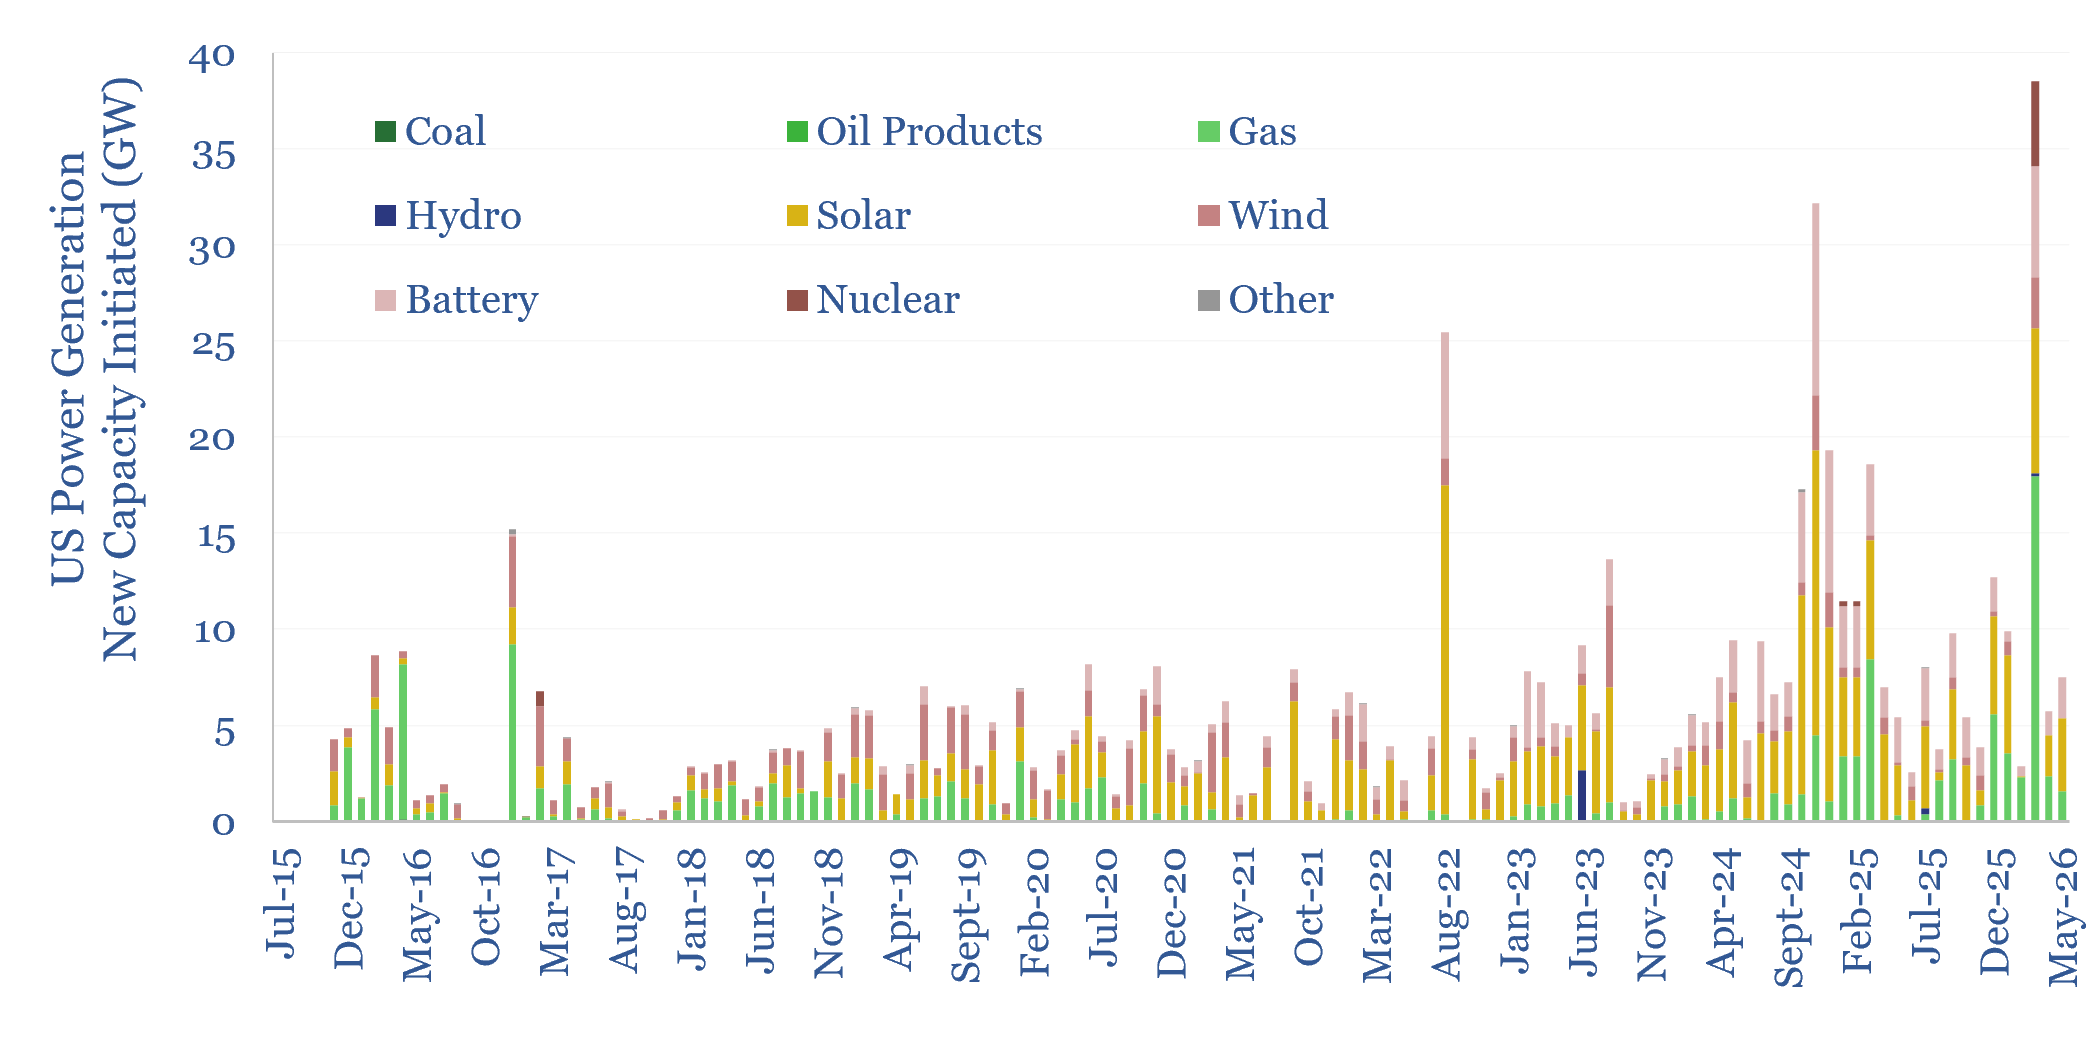
Over the past decade, an average of 4 GW of new power generation projects have been added to the queue each month. 1 GW of previously proposed projects have been abandoned each month. And another 2 GW of projects have been completed each month. Hence, the overall project queue has grown 1 GW larger per month, rising from 90 GW in September-2015 to 290GW in May-2026 (charts above).
Fears over power grid bottlenecks and rising interconnection times were certainly justified by the data in 2024 and 2025. 75% of the increase in the overall pipeline size is in projects that have not yet commenced construction and are thus effectively sitting in a queue.
However, power projects underway in the US should be capable of growing US electricity generation by 3% pa from 2026. US electricity demand, for contrast, rose +2.6% in 2025, and our forward-looking forecast is for 2% pa demand growth (although ERCOT/PJM remain key hotspots) as ultimately a large portion of proposed data centers never get built.
Hence, we could see tight power markets starting to soften in 2026-27, potentially heralding the capital cycle for gas-fired generation maturing?
Gas-fired projects in progress increased from 40GW one year ago to 67GW today, which is just below the all time record of 71GW of gas-fired projects in progress in 2016-17. Conversely, in the past year, the queue of solar projects in progress increased from 120GW to 122GW, but wind decreased from 30GW to 25GW and batteries decreased from 65GW to 63GW, all of which was due to record cancellations of prior-announced projects.
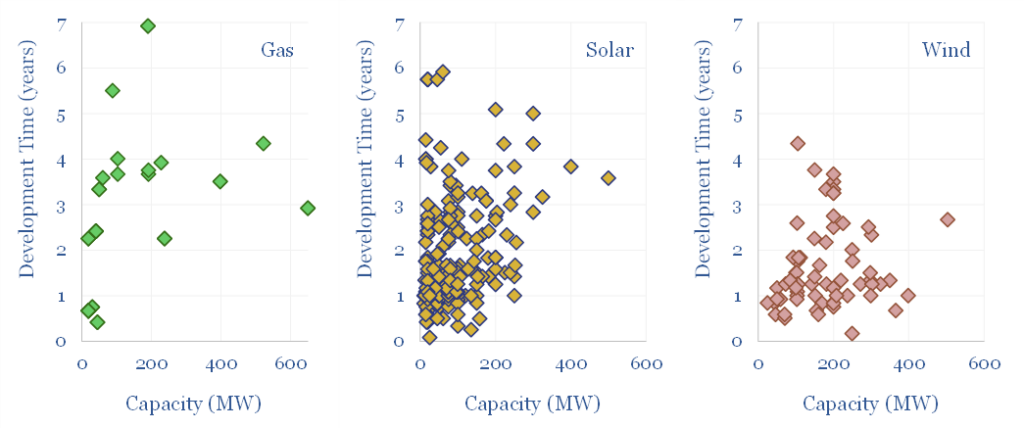
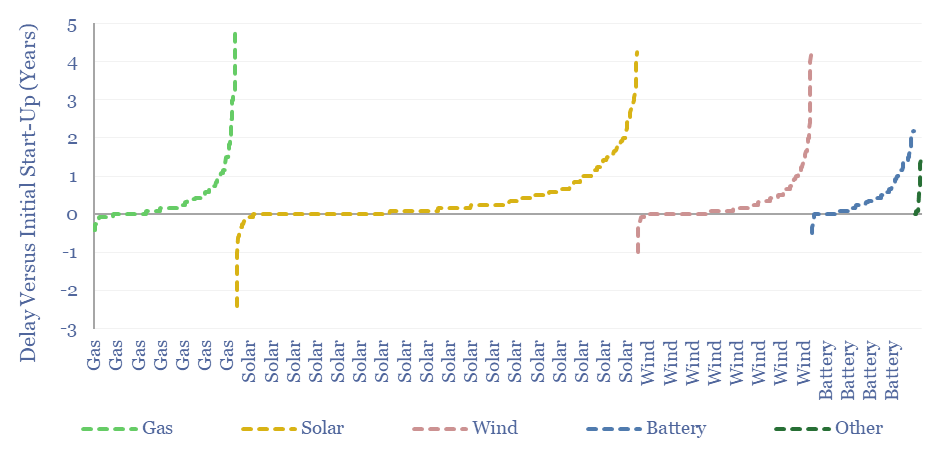
Development times have not changed materially, although they have always been quite variable. In the data-file, we have tracked 1,715 projects from the time they were first proposed, to the time when they were completed. Their average construction time was 0.8 years, with an average delay of 0.4 years versus initial estimates. These are shorter than the development times for other energy infrastructure.
Looking across the life-cycle of projects that entered the 860M reports during the planning stage (rather than later), the average development time was 2.1 years, including 0.9 years of planning, 0.3 years of permitting, 0.8 years of construction, and an average delay of 0.6 years versus initial estimates. Larger projects tend to take longer.
Delays in constructing power generation facilities are also heavily skewed, as 10% of the projects comprise 50% of the delays.
We will continue updating this data-file over time, usually every 3-6 months. If we can help you with anything bespoke, or discuss/debate the data-set then please contact us.