Global production of hydrogen is around 110MTpa in 2023, of which c30% is for ammonia, 25% is for refining, c20% for methanol and c25% for other metals and materials. This data-file estimates global hydrogen supply and demand, by use, by region, and over time, with projections through 2050.
Global production of hydrogen is 110MTpa in 2023, of which c30% is for ammonia, 25% is for refining, c20% for methanol and c25% for other metals and materials (e.g., hydrogen peroxide) (chart below).
Many commentators also see a growing role for hydrogen meeting global energy demand. Although we have been more cautious over the costs, practicalities and other competition for high-quality clean energy. Especially in a world that is substantially short of primary energy to make hydrogen through 2030.
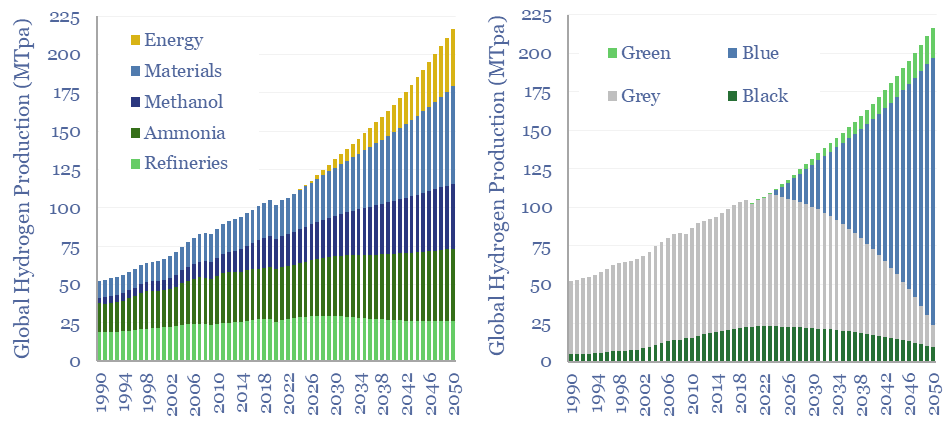
Global hydrogen production most likely emits 1.3GTpa of CO2 today, with an average CO2 intensity of 12 tons/ton, comprising 85MTpa of grey hydrogen emitting 9 tons/ton of CO2 and 25MTpa of black hydrogen emitting 25 tons/ton of CO2.
The purpose of this global hydrogen supply model is to project out global hydrogen supply demand through 2050, as a function of our outlooks for refineries, basic chemicals, other metals and materials, energy and global decarbonization.
From this, we can calculate how much disruption lies ahead for the industrial gases industry? For blue hydrogen (or turquoise hydrogen), what volume of input natural gas is required in bcfd, and how much CO2 must be disposed of by the midstream industry?
For green hydrogen, how much electricity will be used to produce green hydrogen, and other e-fuels, by region, and over time?
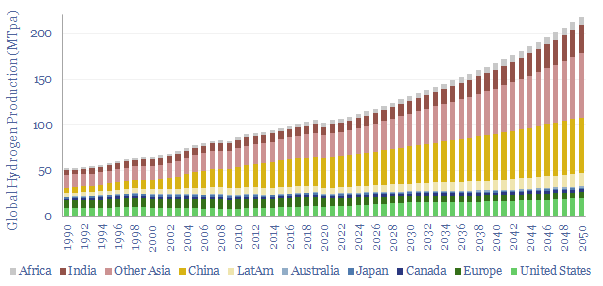
To build up our forecasts, the data-file captures hydrogen production by region in the US, Europe, Canada, Japan, Australia, LatAm, China, India, Other Asia and Africa. All estimated from 1990 to 2050.
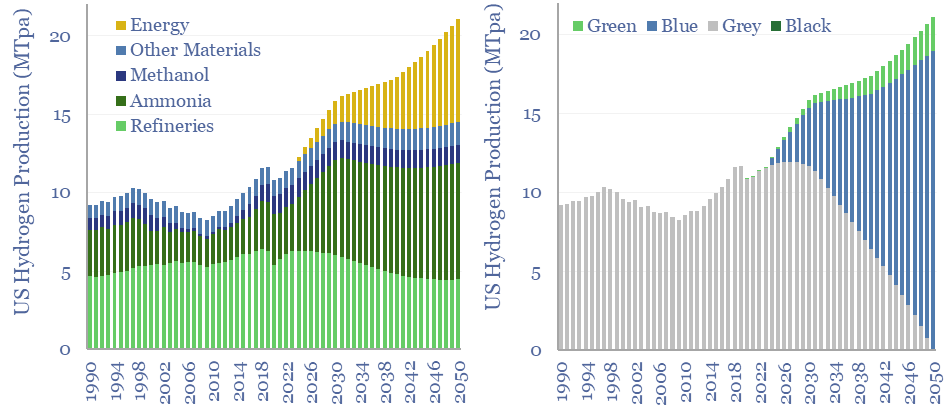
The outlook is uncertain which means it can be useful to compare different scenarios, via a model. Assumptions in this data-file can be stress-tested by adjusting the cells marked in yellow. Including the share of black, grey, blue and green hydrogen in the future energy mix, by region.