
This data-file aggregates significant US power grid disruptions, based on data from the DOE. On average, there are 250 power cuts per year in the United States, lasting for a median average of 5-hours, and affecting a median average of 80,000 customers. 20% of the power cuts last longer than 1-day. 15% affect more than 1M customers. Power cuts are becoming more prevalent in some regions through 2024.
Power grids are a wonder of the modern world, and crucial enabler of the energy transition. But how reliable are power grids? To answer this question, we aggregated data into 3,000 significant power disruptions, from the US Department of Energy, and then subsequently, from the Eagle-I tool.
How frequent are power cuts? The United States incurs an average of 250 power cuts per year, each impacting an average of 80,000 customers, for an average of 5-hours. Note that a “customer” can range from a studio apartment to a 400-bed hospital, but our guess from the data is that c20% of the US population endures a serious power cut each year.
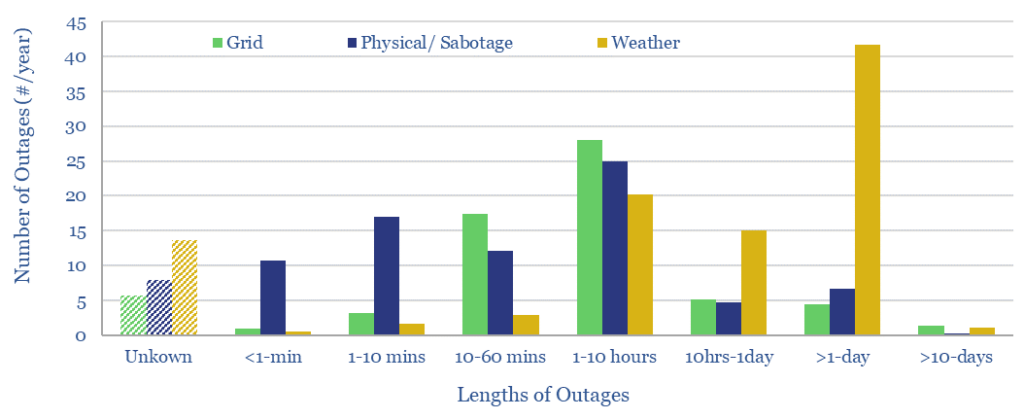
What are the causes of power cuts? Over the past decade, 40% of US power cuts can primarily be attributed to weather events, such as storms or heatwaves, 35% can be attributed to physical incidents, vandalism or sabotage, and 25% can be attributed to failure of grid infrastructure itself.

Different outages have different characteristics. The median sabotage event impacts 2,000 customers and is remedied within 1-hour. The median average grid failure impacts 20,000 customers and is remedied within 2-hours. The median average weather issue impacts 90,000 customers and is remedied within 1-day.
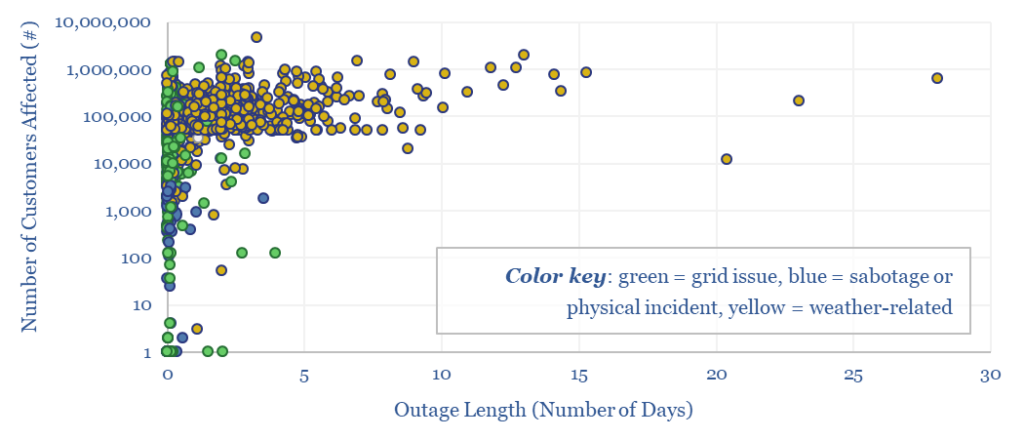
The worst power cuts can occur in the aftermath of major weather events such as hurricanes, leaving “millions” of customers without power for 5-30 days. The database contains 27 power cuts (i.e., >2 per year) that impact more than 1M customers, and 97 that last longer than 5-days (i.e., 8 per year). The impacts of such power cuts have been poignantly dramatized in Apple TV’s recent series Five Days at Memorial.
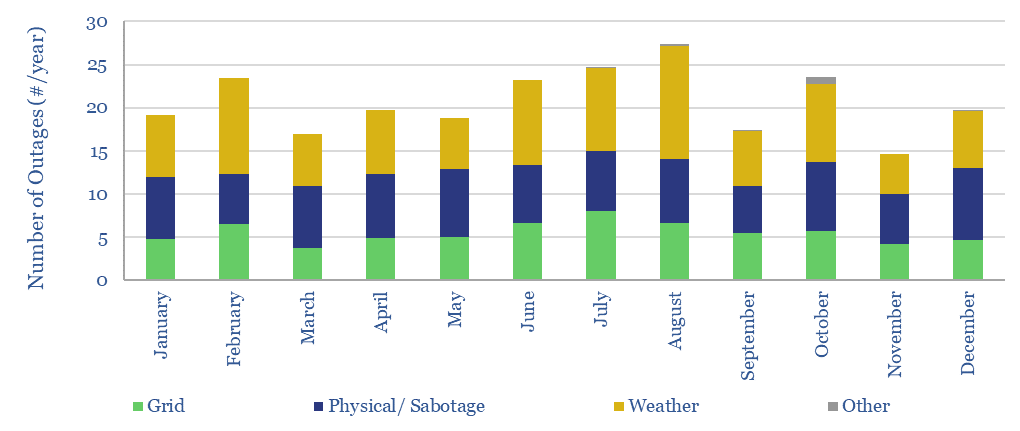
Seasonality also contributes. There are 30% more disruptions than average in August, which is prone to heatwaves and hurricanes, and 13% more than average in February, which is prone to winter storms. Conversely, there are 30% fewer disruptions than average in November, amidst mild autumn weather.
Are US power cuts becoming increasingly prevalent? The DOE’s power grid disruption database saw a trough of 141 incidents in 2016, rising to a new peak of 390 incidents in 2022. 2022 was a year with fewer weather-related disruptions than average.
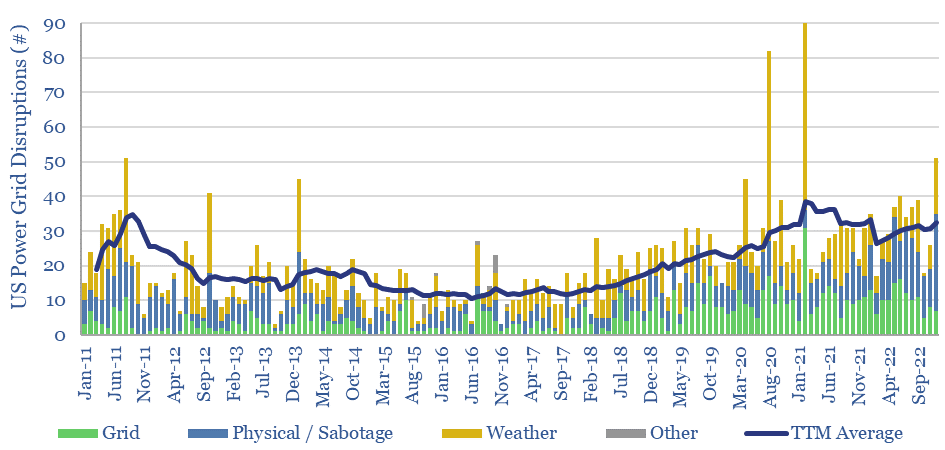
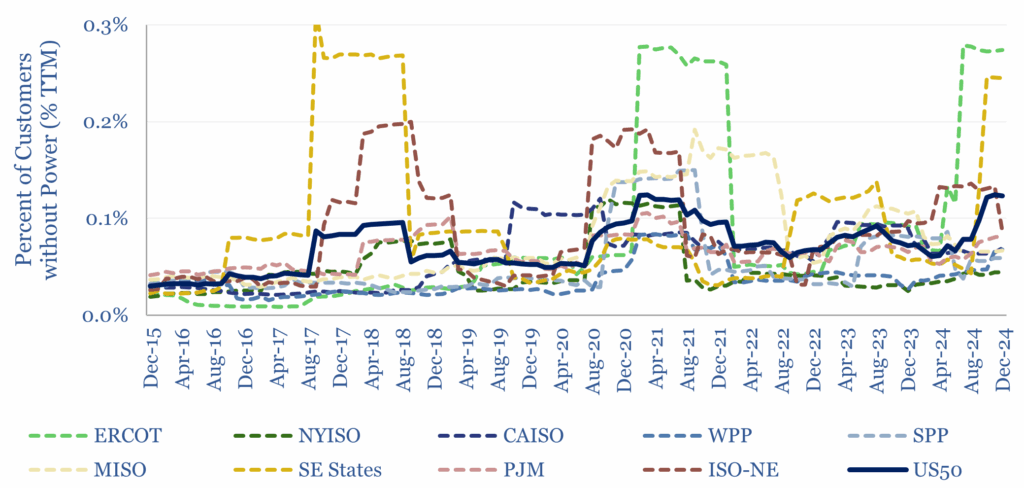
The DOE changed the way it reports outages after 2022, handing over power disruption tracking to PNNL, which has not issued an update since. However, the Eagle-I tool tracks the number of customers without power, at five-minute intervals, by State, which we have aggregated in the second data-file linked here and charted below 0.08% of customer-hours have gone unserved since 2014 overall. There is a 40% R-squared between year and outage rate.
What is causing the uptick in power grid disruptions? Grid disruptions attributed to the grid itself (i.e., not directly caused by weather or physical incidents) increased from 36 incidents per year in 2012-17 through to 125 per year in 2020-22. The increases were most severe in ERCOT and WPP. There is not much evidence that the uptick is caused by AI.
This all still suggests increasing investment is needed in power grid infrastructure. In 2022-23, we started writing about the implications for transmission utilities and companies constructing power transmission. We also see increasing demand for behind-the-meter gas generation, batteries, diesel generators, smart energy systems and power electronics technologies.