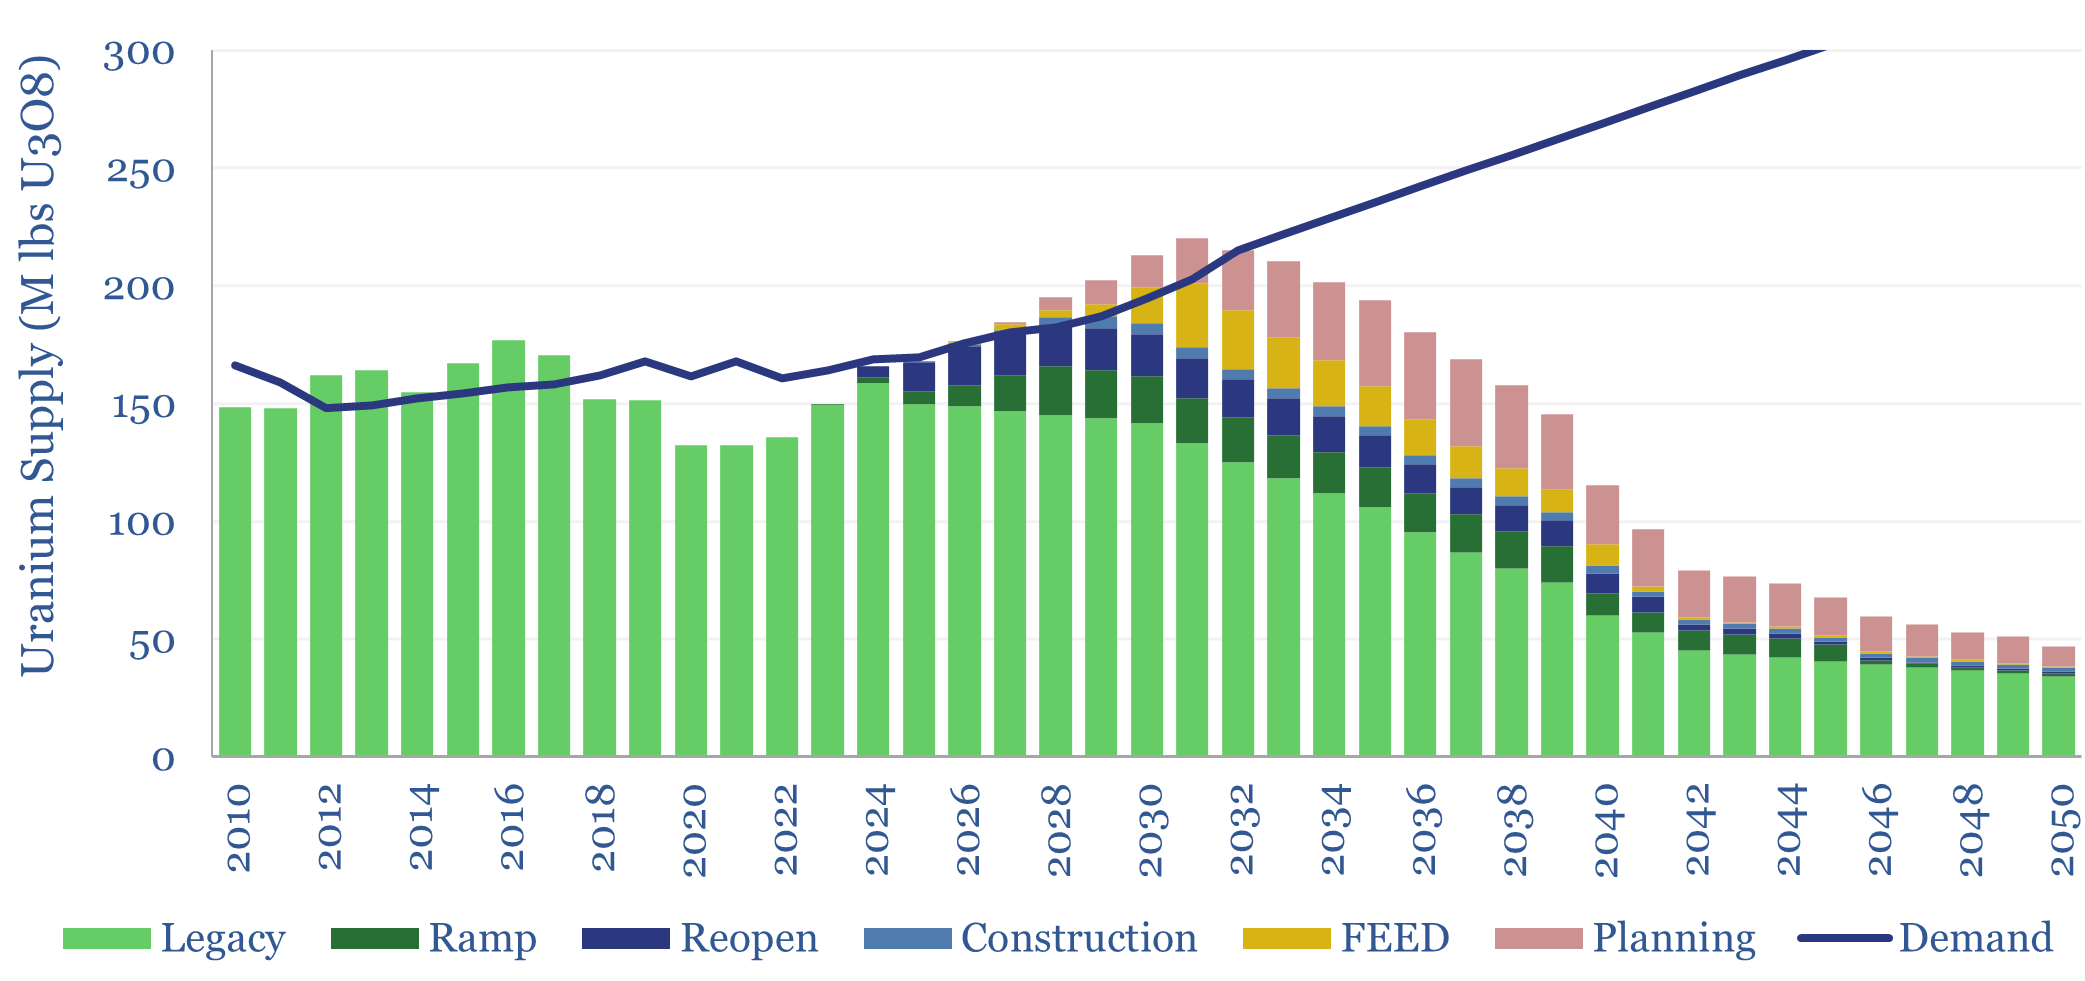
Our global uranium supply-demand model sees the market adequately supplied in 2026-30, even as demand ramps from 170M lbs pa to 210M lbs pa in 2030. However, our project risking is generous and there may be supply disruptions. What implications for broader power markets, decarbonization ambitions, and uranium prices?
The world’s nuclear fleet generated 2,820 TWH of electricity in 2024, consuming 170 M lbs of mined uranium (on a U3O8 yellow-cake basis). We see these numbers rising to 3,250 TWH pa of electricity and 210 M lbs pa of uranium by 2030, then to 5,600 TWH pa and 340 M lbs by 2050 as part of our global electricity models.
But can uranium production keep up? Global uranium production was only 166 M lbs in 2024, as nuclear utilities were over-contracted in 2012-2017, and have been drawing down inventories for the past five years. Of course, inventory draws cannot continue forever.
This uranium supply-demand model sees the market being adequately supplied, in aggregate through 2030, perhaps even 7-10% over-supplied, based on a classic capital cycle, as the recent trebling of uranium prices is helping to accelerate uranium mining projects.
Our uranium supply forecasts are based on evaluating around 100 production assets and developments, generating an outlook for each one.
Assumptions include a typical decline rate of 3% pa, 80% risking on new assets re-opening and developments that are underway, 60% risking on FEED-stage projects and 30% risking on planning-stage projects, on average throughout the model.
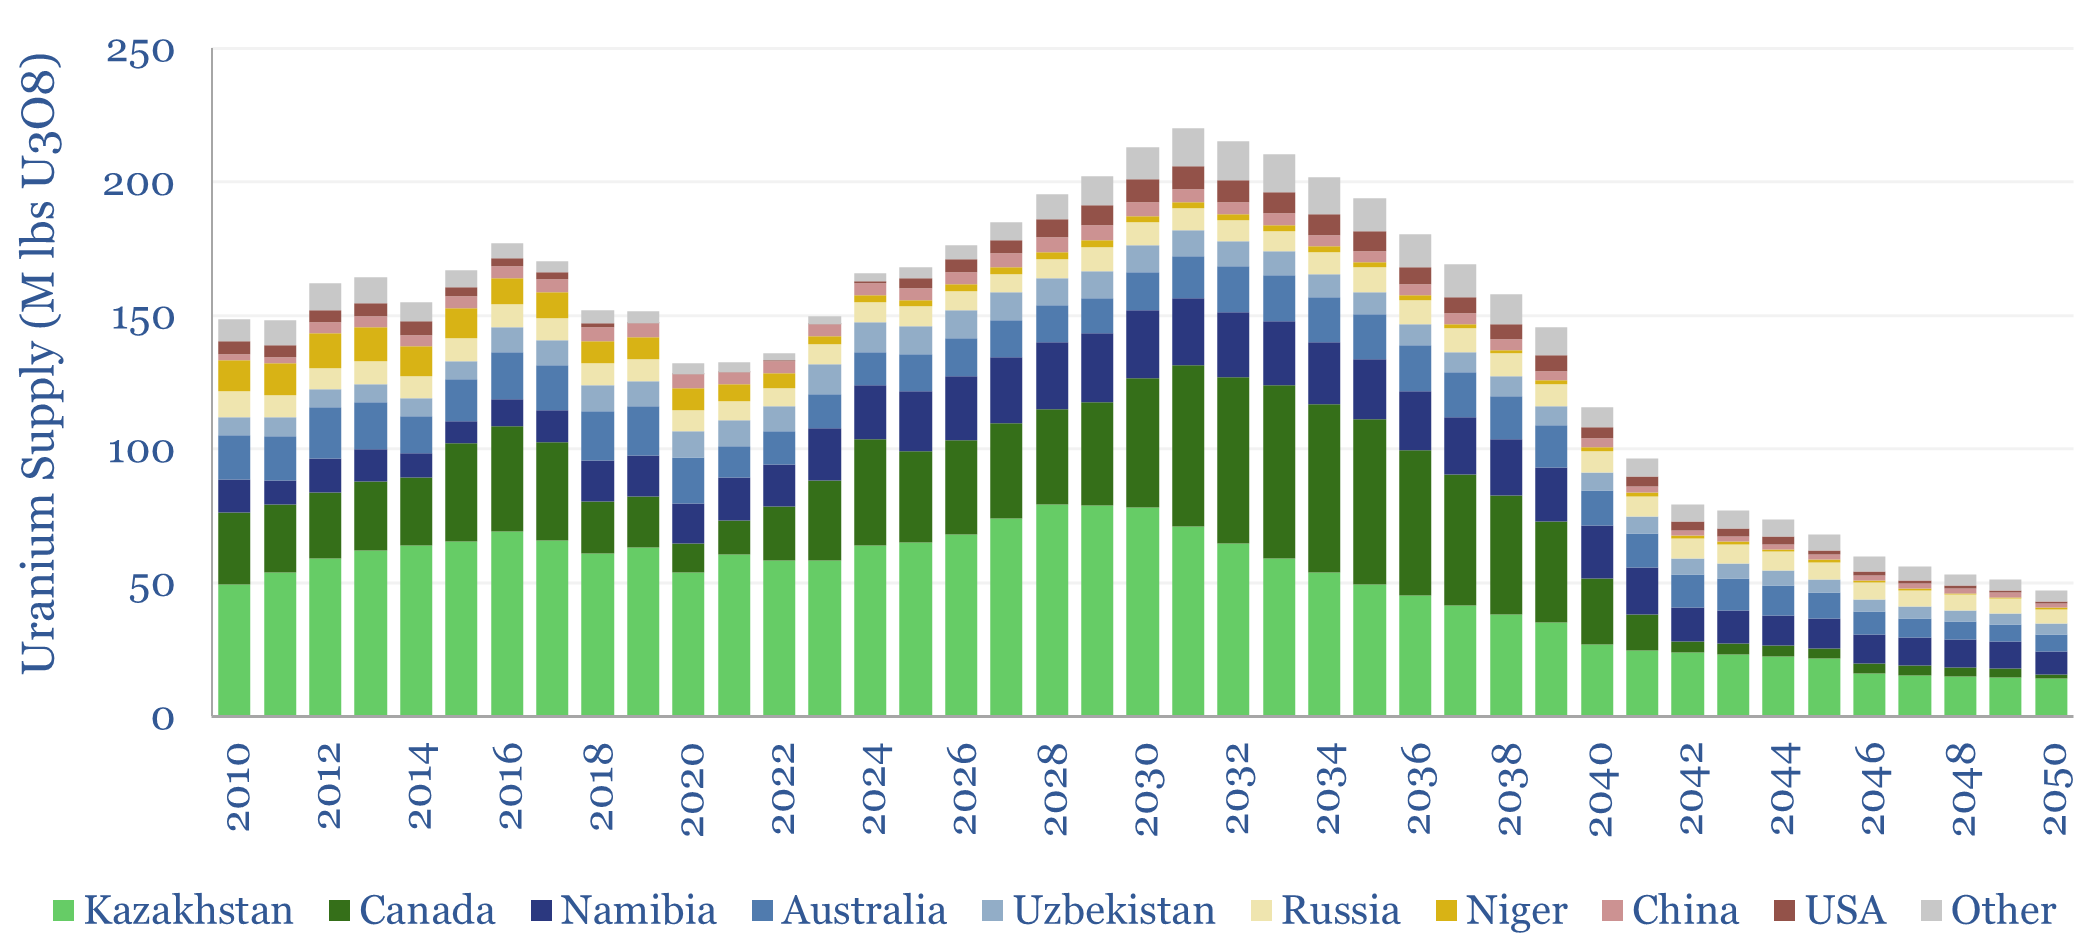
Uranium production by country is also disaggregated in the data-file. 40% of global output is from Kazakhstan today, which also surprised to the upside in 2024 in order to meet market demand that was not being met elsewhere.
Canada, which is 20% of today’s supply, doubles its output in the next decade. Growth is also seen in Namibia and Australia, which are about 10% of today’s output. The US grows most in percentage terms, rising from almost nil to almost 10 M lbs pa in the next decade.
Uranium market deficits were seen averaging 5% from 2025-30 in our outlook last year. There were further project delays in 2026, impacting 20 out of 75 projects in the pipeline. For example, the giant 30M lbs pa Rook I project in Canada is now guiding for an FID in 2026, which pushes the start-up back to 2029/30. This is reminiscent of LNG, where 27 of 70 projects were delayed in 2024.
Demand, however, is coming in much weaker than expected in 2020-2024, including steep downgrades to our forecasts for the world’s operating global nuclear capacity, including due to slow progress de-risking SMRs into actual projects, softening net zero ambitions, slower load growth more generally, and more competition from gas/solar.
Uranium production by company is available in our screen of uranium producers, which also has more commentary on the underlying companies developing various projects.
Notes on each project in our global uranium supply-demand model can be viewed in the notes tab, and risking factors can be varied in the assets tab of the data-file.