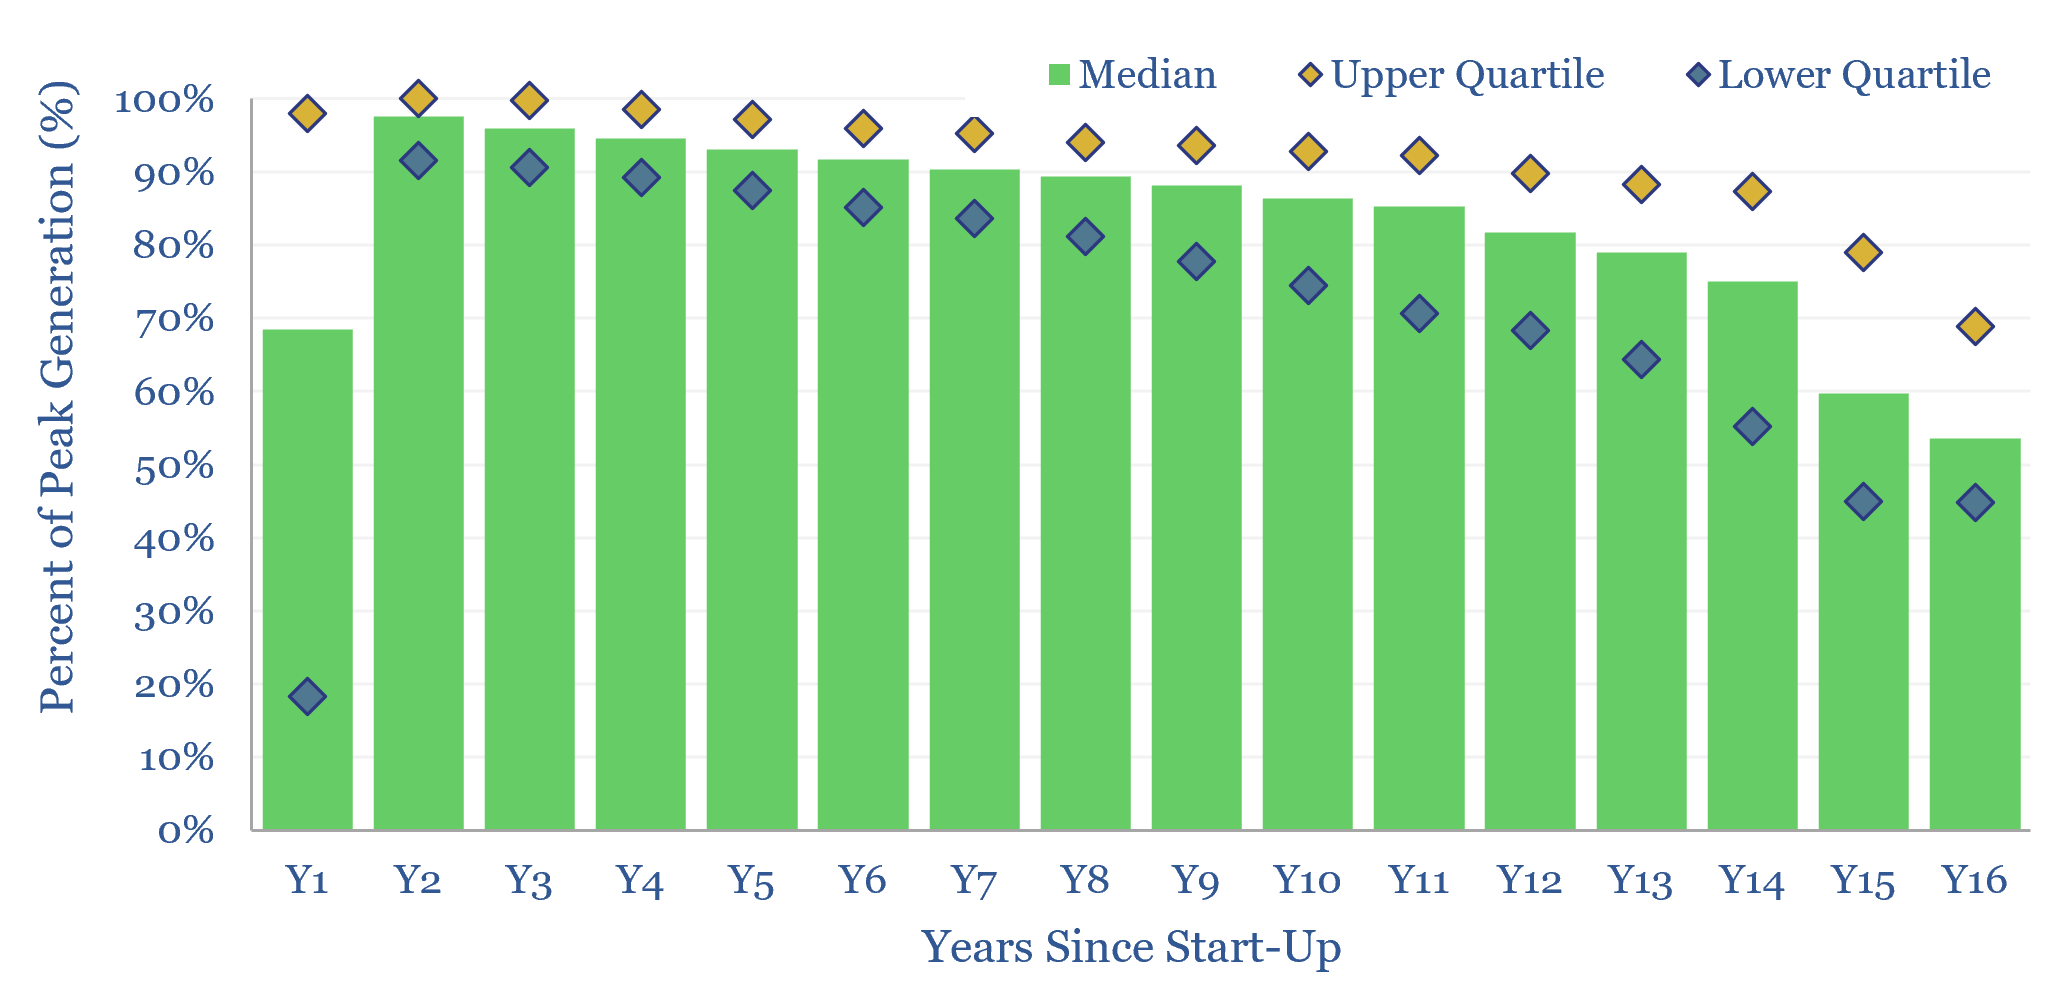
This data-file tabulates the ‘decline rates’ of 6,600 US solar power plants, going back to 2001. Solar power decline rates average -1.5% up to year 12, after which decline rates increase. This matters for the economics of solar projects.
This data-file aggregates US solar generation by facility, across 6,600 solar projects to-date, going back 25-years. It is based on publicly available generation data from the EIA, which simply requires a couple of days of aggregation, cleaning and analysis.
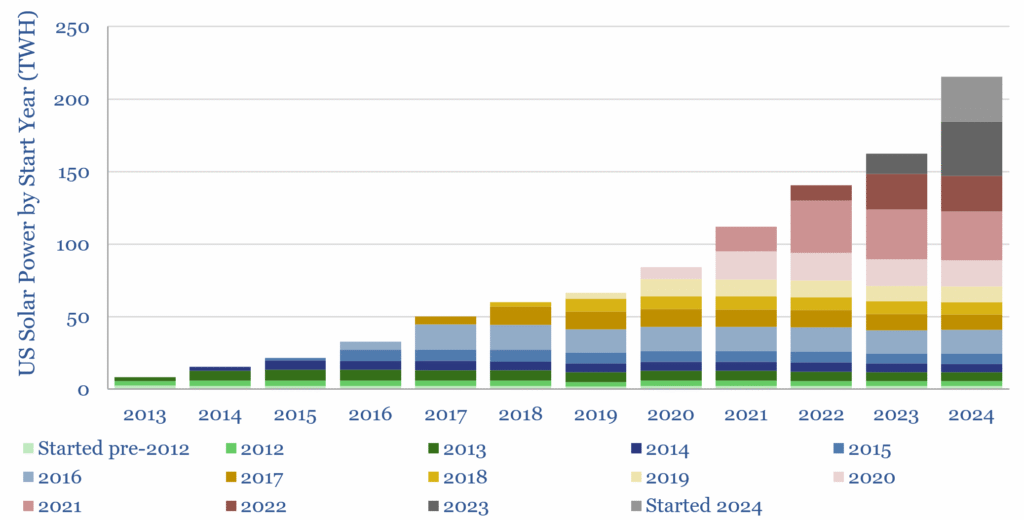
Across the entire data-set, we find solar assets take one year to ramp up. Generation peaks in year 2. It then declines smoothly at 1.5% per year up to year 12, then accelerating. The median solar project in the data retains c60% of its peak production capacity after 16 years have passed.
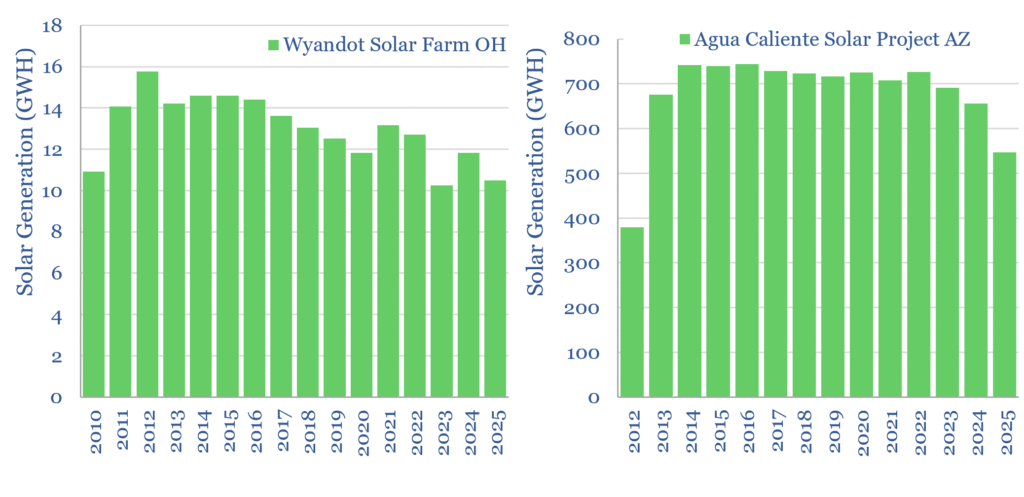
However, the data are highly variable, as shown by the examples plotted below. Volatility does matter for the costs of integrating renewables, the ultimate share of renewables and the effective CO2 abatement costs of renewables.
Decline rates matter for the economics of solar power. Decline rates also matter for the ultimate share of solar in the future energy mix, as our forecasts see solar ramping up by over 10x to supply 37,000 TWh pa of useful energy by 2050. However, a 1-4% decline rate would mean that 300-1,200GW pa of new solar additions would be required simply to offset the decline of previously installed facilities.
The ‘Conclusions’ tab explores the consequences. US solar generation profiles are not dissimilar from well-managed oil and gas fields; some projects may suffer lower IRRs versus forecasts if they have not factored in declines; and declines become more material over time, slowing the ascent of solar’s share in the power mix.