Human civilization will consume 80,000 TWH of useful energy in 2023. This is equivalent to a kitchen toaster, running 24 hours per day, 365 days per year, for every man, woman and child on the planet. 35% of global energy is used in manufacturing and materials, 30% is used in transportation and shipping, 20% is used in homes as heat and electricity, and 15% is used in providing commercial services. Our industry research and energy demand research focuses upon opportunities to drive the energy transition. This includes improving efficiency, lowering CO2 intensity, greater digitization, and supply chains for crucial metals and materials.
Demand
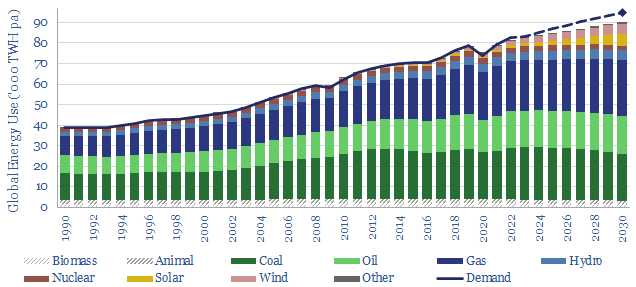
Global energy: supply-demand model?
This global energy supply-demand model combines our supply outlooks for coal, oil, gas, LNG, wind and solar, nuclear and hydro, into a build-up of useful global energy balances in 2022-30. We fear chronic under-supply. This is masked by economic weakness in 2023, rises to 3% shortages in 2025, and 5% shortages in 2030. Numbers can be stress-tested in the model.
Download
Download
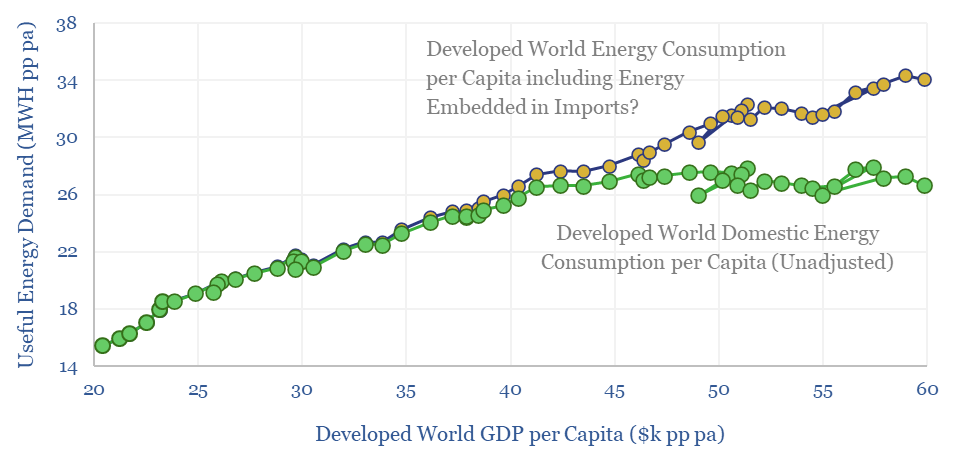
Global energy demand: false ceiling?
Wealthier countries’ energy use has historically slowed, then plateaued after reaching $40k of GDP per capita. Could this effect cause global energy demand to disappoint? This 15-page report argues it is unlikely. Adjust for the energy intensity of manufacturing and imports, and energy use continues rising with incomes.
Download
Download
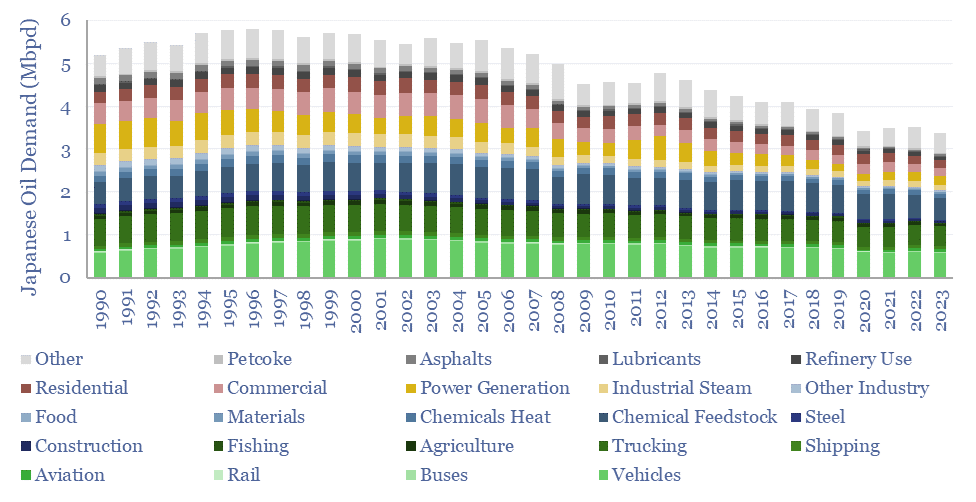
Japan oil demand: breakdown over time?
Japan’s oil demand peaked at 5.8Mbpd in 1996, and has since declined at -2.0% per year to 3.4Mbpd in 2023. To some, this trajectory may be a harbinger of events to come in broader global oil markets? While to others, Japan has unique features that do not generalize globally? Hence this report and data-file...
Download
Download
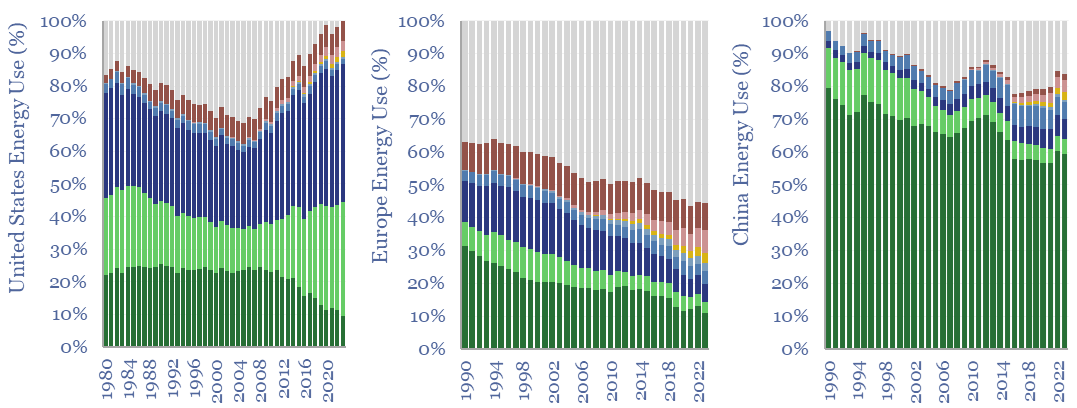
Energy security: right to self-determine?
The average major economy produces 70% of its own energy and imports the other 30%. This 12-page note explores energy self-sufficiency by country. We draw three key conclusions: into US isolationism; Europe’s survival; and the pace of EV adoption, both in China and in LNG-importing nations.
Download
Download
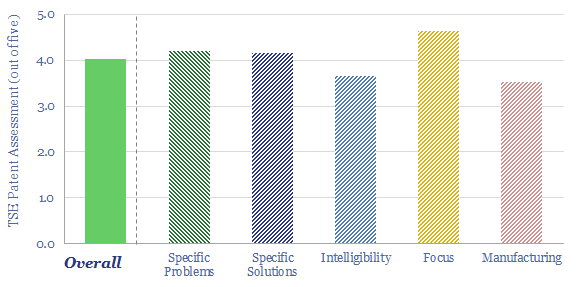
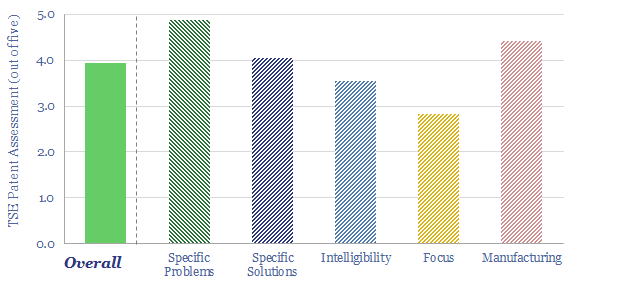
Mainspring Energy: linear generator breakthrough?
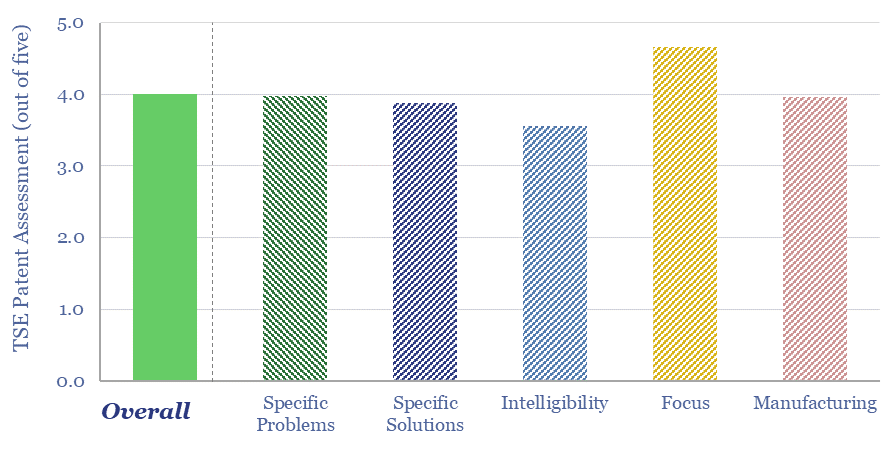
Linear generator technology can convert any gaseous fuel into electricity, with c45% electrical efficiency, and >80% efficiency in CHP mode. This data-file reviews Mainspring Energy's patents. We conclude that the company has locked up the IP for piston-seal assemblies in a linear generator with air bearings, but longevity/maintenance could be a key challenge to explore.
Download
Download
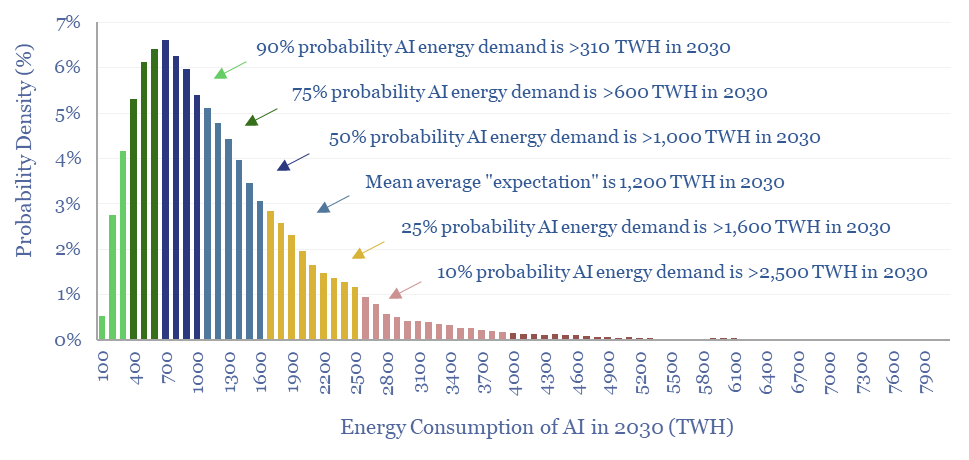
Energy intensity of AI: chomping at the bit?
Rising energy demands of AI are now the biggest uncertainty in all of global energy. To understand why, this 17-page note is an overview of AI computing from first principles, across transistors, DRAM, GPUs and deep learning. GPU efficiency will inevitably increase, but compute increases faster. AI most likely uses 300-2,500 TWH in 2030, with a base case of 1,000 TWH.
Download
Download
Industrial cooling: chillers and evaporators?
This data-file captures the costs of industrial cooling, especially liquid cooling using commercial HVAC equipment, across heat-exchangers, cooling tower evaporators and chillers. Our base case is that removing 100MW-th of heat has capex costs of $1,000/ton, equivalent to c$300/kW-th, expending 0.12 kWh-e of electricity per kWh-th, with a total cost of 7 c/ton-hour.
Download
Download
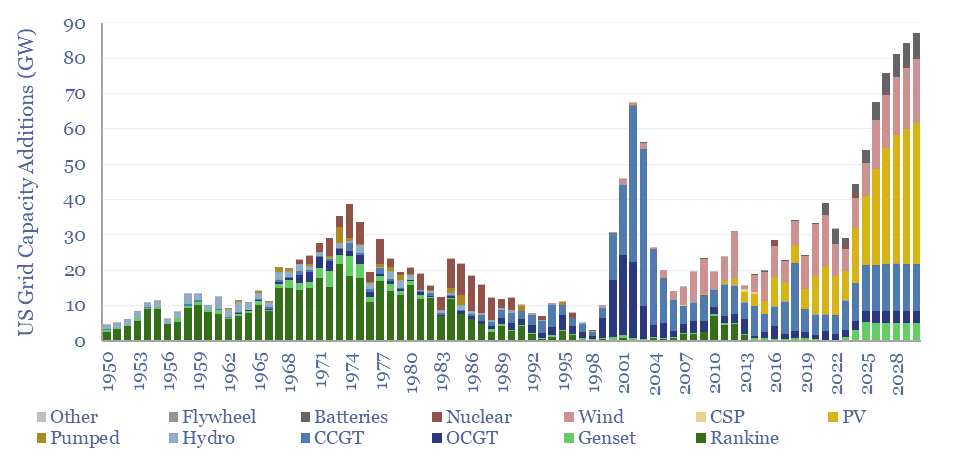
Energy and AI: the power and the glory?
The power demands of AI will contribute to the largest growth of new generation capacity in history. This 18-page note evaluates the power implications of AI data-centers. Reliability is crucial. Gas demand grows. Annual sales of CCGTs and back-up gensets in the US both rise by 2.5x? This is our most detailed AI report to date.
Download
Download
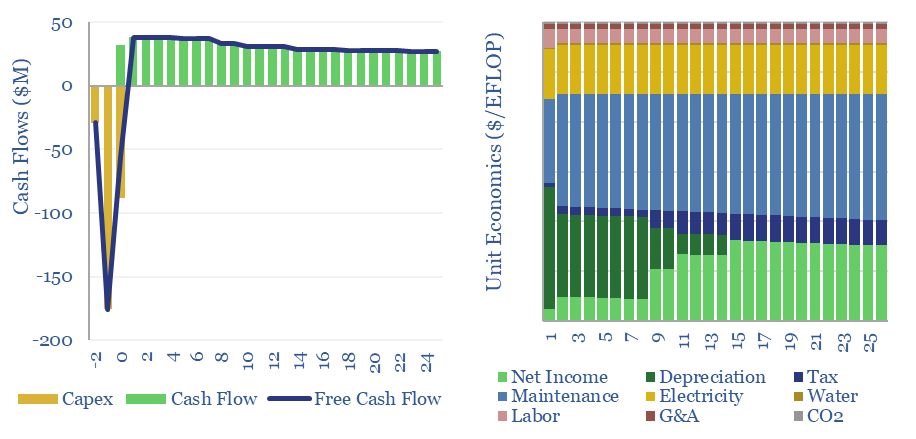
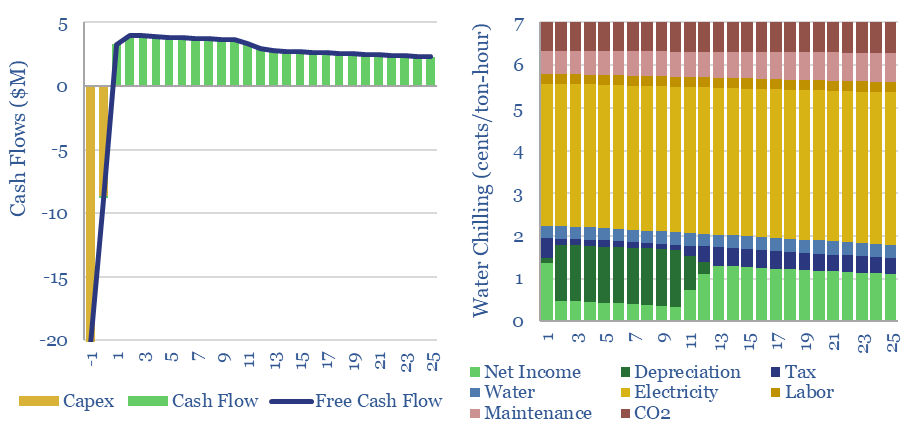
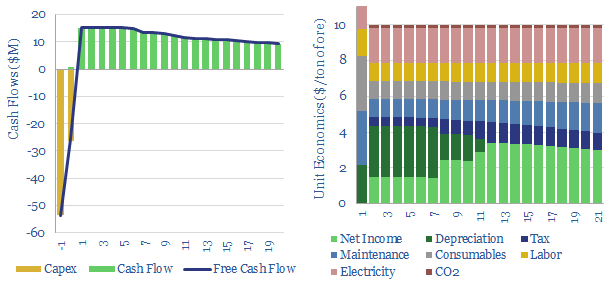
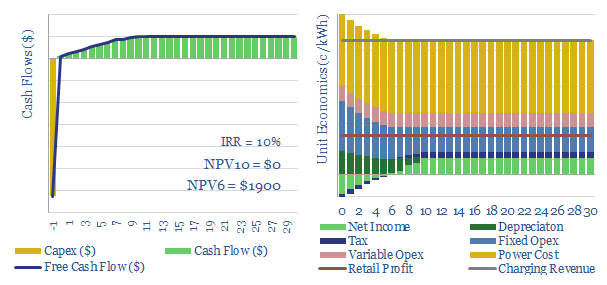
Data-centers: the economics?
The capex costs of data centers are typically $10M/MW, with opex costs dominated by maintenance (c40%), electricity (c15-25%), labor, water, G&A and other. A 30MW data-center must generate $100M of revenues for a 10% IRR, while an AI data center in 2024 may need to charge $3M/EFLOP of compute.
Download
Download
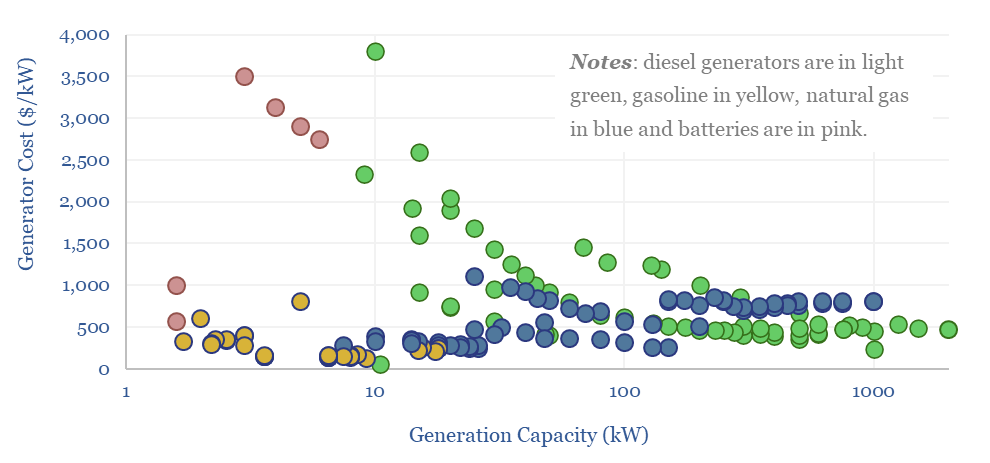
Generac: power generation products?
Generac is a US-specialist in residential- and commercial-scale power generation solutions, founded in 1959, headquartered in Wisconsin, with 8,800 employees and $7bn of market cap. What outlook amidst power grid bottlenecks? To answer this question, we have tabulated data on 250 Generac products.
Download
Download
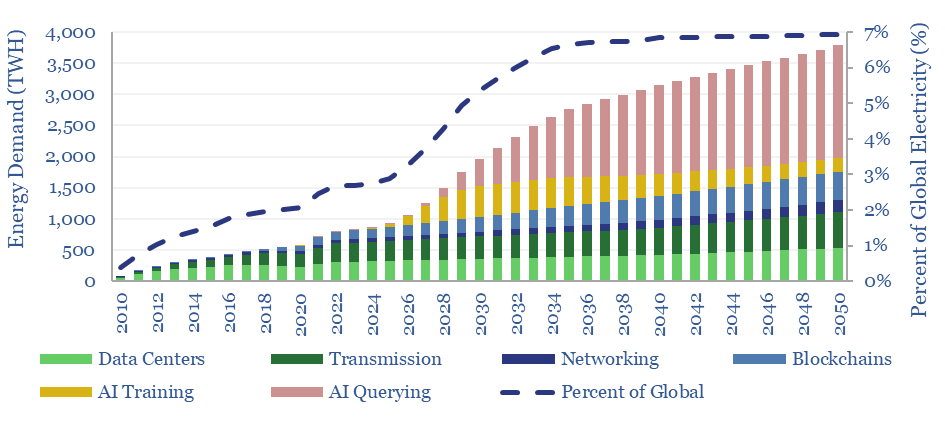
Internet energy consumption: data, models, forecasts?
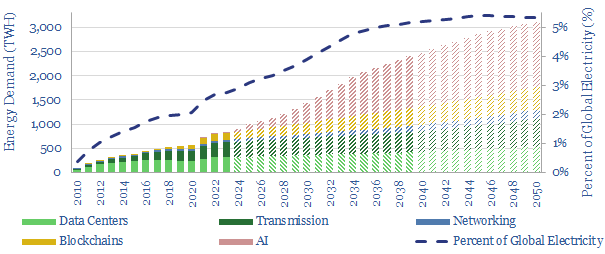
This data-file forecasts the energy consumption of the internet, rising from 800 TWH in 2022 to 2,000 TWH in 2030 and 3,750 TWH by 2050. The main driver is the energy consumption of AI, plus blockchains, rising traffic, and offset by rising efficiency. Input assumptions to the model can be flexed. Underlying data are from technical papers.
Download
Download
Global energy demand: nervous breakdown?
We have attempted a detailed breakdown of global energy demand across 50 categories, to identify emerging opportunities in the energy transition, and suggesting upside to energy demand forecasts? This 12-page note sets out our conclusions and is intended a useful reference.
Download
Download
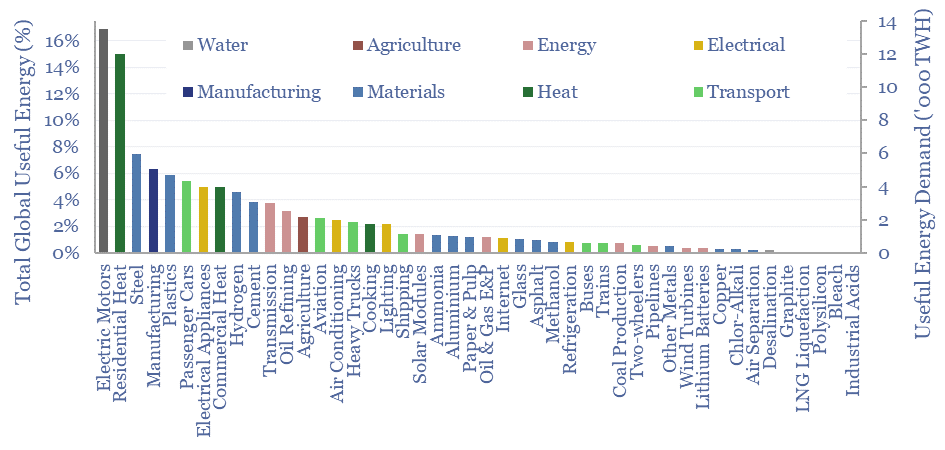
Global energy demand by end use?
This data-file is a breakdown of global energy demand by end use, drawing across our entire research library, to disaggregate the global energy system across almost 50 applications, across transportation, heat, electricity, materials and manufacturing. Numbers, calculations, efficiencies and heating temperatures are in the data-file.
Download
Download
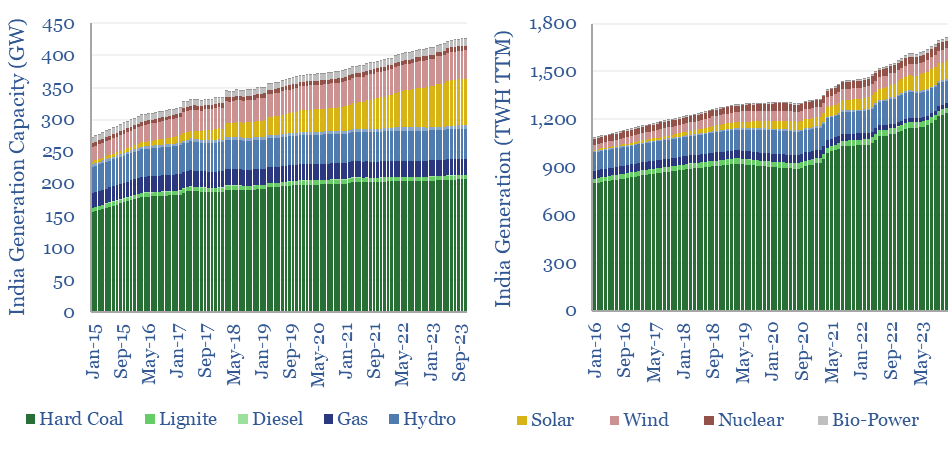
India: electricity demand and power grid over time?
India's electricity demand is growing by 6-8% (+100-140 TWH) per year, but 75% of the total still comes from coal, which has itself grown at a 5% CAGR over the past half-decade. Wind and solar would need to grow 4x faster than 2023 levels for thermal generation just to flatline. What implications and opportunities for global energy markets?
Download
Download
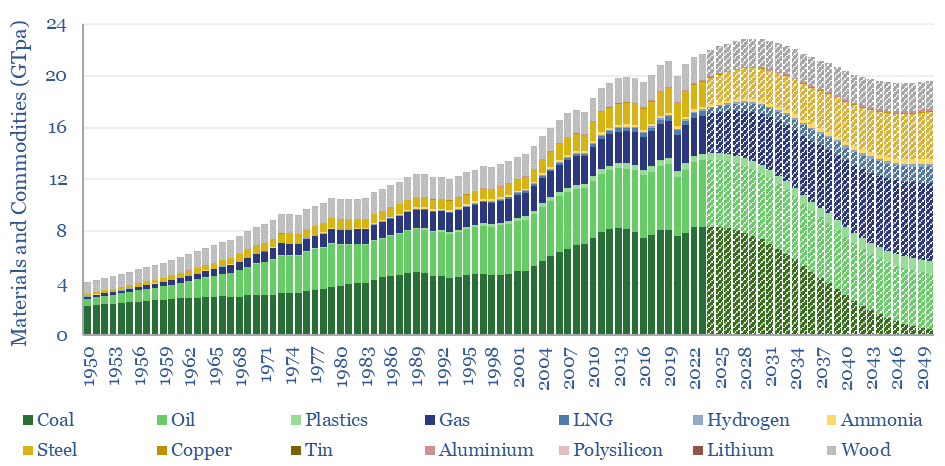
Peak commodities: everything, everywhere, all at once?
This 15-page note evaluates 10 commodity disruptions since the Stone Age. Peak demand for commodities is just possible, in total tonnage terms, as part of the energy transition. But it is historically unprecedented. And our plateau in tonnage terms is a doubling in value terms, a kingmaker for gas, plastics and materials. Outlooks for 30 major commodities are reviewed.
Download
Download
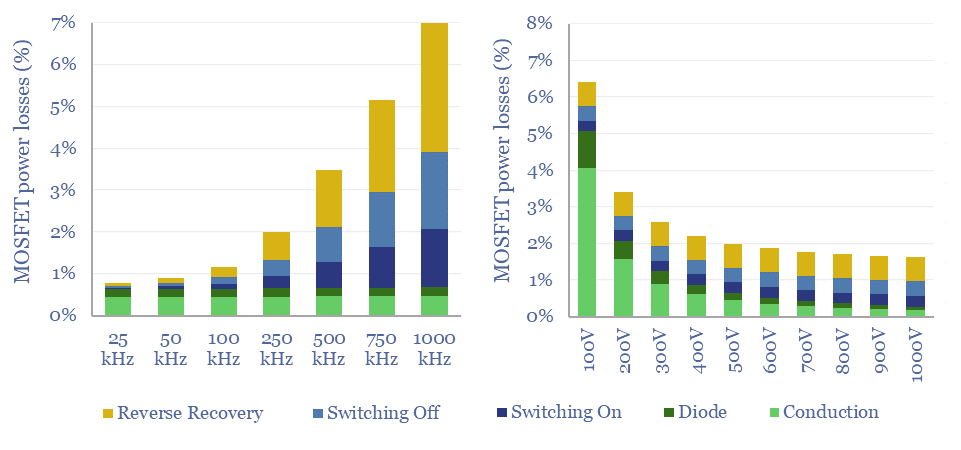
MOSFETs: energy use and power loss calculator?
MOSFETs are fast-acting digital switches, used to transform electricity, across new energies and digital devices. MOSFET power losses are built up from first principles in this data-file, averaging 2% per MOSFET, with a range of 1-10% depending on voltage, switching, on resistance, operating temperature and reverse recovery charge.
Download
Download
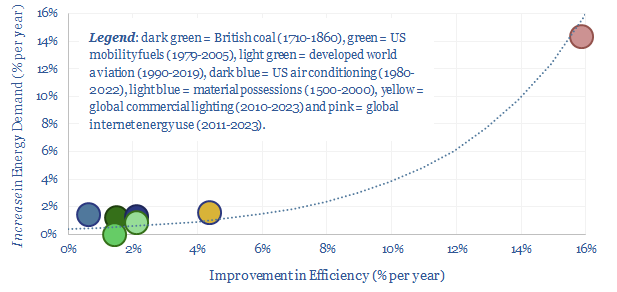
Jevons Paradox: what evidence for energy savings?
Using a commodity more efficiently can cause its demand to rise not fall; as greater efficiency opens up unforeseen possibilities. This is Jevon’s Paradox. Our 16-page report finds it is more prevalent than we expected. Efficiency gains underpin 25% of our roadmap to net zero. To be effective, commodity prices must also rise and remain high, otherwise rebound effects will raise demand.
Download
Download
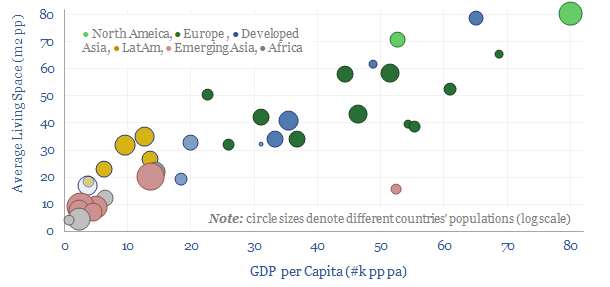
Average home sizes: living space per person?
Average home sizes matter for overall residential energy demand, heating and cooling demand. Hence the purpose of this data-file is to aggregate average home sizes by country, then translate the data into living space per capita. A good rule of thumb is that each $1k pp pa of GDP translates one-for-one into 1m2 pp pa of useful living space.
Download
Download
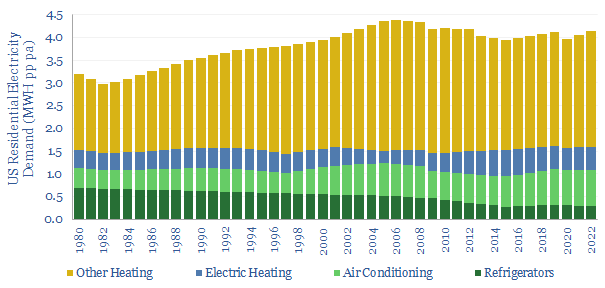
Residential energy consumption over time?
US residential energy consumption runs at 3,000 MWH per annum, equivalent to one quarter of total US energy consumption. Total demand has run sideways since 1980 as rebound effects and new demand sources have offset underlying efficiency savings?
Download
Download
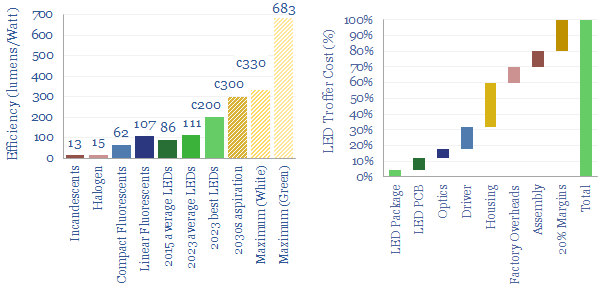
LEDs: seeing the light?
Lighting is 2% of global energy, 6% of electricity, 25% of buildings’ energy. LEDs are 2-20x more efficient than alternatives. Hence this 16-page report is our outlook for LEDs in the energy transition. We think LED market share doubles to c100% in the 2030s, to save energy, especially in solar-heavy grids. But demand is also rising due to ‘rebound effects’ and use in digital devices. We have screened 20 mature and (mostly) profitable pure plays.
Download
Download
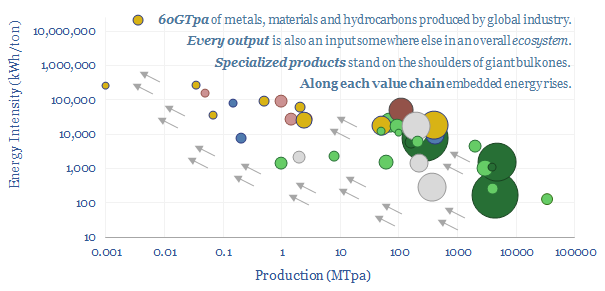
Industrial ecosystems: on the shoulders of giants?
This 14-page report explores whether global industrial activity is set to become ever more concentrated in a few advantaged locations, especially the US Gulf Coast, China and the Middle East. Industries form ecosystems. Different species cluster together. Elsewhere, in our view, you can no more re-shore a few select industries than introduce dung beetles onto the moon. These mega-trends matter for economic forecasts and valuations.
Download
Download
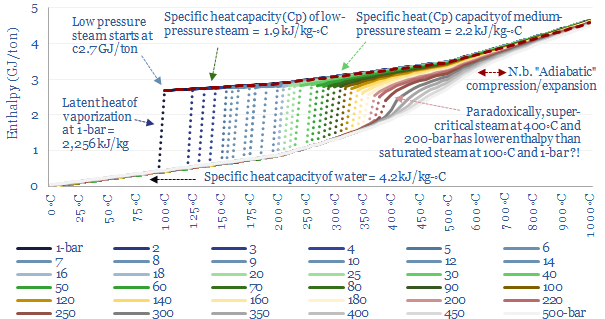
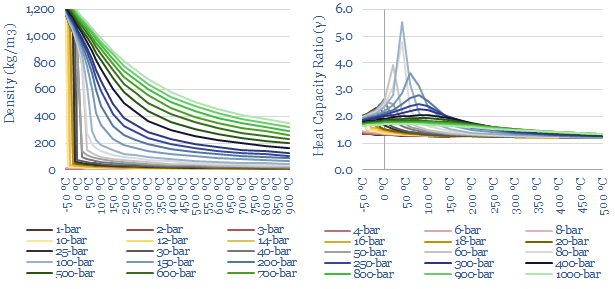
Energy needed to produce steam: enthalpy and entropy data?
This data-file quantifies the energy needed to produce steam, for industrial heat, chemicals, CCS plants and hydrogen reforming? As rules of thumb, low pressure saturated steam at 100◦C requires 2.6 GJ/ton (720kWh/ton), medium pressure dry steam at 6-bar and 300◦C requires 3 GJ/ton (830kWh/ton) and super-critical steam at 250-bar and 600◦C requires 4 GJ/ton (1,150kWh/ton).
Download
Download
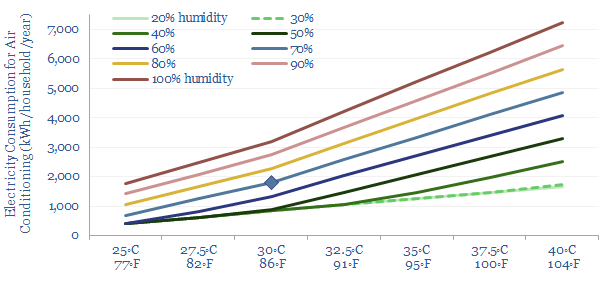
Air conditioning: energy consumption?
The average US home uses 2,000 kWh of electricity for air conditioners each year. Air conditioning energy consumption is broken down from first principles in this data-file, as a function of temperatures, humidity, heating days, household size, insulation and coefficient of performance (COP). What routes to lower the air conditioning energy demand and CO2 emissions?
Download
Download
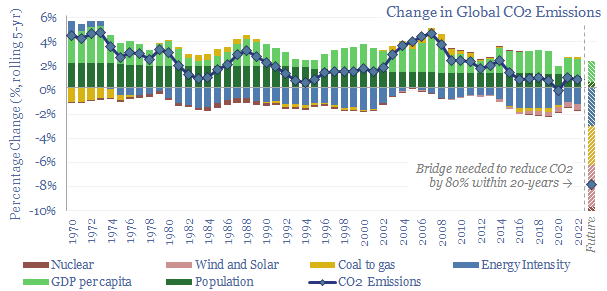
Global decarbonization: speeding up or slowing down?
This 16-page report beaks down global CO2 emissions, across six causal factors and 28 countries and regions. Global emissions rose at +0.7% pa CAGR from 2017-2022, of which +1.0% pa is population growth, +1.4% pa rising incomes, -1.4% pa efficiency gains, -0.5% renewables, 0% nuclear, +0.2% ramping back coal due to underinvestment in gas. Depressingly, progress towards net zero slowed down in the past five years. Reaching net zero requires vast acceleration in renewables, infrastructure, nuclear, gas and nature.
Download
Download
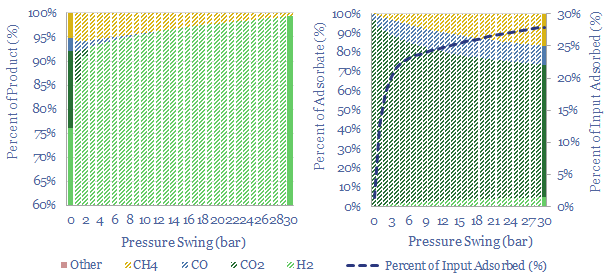
Industrial gas separation: swing producers?
Swing Adsorption separates gases, based on their differential loading onto zeolite adsorbents at varying Pressures. The first PSA plant goes back to 1966. Today, tens of thousands of PSA plants purify hydrogen, biogas, polymers, nitrogen/oxygen and possibly in the future, can capture CO2? This 16-page note explores the technology, costs, challenges, companies.
Download
Download
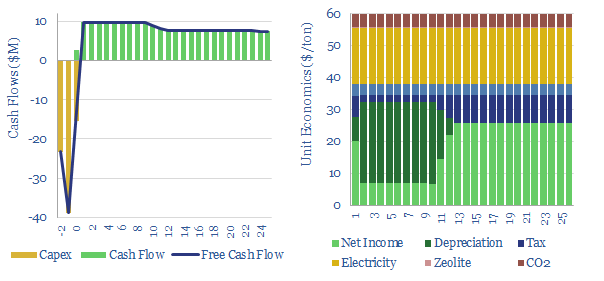
Pressure swing adsorption: energy economics?
Pressure swing adsorption purifies gases according to their differing tendencies to adsorb onto adsorbents under pressure. Pressure swing adsorption costs $0.1/kg when separating pure hydrogen from reformers, and $2-3/mcf when separating bio-methane from biogas. Our cost breakdowns include capex, opex, maintenance, zeolite replacement, compression power and CO2 costs.
Download
Download
What is the energy consumption of the internet?
Powering the internet consumed 800 TWH of electricity in 2022, as 5bn users generated 4.7 Zettabytes of traffic. Our guess is that the internet’s energy demands double by 2030, including due to AI (e.g., ChatGPT), adding 1% upside to global energy and 2.5% to global electricity demand. This 13-page note aims to break down the numbers and their implications.
Download
Download

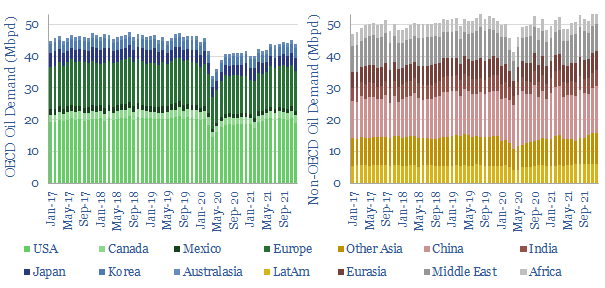
Global oil demand: breakdown by product by country?
This data-file breaks down global oil demand, country-by-country, product-by-product, month-by-month, across 2017-2022. The goal is to summarize the effects of COVID, and the subsequent recovery in oil markets. Global oil demand is hitting new highs, even though several product categories are still not fully recovered.
Download
Download
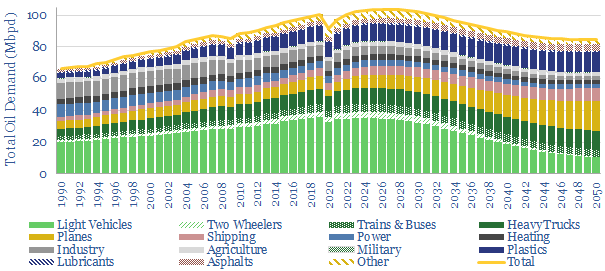
Global oil demand forecasts: by end use, by product, by region?
This model forecasts long-run oil demand to 2050, by end use, by year, and by region; across the US, the OECD and the non-OECD. We see demand gently rising through the 2020s, peaking at 104Mbpd in 2025-27, then gently falling to 85Mbpd by 2050 in the energy transition.
Download
Download
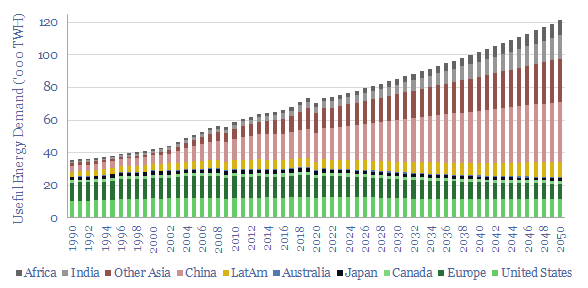
Global energy demand: by region and through 2050?
This model captures global energy demand by region through 2050, rising from 70,000 TWH in 2019-22 to 120,000 MWH in 2050. Demand rises c2% pa. Energy use per global person rises at 1% pa from 9.3 MWH pp pa to 12.6 MWH pp pa. Meeting human civilization's energy needs is crucial to the energy transition.
Download
Download
CO2 compression: stranger things?
CO2 is a strange gas. This matters as energy transition will require over 120 GW of compressors for 6GTpa of CCUS. This 13-page notes explains CO2’s strange properties, which helps to fine-tune appropriate risking factors for vanilla CCS, blue hydrogen, CO2-EOR, CO2 shipping, super-critical CO2 power cycles. There is also a wide moat around leading turbomachinery companies.
Download
Download
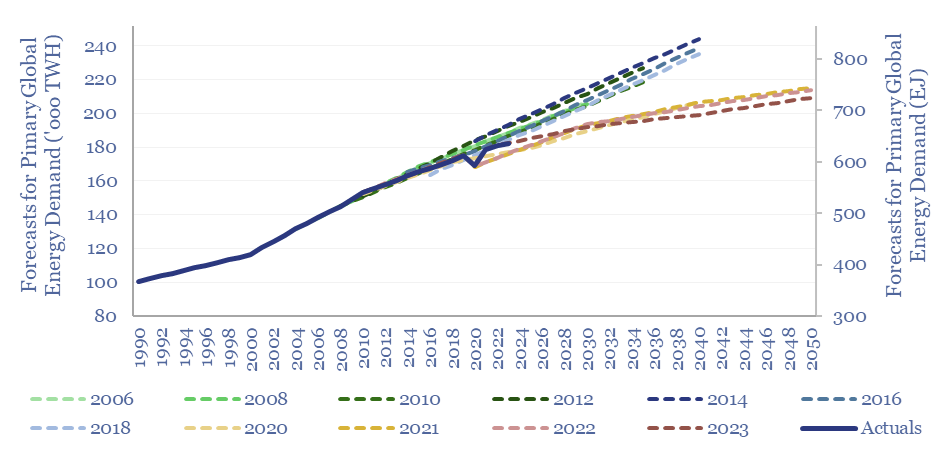
Energy demand forecasts: making predictions about the future?
How accurate are energy demand forecasts? Long-term forecasts for total global energy demand can easily be wrong by +/- 10%. Oil market forecasts tend to be amiss by 0.6% x the number of years away. Oil and coal seem to have been consistently under-estimated since 2020. Solar and wind were consistently underestimated in 2010-20, but less so for recent forecasts?
Download
Download
Energy shortage: fear in a handful of dust?
Should restoring the world’s energy surplus be seen as the most important ESG goal of the 2020s? This 12-page note outlines our top ten considerations, as our energy balances have deteriorated even further in the last year. Under-supply could persist through 2030. Shortages have cruel consequences. And unexpected ripple effects. Energy surplus also helps energy transition.
Download
Download
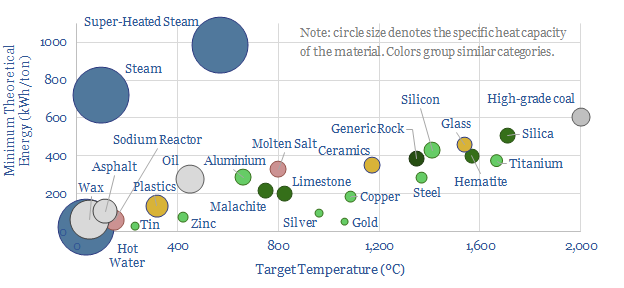
Heating-melting: how much energy is needed?
How do we quantify the minimum energy needed to heat materials and melt materials? This data-file calculates values, in kWh/ton, from first principles, based on target temperatures, specific heat capacities and latent heat capacities. A good rule of thumb is 25 kWh of useful energy to heat each ton of material by each 100ºC.
Download
Download
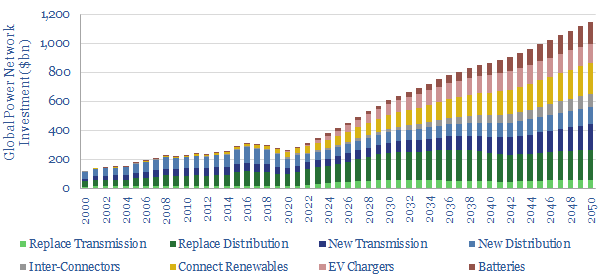
Power grids: global investment?
Global investment into power networks averaged $280bn per annum in 2015-20, of which two-thirds was for distribution and one-third was for transmission. Amazingly, these numbers step up to $600bn in 2030, >$1trn in the 2040s and can be as large as all primary energy investment.
Download
Download
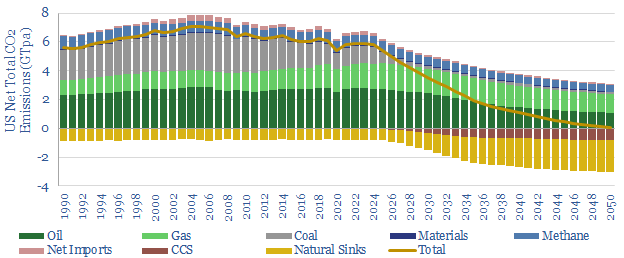
US decarbonization: energy and CO2 emissions?
The US consumes 25,000 TWH of primary energy per year, which equates to 13,000 TWH of useful energy, and emits 6GTpa of CO2. This model captures our best estimates for what a pragmatic and economical decarbonization of the US will look like, reaching net zero in 2050, with energy consumption at 11,500 TWH per year.
Download
Download
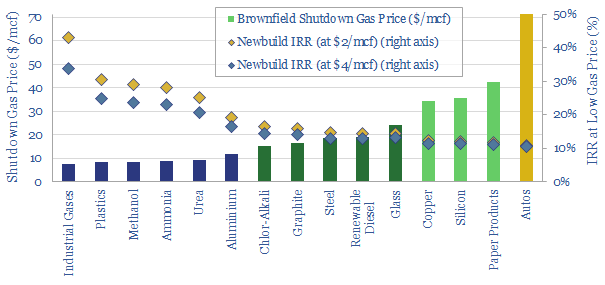
Gas diffusion: how will record prices resolve?
Dispersion in global gas prices has hit new highs in 2022. Hence this 17-page note evaluates two possible solutions. Building more LNG plants achieves 15-20% IRRs. But shuttering some of Europe’s gas-consuming industry then re-locating it in gas-rich countries can achieve 20-40% IRRs, lower net CO2 and lower risk? Both solutions should step up. What implications?
Download
Download
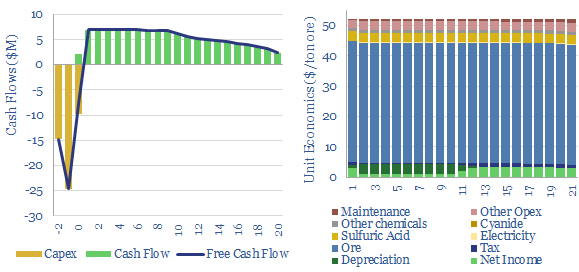
Mining: crushing, grinding and comminution costs?
Mining crushing-grinding costs are typically $10/ton of ore, breaking 3-10cm rubble into 30-100 micron powders. Capex averages $20/Tpa and energy cost averages 20kWh/ton.
Download
Download
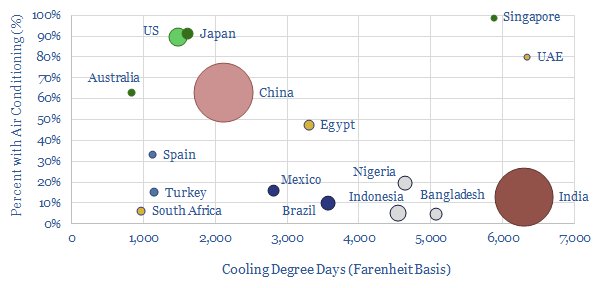
Air conditioning: energy demand sensitivity?
This data-file quantifies air conditioning energy demand. In the US each 100 variation in CDDs adds 26 TWH of electricity (0.6%) demand and 200bcf of gas (0.6%). Air conditioning already consumes 7% of all global electricity and could treble by 2050.
Download
Download
Global oil demand: rumors of my death?
‘Rumors of my death have been greatly exaggerated’. Mark Twain’s quote also applies to global oil consumption. This note aggregates demand data for 8 oil products and 120 countries over the COVID pandemic. We see 3.5Mbpd of pent-up demand ‘upside’, acting as a floor on medium-term oil prices.
Download
Download
Carbon Intensity
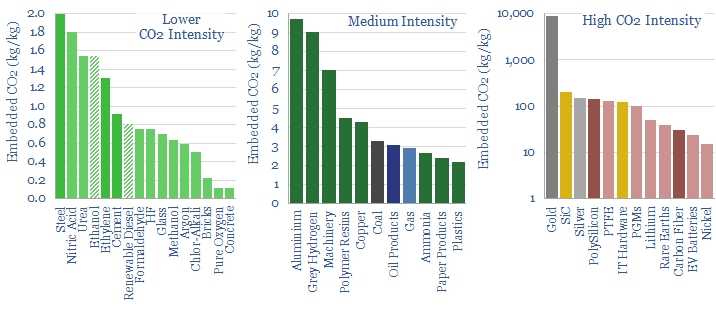
CO2 intensity of materials: an overview?
This data-file tabulates the energy intensity and CO2 intensity of materials, in tons/ton of CO2, kWh/ton of electricity and kWh/ton of total energy use per ton of material. The build-ups are based on 160 economic models that we have constructed to date, and simply intended as a helpful summary reference. Our key conclusions on CO2 intensity of materials are below.
Download
Download
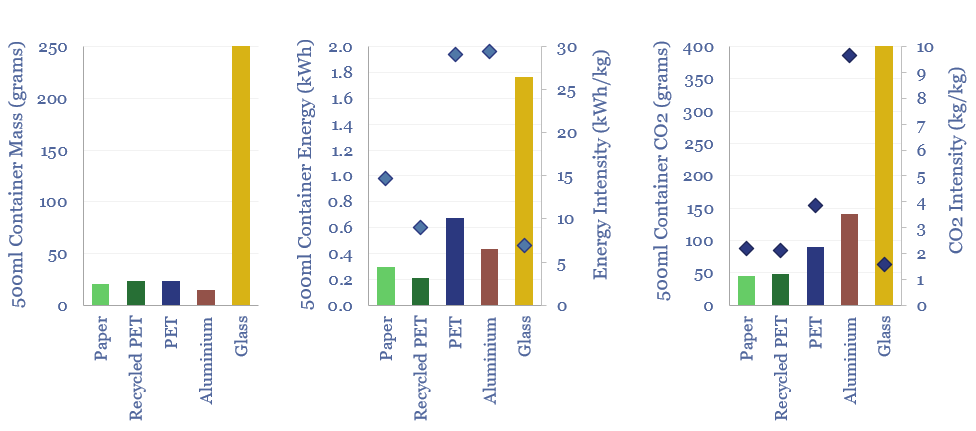
Plastic products: energy and CO2 intensity of plastics?
The energy intensity of plastic products and the CO2 intensity of plastics are built up from first principles in this data-file. Virgin plastic typically embeds 3-4 kg/kg of CO2e. But compared against glass, PET bottles embed 60% less energy and 80% less CO2. Compared against virgin PET, recycled PET embeds 70% less energy and 45% less CO2. Aluminium packaging is also highly efficient.
Download
Download
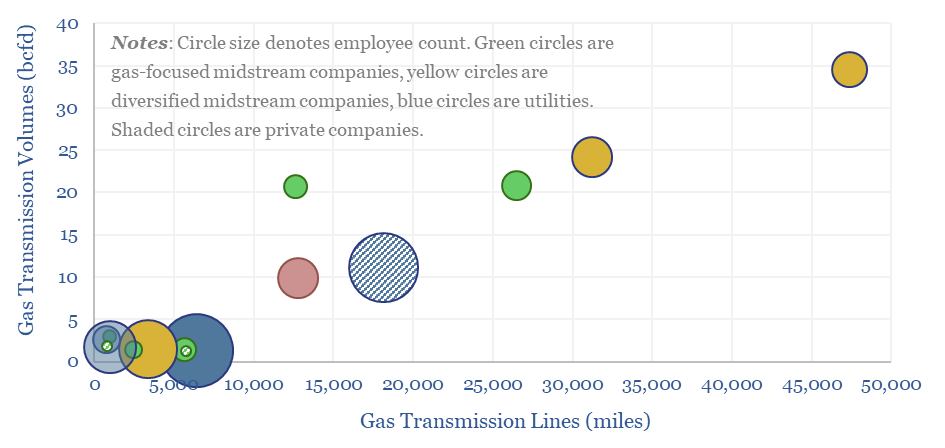
US gas transmission: by company and by pipeline?
This data-file aggregates granular data into US gas transmission, by company and by pipeline, for 40 major US gas pipelines which transport 45TCF of gas per annum across 185,000 miles; and for 3,200 compressors at 640 related compressor stations.
Download
Download
MOSFETs: energy use and power loss calculator?
MOSFETs are fast-acting digital switches, used to transform electricity, across new energies and digital devices. MOSFET power losses are built up from first principles in this data-file, averaging 2% per MOSFET, with a range of 1-10% depending on voltage, switching, on resistance, operating temperature and reverse recovery charge.
Download
Download
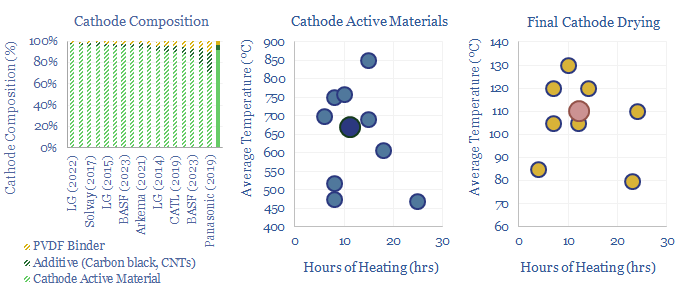
Battery cathode active materials and manufacturing?
Lithium ion batteries famously have cathodes containing lithium, nickel, manganese, cobalt, aluminium and/or iron phosphate. But how are these cathode active materials manufactured? This data-file gathers specific details from technical papers and patents by leading companies such as BASF, LG, CATL, Panasonic, Solvay and Arkema.
Download
Download
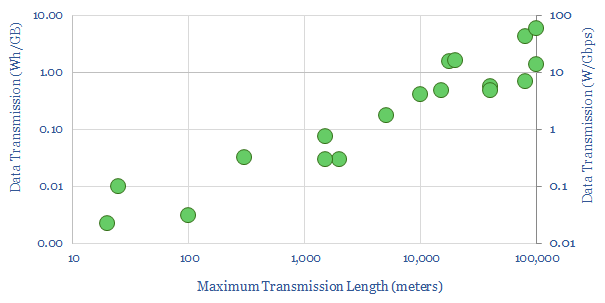
Energy intensity of fiber optic cables?
What is the energy intensity of fiber optic cables? Our best estimate is that moving each GB of internet traffic through the fixed network requires 40Wh/GB of energy, across 20 hops, spanning 800km and requiring an average of 0.05 Wh/GB/km. Generally, long-distance transmission is 1-2 orders of magnitude more energy efficient than short-distance.
Download
Download
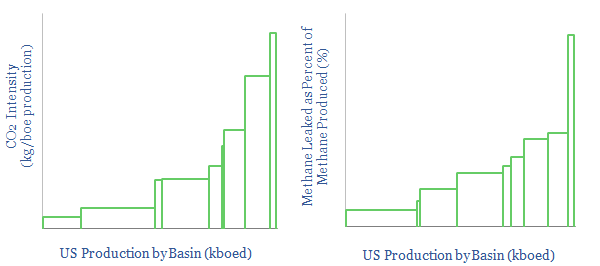
US CO2 and Methane Intensity by Basin
The CO2 intensity of oil and gas production is tabulated for 425 distinct company positions across 12 distinct US onshore basins in this data-file. Using the data, we can aggregate the total upstream CO2 intensity in (kg/boe), methane leakage rates (%) and flaring intensity (in mcf/boe), by company, by basin and across the US Lower 48.
Download
Download
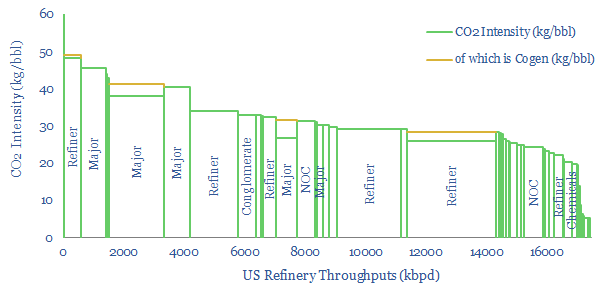
US Refinery Database: CO2 intensity by facility?
This US refinery database covers 125 US refining facilities, with an average capacity of 150kbpd, and an average CO2 intensity of 33 kg/bbl. Upper quartile performers emitted less than 20 kg/bbl, while lower quartile performers emitted over 40 kg/bbl. The goal of this refinery database is to disaggregate US refining CO2 intensity by company and by facility.
Download
Download
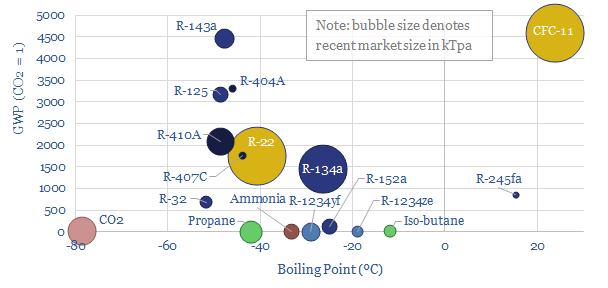
Refrigerants: leading chemicals for the rise of heat pumps?
This data-file is a breakdown of c1MTpa of refrigerants used in the recent past for cooling, across refrigerators, air conditioners, in vehicles, industrial chillers, and increasingly, heat pumps. The market is shifting rapidly towards lower-carbon products, including HFOs, propane, iso-butane and even CO2 itself. We still see fluorinated chemicals markets tightening.
Download
Download
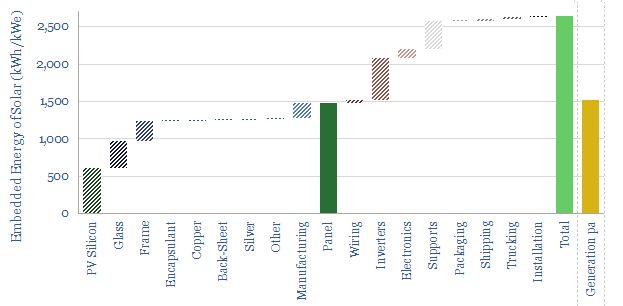
Solar: energy payback and embedded energy?
What is the energy payback and embedded energy of solar? We have aggregated the consumption of 10 different materials (in kg/kW) and around 10 other energy-consuming line-items (in kWh/kW). Our base case estimate is 2.5 MWH/kWe of solar and an energy payback of 1.5-years. Numbers and sensitivities can be stress-tested in the data-file.
Download
Download
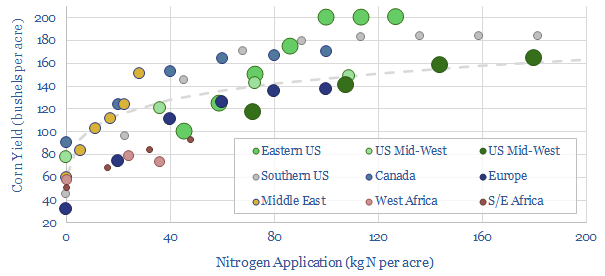
Crop production: how much does nitrogen fertilizer increase yields?
How much does fertilizer increase crop yields? Aggregating all of the global data, a good rule of thumb is that up to 200kg of nitrogen can be applied per acre, increasing corn crop yields from 60 bushels per acre (with no fertilizer) to 160 bushels per acre (at 200 kg/acre). But the relationship is logarithmic, with diminishing returns.
Download
Download
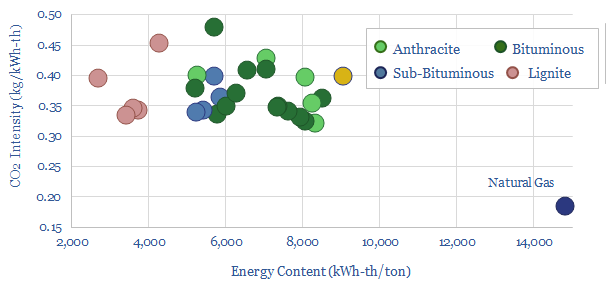
Coal grades: what CO2 intensity?
The CO2 intensity of coal is estimated at 0.37kg/kWh of thermal energy, at a typical coal grade comprising 63% carbon and 6,250 kWh/ton of energy content. This is the average across 25 samples in our data-file, while moisture, ash and sulphur are also appraised. Coal is 2x more CO2 intensive than natural gas.
Download
Download
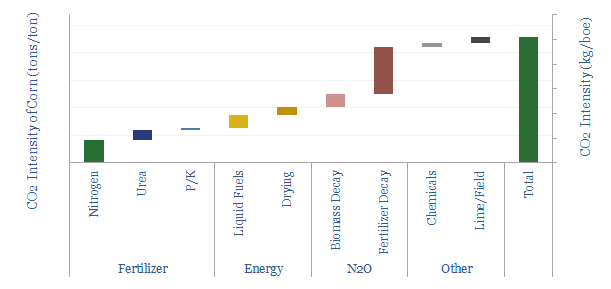
Crop production: what CO2 intensity?
The CO2 intensity of producing corn averages 0.23 tons/ton, or 75kg/boe. 50% is from N2O emissions, a powerful greenhouse gas, from the breakdown of nitrogen fertilizer. Producing 1 kWh of food energy requires 9 kWh of fossil energy.
Download
Download
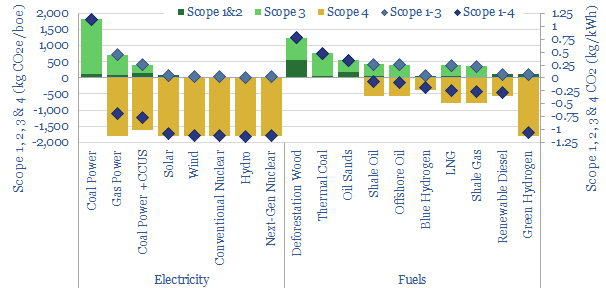
CO2 intensity: Scope 1, 2 & 3 and Scope 4 emissions?
Scope 4 CO2 emissions capture the CO2 that is avoided by use of a product. Many energy investments with positive Scope 1-3 emissions have deeply negative Scope 1-4 emissions. Numbers are quantified and may offer a more constructive approach to decarbonization investments.
Download
Download
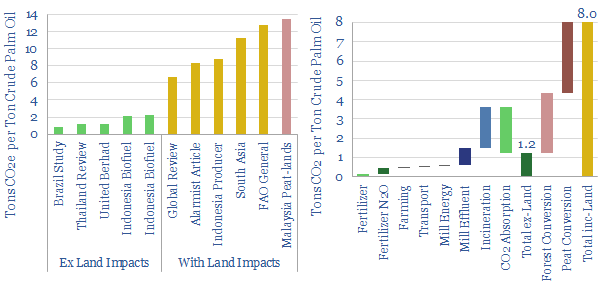
Palm oil: what CO2 intensity?
Global palm oil production runs at 80MTpa, for food, HPC and bio-fuels. Carbon intensity is 1.2 tons CO2e per ton of crude palm oil, excluding land use impacts, and 8.0 tons/ton on a global basis including land use impacts. This means once a bio-fuel has more than c35% palm oil in its feedstock, it is likely to be higher carbon than conventional diesel.
Download
Download
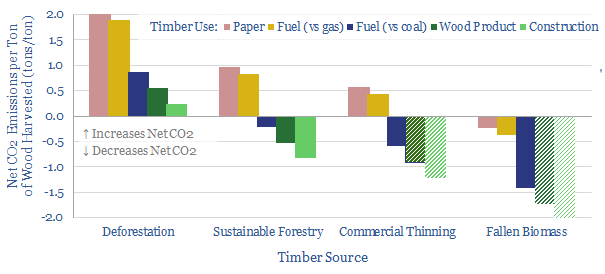
CO2 intensity of wood: context by context?
This data-file calculates the CO2 intensity of wood in the energy transition. Context matters, and can sway the net climate impacts from -2 tons of emissions reductions per ton of wood through to +2 tons of incremental emissions per ton of wood. Calculations can be stress-tested in the data-file.
Download
Download
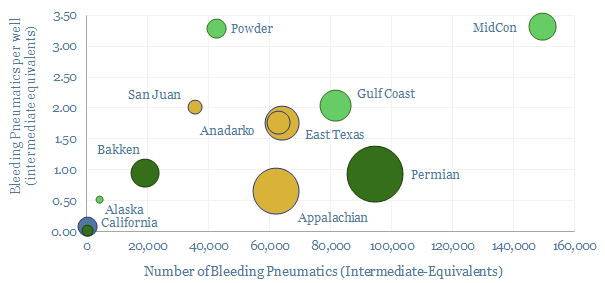
Methane emissions from pneumatic devices: by operator, by basin?
Methane leaks from 1M pneumatic devices across the US onshore oil and gas industry comprise 50% of all US upstream methane leaks and 20% of upstream CO2. This file aggregates the data. Rankings reveal operators with a pressing priority to replace >100,000 medium and high bleed devices, and other best-in-class companies.
Download
Download
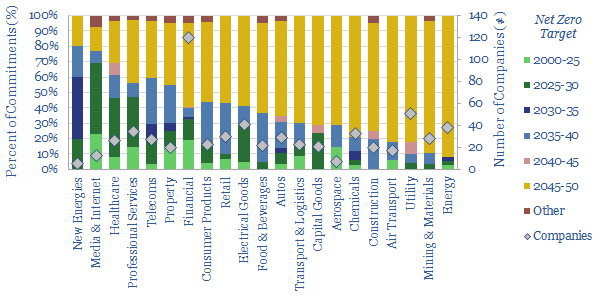
Decarbonization targets: what do the data tell us?
630 companies have now pledged to reach some variant of net zero by early-2022. The average year for this ambition is 2044. Although it varies by sector. 50% of companies are including some Scope 3 emissions in their definitions. This data-file presents our conclusions by sector.
Download
Download
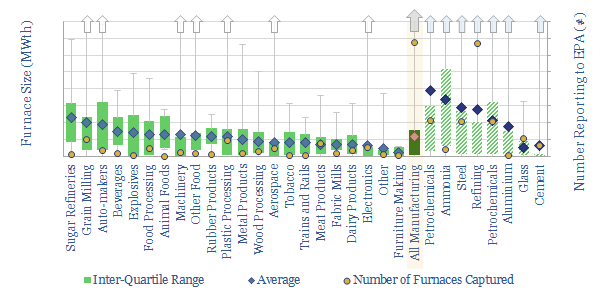
US industrial furnaces: breakdown by size, by industry, by fuel?
There are 1,500 industrial furnaces in the US manufacturing sector, with average capacity of 60MWth, c90% powered by natural gas, and thus explaining over 3.5 bcfd of US gas demand (4-5% of total). This is an unbelievably complex landscape, but we have captured as much facility-by-facility data as possible.
Download
Download
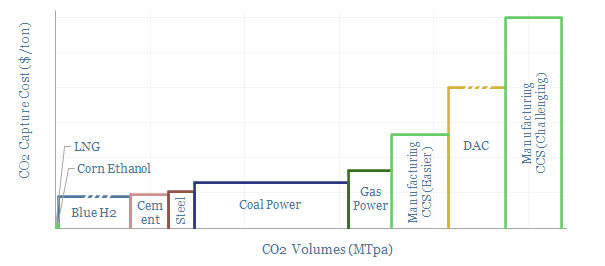
CO2 capture: a cost curve?
This data-file summarizes the costs of capturing CO2. The lowest-cost options are to access pure CO2 streams that are simply being vented at present. Next are blue hydrogen, steel and cement, which could each have GTpa scale. Power stations place next, at $60-100/ton. DAC is carbon negative but expensive.
Download
Download
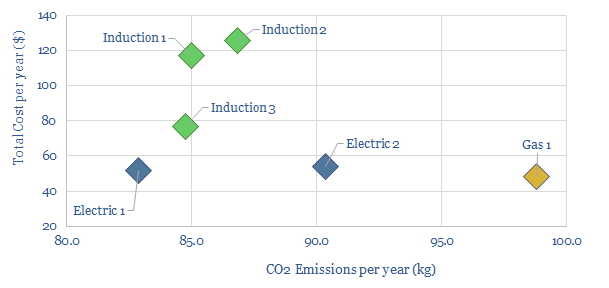
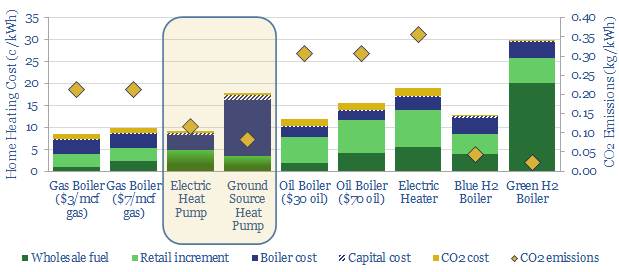
Cost and CO2 intensity of home cooking technologies?
The most important determinant of cooking's CO2 intensity is consumer behaviour. At today's energy costs and grid mix, gas-fired cooking yields the lowest costs. Sometimes electrification of cooking will decrease CO2 and sometimes not. Electric induction is most efficient, but 2-3x more expensive than gas and electric hobs.
Download
Download
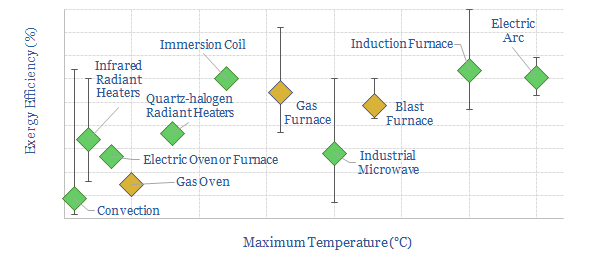
Industrial heating technologies: an overview?
This data-file summarizes over a dozen industrial heating technologies, including their temperatures, efficiency, advantages and challenges. Generally 90% of incoming energy can be converted to industrial process heat and c40% achieves useful exergetic output. But ranges very broadly from 10-90%.
Download
Download
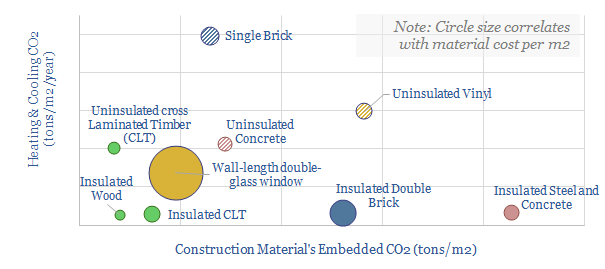
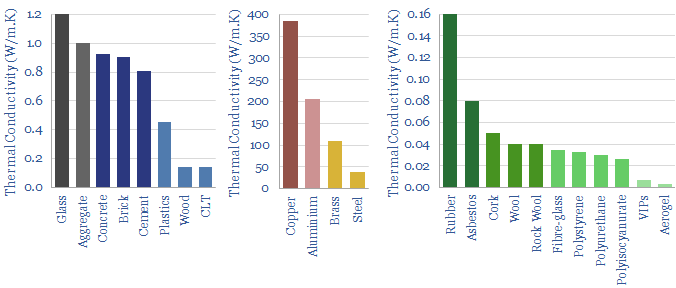
Construction materials: a screen of costs and CO2 intensities?
This data-file calculates the costs, the embedded energy and the embedded CO2 of different construction materials, both during their production and for ongoing heating and cooling. Insulated wood and cross-laminated timber have the lowest CO2 intensities and can be extremely cost competitive.
Download
Download
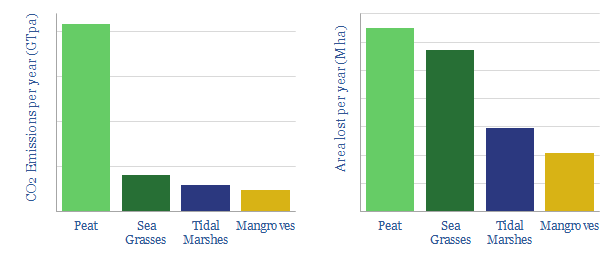
Blue carbon: how much degradation and CO2 emission?
This data-file illustrates the outsized contribution of blue carbon ecosystems in the carbon cycle, looking across mangroves, tidal marshes, sea grasses and peat bogs. Degradation of blue carbon ecosystems continues with vast CO2 consequences, comparable to the entire global cement industry.
Download
Download
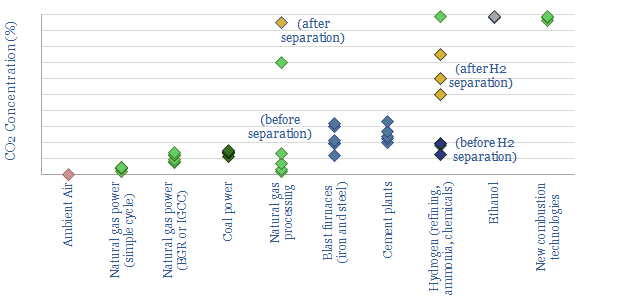
CO2 concentrations in industrial exhaust streams?
The aim of this data-file is to compile CO2 concentrations in industrial exhaust streams, as a molar percentage of flue gas. This matters for the costs of CO2 separation. Most promising CCS candidates are bio-ethanol plants, industrial hydrogen production and some gas processing, followed by cement and steel plants.
Download
Download
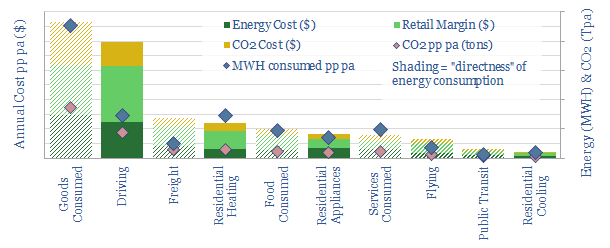
A breakdown of US energy consumption per person per year
The average American consumes 36MWH of energy each year, emits 20 tons of CO2, spends $2,000 directly on energy (6% of income) and $4,500 including the energy embedded in goods and services (15% of income). A CO2 price of $75/ton may fully decarbonize the US but would absorb another 5% of average income.
Download
Download
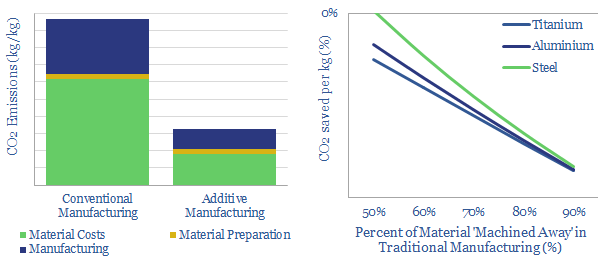
CO2 of metal components: conventional vs additive manufacturing?
Manufacturing metal components can be extremely energy intensive, as 60-95% of original materials are often machined away. Additive manufacturing is thus able to deliver c65% CO2 savings per kg of materials in our base case. This data-file quantifies the CO2 savings based on input variables and technical papers.
Download
Download
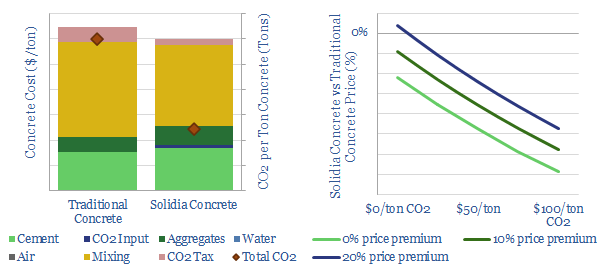
CO2-Cured Concrete: Solidia vs traditional cement?
CO2-cured concrete has c60% lower emissions than traditional concrete, which is the most widely used construction material on the planet, comprising 4bn tons of annual CO2 emissions, or 8% of the global total. This data-file profiles the CO2 and economic costs of Solidia versus traditional cement, to size the opportunity.
Download
Download
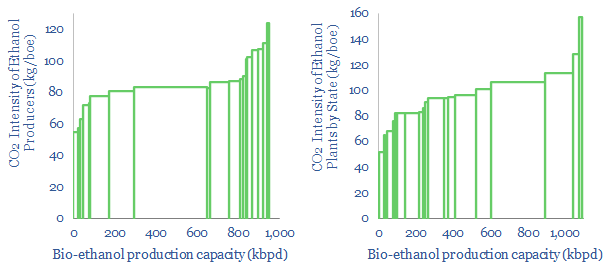
US ethanol plants: what CO2 intensity?
US bioethanol plants produce 1Mbpd of liquid fuels, with an average CO2 intensity of 85kg/boe. Overall, corn-based bioethanol has c40% lower CO2 than oil products. We screened the leaders and laggards by CO2-intensity, covering Poet, Valero, Great Plains, Koch, Marathon and White Energy.
Download
Download
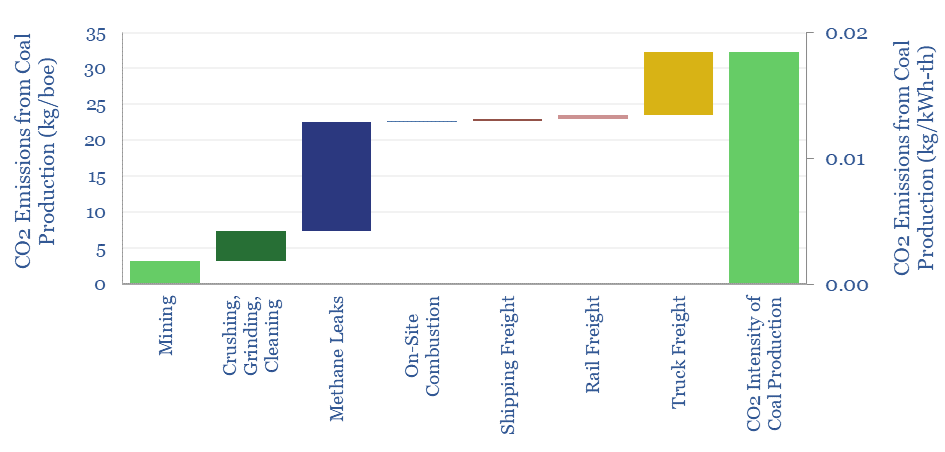
CO2 intensity of coal production?
Producing a ton of coal typically emits 0.19T of CO2, equivalent to 50kg/boe. The numbers comprise mining, methane leaks and transportation. Hence domestic coal production will tend to emit 2x more CO2 than gas production, plus c2x more CO2 in combustion. However, numbers vary widely based on input assumptions, such as methane lakage rates, btu content and transportation distances, which can be flexed in the model.
Download
Download
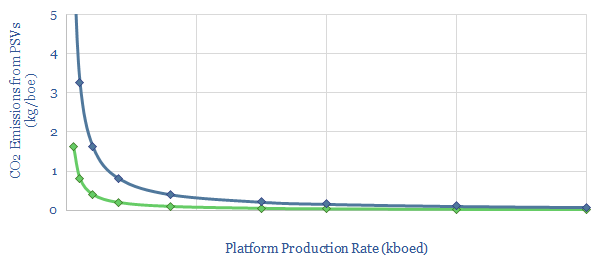
Platform supply vessels: what contribution to CO2?
This data-file calculates the contribution of Platform Supply Vessels (PSVs) to an oil and gas asset's emissions. Our base case estimate is 0.1kg/boe for a productive asset in a well-developed basin. Numbers rise 4x in a remote basin, and by another c4x for smaller fields. 1kg/boe is possible. These emissions can be lowered by 10-20% through by LNG-fuelling or battery-hybridization.
Download
Download
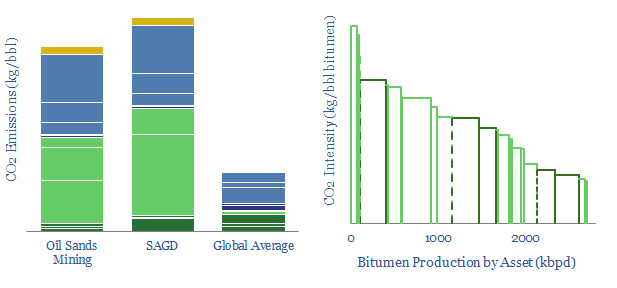
Oil Sands CO2 Intensity
This data-file quantifies the CO2 intensity of oil sands mining and SAGD, line by line, based on real-world data. We also derive a CO2 curve ranking c2.5Mbpd of production across Alberta, to compare different operators. Steam-oil-ratios explain c60% of the variance in SAGD assets' emissions.
Download
Download
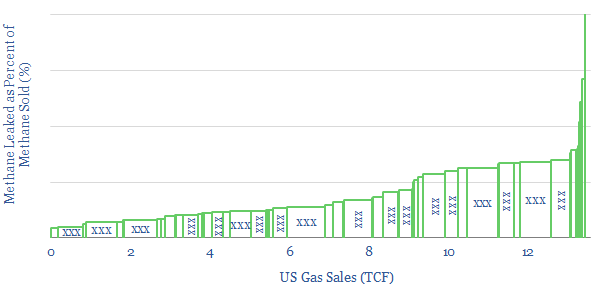
Methane Leaks from Downstream Gas Distribution
Methane leakages average 0.2% when distributing natural gas to end-customers, across the US's 160 retail gas networks. Leakages are most correlated with the share of sales to smaller customers. 80 distinct gas companies are ranked in this data-file. State-owned utilities appear to have 2x higher leakage rates versus public companies.
Download
Download
CO2 intensity of shale: breakdown by category?
This model disaggregates the CO2 emissions of producing shale oil, across 14 different contributors: such as materials, drilling, fracturing, supply chain, lifting, processing, methane leaks and flaring. CO2 intensity can be flexed by changing the input assumptions. Our 'idealized shale' scenario follows in a separate tab, showing how Permian shale production could become 'carbon neutral'.
Download
Download
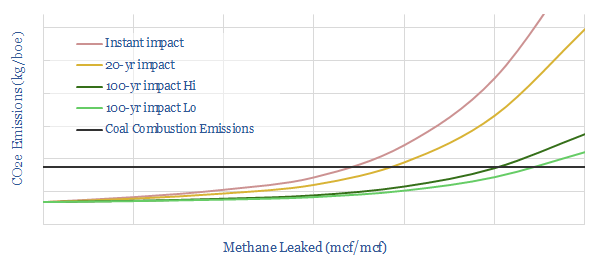
Methane emissions detract from natural gas?
With methane emissions fully controlled, burning gas is c60% lower-CO2 than burning coal. However, taking natural gas to cause 120x more warming than CO2 over a short timeframe, the crossover (where coal emissions and gas emissions are equivalent) is 4% methane intensity. The gas industry must work to mitigate methane.
Download
Download
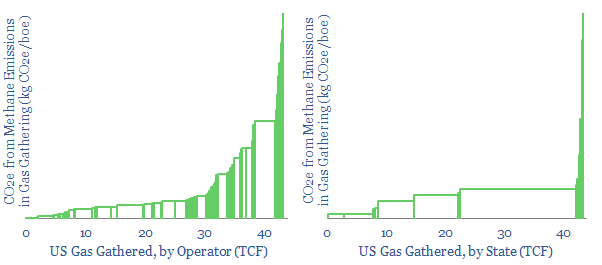
Gas Gathering: how much CO2 and Methane?
Gas gathering and gas processing are 50% less CO2 intensive than oil refining. Nevertheless, these processes emitted 18kg of CO2e per boe in 2018. Methane matters most, explaining 1-7kg/boe of gas industry CO2-equivalents. This data-file assesses 850 US gas gathering and processing facilities, to screen for leaders and laggards, by geography and by operator.
Download
Download
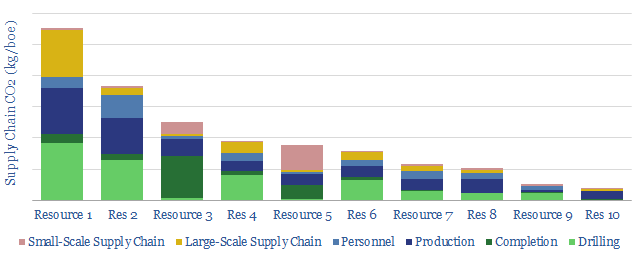
CO2 Intensity of Oilfield Supply Chains
What is more CO2-intensive: the c4,000 truck trips needed to complete a shale well, or giant offshore service vessels (OSVs), which each consume >100bpd of fuel? This data-file quantifies the CO2 intensity of supply-chains, for 10 different resource types, as a function of 30 input variables.
Download
Download
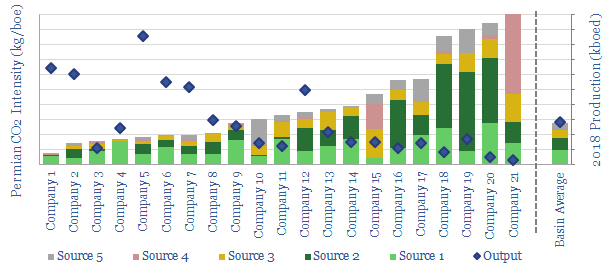
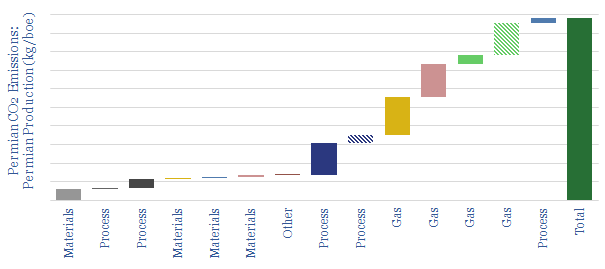
Permian CO2 Emissions by Producer
This data-file tabulates Permian CO2 intensity, based on regulatory disclosures from 20 of the leading producers to the EPA. The data are disaggregated by company, across 18 different categories, such as combustion, flaring, venting, pneumatics, storage tanks and methane leaks. There are opportunities to lower emissions.
Download
Download
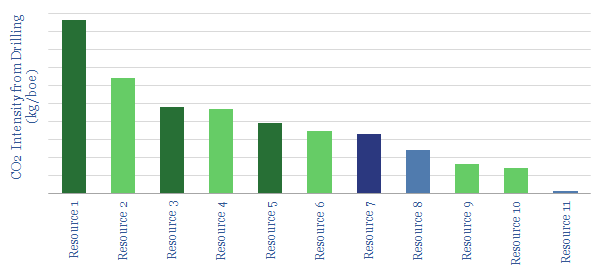
CO2 Intensity of Drilling Oil Wells?
This data-file estimates the CO2 intensity of drilling oil wells, based on the fuel consumption of different rig types. Drilling wells is not the largest portion of the oil industry's total CO2 intensity. Nevertheless there is a 50x spread between the best barrels at prolific onshore fields and the worst barrels at mature deepwater assets.
Download
Download
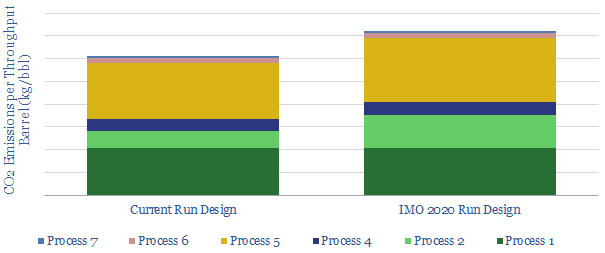
Carbon Costs of IMO 2020?
CO2 intensity of oil refineries could rise by 20% due to IMO 2020 sulphur regulations, if all high-sulphur fuel oil is upgraded into low-sulphur diesel, we estimate. The drivers are an extra stage of cracking, plus higher-temperature hydrotreating, which will also increase hydrogen demands. This one change could undo 30-years of efficiency gains.
Download
Download
Energy Efficiency
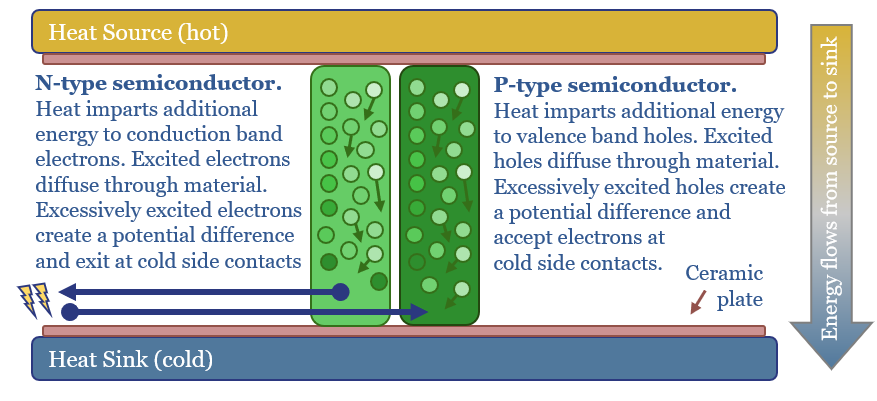
Seebeck Effect: are thermoelectrics the next solar?
Solar semiconductors have changed the world, converting light into clean electricity. Hence can thermoelectric semiconductors follow the same path, converting heat into electricity with no moving parts? This 14-page report reviews the opportunity, challenges, efficiency, costs and companies.
Download
Download
MOSFETs: energy use and power loss calculator?
MOSFETs are fast-acting digital switches, used to transform electricity, across new energies and digital devices. MOSFET power losses are built up from first principles in this data-file, averaging 2% per MOSFET, with a range of 1-10% depending on voltage, switching, on resistance, operating temperature and reverse recovery charge.
Download
Download
Energy Recovery Inc: pressure exchanger technology?
Pressure exchangers transfer energy from a high-pressure fluid stream to a low-pressure fluid stream, and can save up to 60% input energy. Energy Recovery Inc is a leading provider of pressure exchangers, especially for the desalination industry, and increasingly for refrigeration, air conditioners, heat pump and industrial applications. Our technology review finds a moat.
Download
Download
LEDs: seeing the light?
Lighting is 2% of global energy, 6% of electricity, 25% of buildings’ energy. LEDs are 2-20x more efficient than alternatives. Hence this 16-page report is our outlook for LEDs in the energy transition. We think LED market share doubles to c100% in the 2030s, to save energy, especially in solar-heavy grids. But demand is also rising due to ‘rebound effects’ and use in digital devices. We have screened 20 mature and (mostly) profitable pure plays.
Download
Download
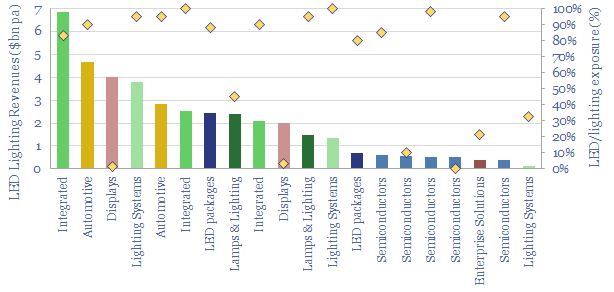
LED lighting: leading companies in LEDs?
20 leading companies in LED lighting are compared in this data-file, mostly mid-caps with $2-10bn market cap and $1-8bn of lighting revenues, listed in the US, Europe, Japan, Taiwan. Operating margins averaged 8% in 2022, due to high competition, fragmentation and inorganic activity. The value chain ranges from LED semiconductor dyes to service providers installing increasingly efficient lighting systems as part of the energy transition.
Download
Download
AirJoule: Metal Organic Framework HVAC breakthrough?
Montana Technologies is developing AirJoule, an HVAC technology that uses metal organic frameworks, to lower the energy costs of air conditioning by 50-75%. The company is going public via SPAC and targeting first revenues in 2024. Our AirJoule technology review finds strong rationale, technical details and challenges.
Download
Download
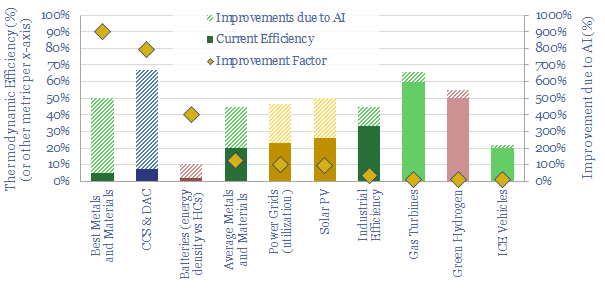
Omniscience: how will AI reshape the energy transition?
AI will be a game-changer for global energy efficiency, saving 10x more energy than it consumes directly, closing 'thermodynamic gaps' where 80-90% of all primary energy is wasted today. Leading corporations will harness AI to lower costs and accelerate decarbonization. This 19-page note explores opportunities.
Download
Download
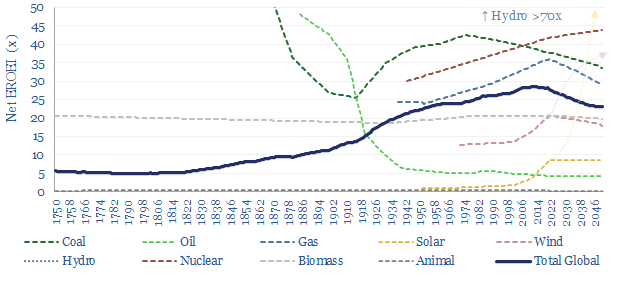
EROEI: energy return on energy invested?
EROEI is the best metric for comparing end-to-end energy efficiencies. Wind and solar currently have EROEIs that are lower and ‘slower’ than today’s global energy mix; stoking upside to energy demand and capex. But future wind and solar EROEIs could improve 2-6x. This 13-page report explores whether this will be the make-or-break factor determining the ultimate share of renewables?
Download
Download
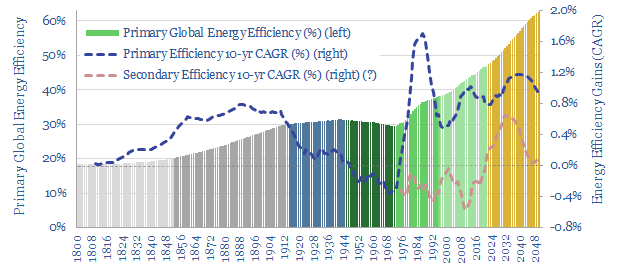
Energy efficiency: a riddle, in a mystery, in an enigma?
Projections of future global energy demand depend on energy efficiency gains, which are hoped to step up from 1% per year since 1970, to above 3% per year to 2050. But there is a problem. Energy efficiency is vague. And hard to measure. This 17-page note explains why we are worried that global energy demand will surprise to the upside as efficiency gains disappoint optimistic forecasts.
Download
Download
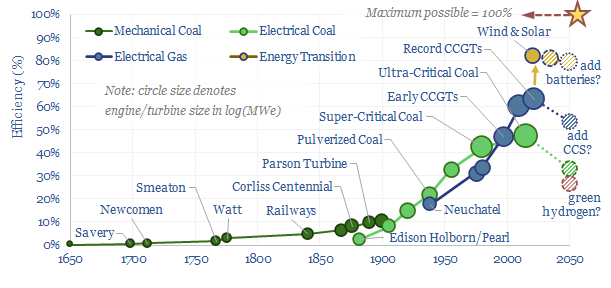
Prime movers: efficiency of power generation over time?
How has the efficiency of prime movers increased across industrial history? This data-file profiles the continued progress in the efficiency of power generation over time, from 1650 to 2050e. As a rule of thumb, the energy system has shifted to become ever more efficient over the past 400-years.
Download
Download
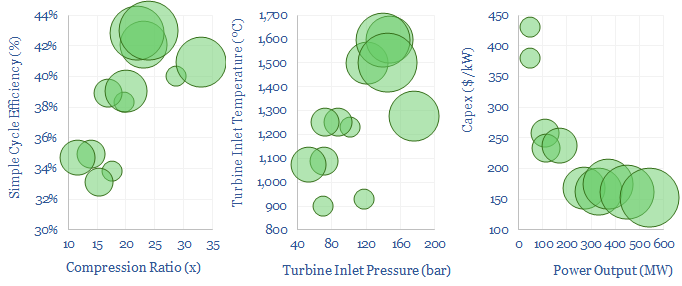
Gas turbines: operating parameters?
A typical simple-cycle gas turbine is sized at 200MW, and achieves 38% efficiency, as super-heated gases at 1,250ºC temperature and 100-bar pressure expand and drive a turbine. Efficiency rises to 58% in a combined cycle. The purpose of this data-file is to tabulate typical operating parameters of gas turbines.
Download
Download
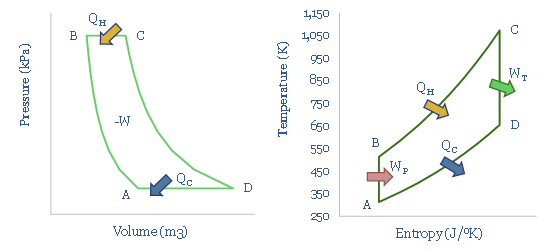
Thermodynamics: Carnot, Rankine, Brayton & beyond?
Engines convert heat into work. They are governed by thermodynamics. This note is not a 1,000 page textbook. The goal is to explain different heat engines, simply, in 13-pages, covering what we think decision makers in the energy transition should know. The theory underpins the appeal of electrification, ultra-efficient gas turbines, CHPs, nuclear HTGRs and new super-critical CO2 power cycles.
Download
Download
Refrigerants: leading chemicals for the rise of heat pumps?
This data-file is a breakdown of c1MTpa of refrigerants used in the recent past for cooling, across refrigerators, air conditioners, in vehicles, industrial chillers, and increasingly, heat pumps. The market is shifting rapidly towards lower-carbon products, including HFOs, propane, iso-butane and even CO2 itself. We still see fluorinated chemicals markets tightening.
Download
Download
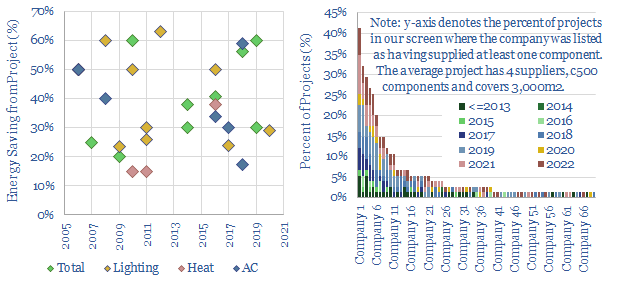
Building automation: energy savings, KNX case studies and companies?
High-quality building automation typically saves 30-40% of the energy needed for lighting, heating and cooling a building. This matters amidst energy shortages, and reduces payback times on $100-500k up-front capex. This data-file aggregates case studies of KNX energy savings, and screens 70 companies, from Capital Goods giants to private pure-plays.
Download
Download
Heap leaching: energy economics?
This data-file captures the energy economics of leaching in the mining industry, especially the costs of heap leaching, for the extraction of copper, nickel, gold, silver, other precious metals, uranium, and Rare Earths. The data-file allows you to stress test costs in $/ton of ore, $/ton of metal, capex, opex, chemicals costs, energy intensity and CO2 intensity.
Download
Download
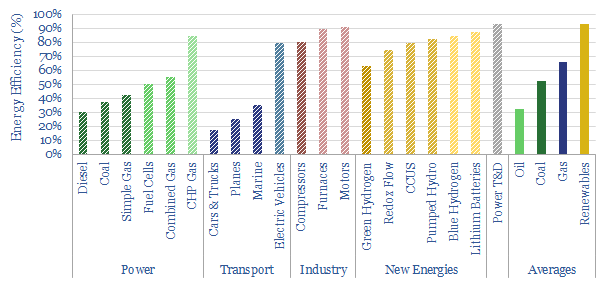
Energy efficiency: an overview?
This data-file is an overview of energy efficiency. The average power generation facility is c40% efficient. The average ICE is 20%. The average EV is 80%. The average industrial process is 85%. Some new energies have efficiency losses.
Download
Download
PureCycle: polypropylene recycling breakthrough?
PureCycle was founded in 2015, went public via SPAC in 2021 and aims to recycle waste polypropylene into virgin-like polypropylene saving 79% of the usual input energy and 35% of the input CO2. Despite recent controversies, our PureCycle technology review is able to de-risk several ambitions.
Download
Download
Aurubis: copper recycling breakthrough?
Aurubis produces copper products from 1MTpa of recycled materials and 2.25MTpa of concetrates. Energy use and CO2 emissions are two-thirds lower than primary copper production. Our technology review finds a partial moat.
Download
Download
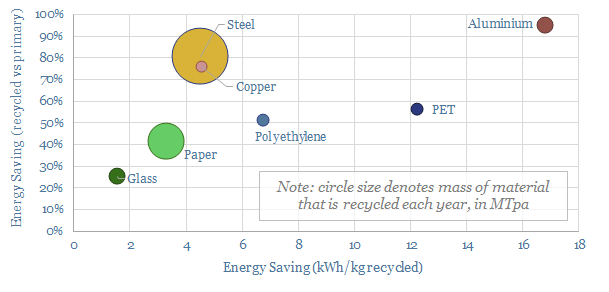
Recycling: a global overview of energy savings?
1GTpa of material is recycled globally, across steel, paper, glass, plastics and other metals. On average, 35% of these materials are produced from recycled feeds, saving 70% of the energy and CO2, with upside in the Energy Transition.
Download
Download
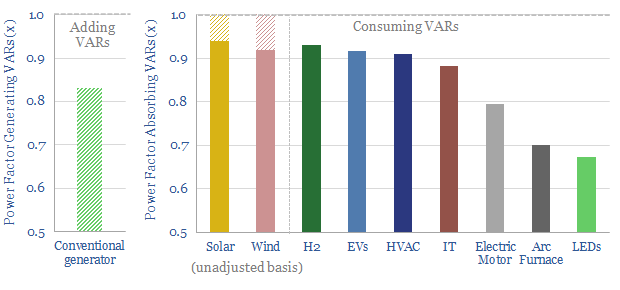
Capacitor banks: raising power factors?
Power factor corrections could save 0.5% of global electricity, with $20/ton CO2 abatement costs in normal times, and 30% pure IRRs during energy shortages. They will also be needed to integrate more new energies into power grids. This note outlines the opportunity in capacitor banks, their economics and leading companies.
Download
Download
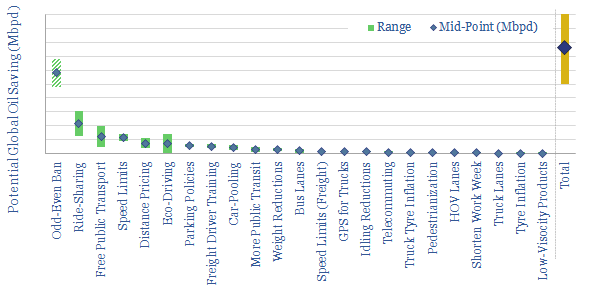
Oil demand: how much can you save in a crisis?
Oil consuming countries are encouraged to have emergency plans to save 7-10% of their demand in a crisis. This data-file outlines how. c10Mbpd could be saved globally. But it requires extreme measures. Largest are odd-even rationing, ride-sharing, free public transit and lower highway speed limits.
Download
Download
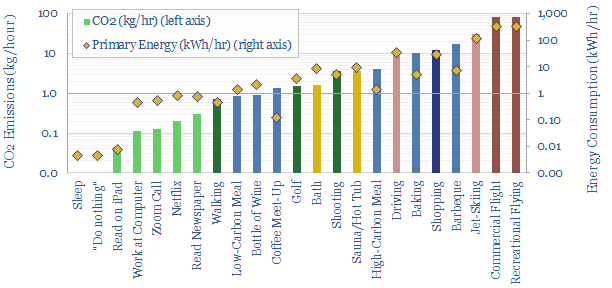
CO2 emissions per hour of activity?
The purpose of this data-file is to tabulate our best estimates for the CO2 associated with different activities. The average US person emits about 2.2kg of CO2e per hour. Food and transport choices have a large impact. Among the lowest carbon is reading at home on a tablet.
Download
Download
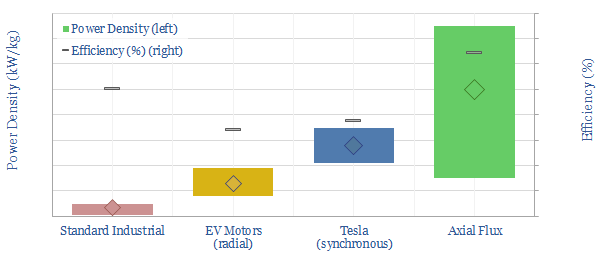
Electric motors: state of flux?
This 15-page note explores whether axial flux motors could come to dominate in the future of transportation. They promise 2-3x higher power densities, even versus Tesla’s world-leading PMSRMs; and 10-15x higher than clunky industrial AC induction units; while also surpassing c96% efficiencies.
Download
Download
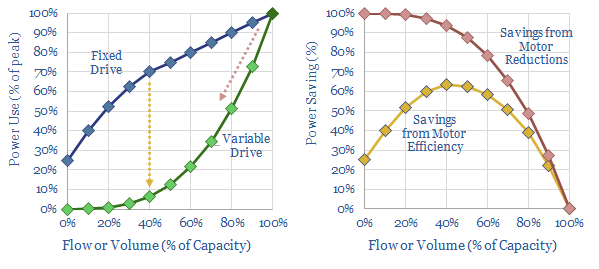
Electric motors: variable star?
Variable frequency drives precisely control motors. Amazingly they could reduce global electricity demand by c10%. We expect a sharp acceleration due to sustained energy shortages, increasingly renewable-heavy grids and excellent 20-50% IRRs. Hence this 14-page note reviews the opportunity and who benefits.
Download
Download
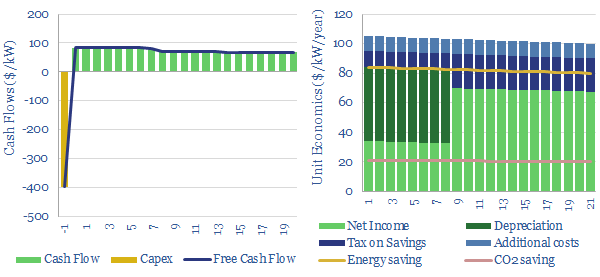
Variable frequency drives: the economics?
Variable frequency drives optimize the operating speeds of electric motors. Average energy saving are 34% and average costs are $250/kW. Hence our modelling calculates >15% IRRs installing a VFD at a typical industrial motor. This data-file captures the economics.
Download
Download
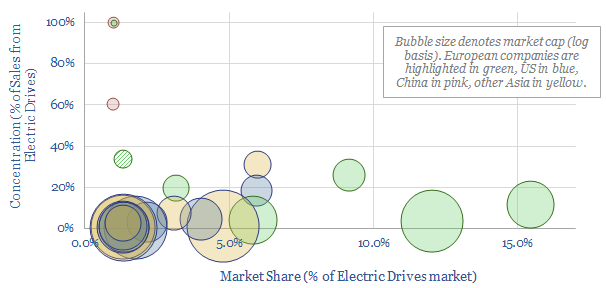
Variable frequency drives: leading companies?
This data-file outlines the top twenty companies producing variable frequency drives to precisely control electric motors. The top three companies are European capital goods players. High-quality VFDs may protect against growing competition from China.
Download
Download
Aspen Aerogels: insulation breakthrough?
Aerogels have thermal conductivities that are 50-80% below conventional insulators. Target markets include preventing thermal runaway in electric vehicle batteries and cryogenic industrial processes (e.g., LNG). This data-file notes some challenges, using our usual patent review framework.
Download
Download
Insulation: deliver us from gas shortages?
Insulating materials slow the flow of heat from a warm house by 30-100x. But 60-90% of today’s housing stock is 30-70% under-insulated. We think renovation rates could treble as gas shortages re-prioritize energy savings. This 12-page note screens who might benefit.
Download
Download
Heat pumps: hot and cold?
Some policymakers now aspire to ban gas boilers and ramp heat pumps 10x by 2050. In theory, the heat pump technology is superior. But in practice, there are ten challenges. It could become a political disaster. The most likely outcome is a 0-2% pullback in European gas by 2030.
Download
Download
Heat pumps: a screen of providers and reviews?
This data-file tabulates our subjective opinions on c20 different heat pump companies, based on their consumer reviews, pricing, reliability, efficiency, company size, models, integration, and visual/acoustic properties. We conclude heat pumps are opaque and must be selected carefully.
Download
Download
Absorption chillers: the economics?
This data-file approximates the costs of absorption chillers, which perform the thermodynamic alchemy of converting waste heat (e.g., from a CHP turbine) into coldness. This will be increasingly important to shore up future, renewables-heavy grids. 10% IRRs can also be generated with $50/ton CO2 abatement costs.
Download
Download
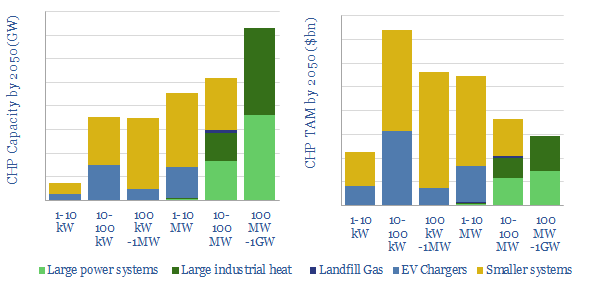
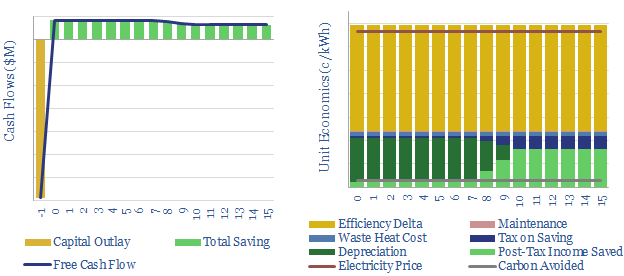
Combined heat and power turbines: market sizing?
The purpose of this data-file is to ballpark the ultimate potential market size for combined heat and power systems in the US (CHPs). Our build-up looks across five main categories: large power facilities, large industrial heating facilities, landfill gas, electric vehicle charging and smaller-scale commercial and multi-family usage.
Download
Download
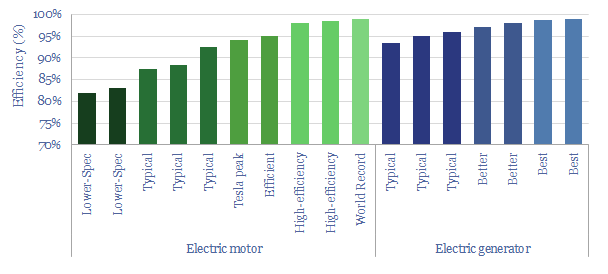
Energy efficiency of motors and power generators?
This data-file estimates the efficiency of electric motors and power generators, using specific examples and data-points. This matters as there are around 50bn motors in the world, consuming c45% of global electricity. Efficiency ratings are generally high, above 90%, although lagging and non-optimized motors can be in the 70-80% range.
Download
Download
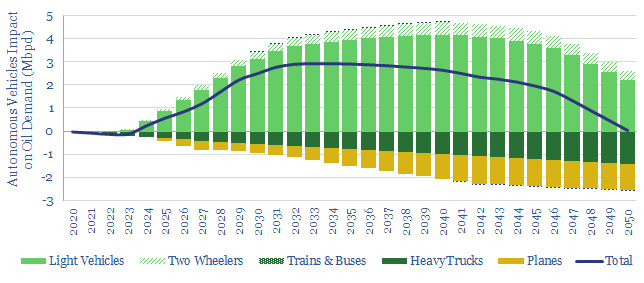
Oil demand: the rise of autonomous vehicles?
We are raising our medium-term oil demand forecasts by 2.5-3.0 Mbpd to reflect the growing reality of autonomous vehicles. AVs improve fuel economy in cars and trucks by 15-35%, and displace 1.2Mbpd of air travel. But their convenience also increases travel. This note outlines the opportunity.
Download
Download
Autonomous vehicles: technology leaders?
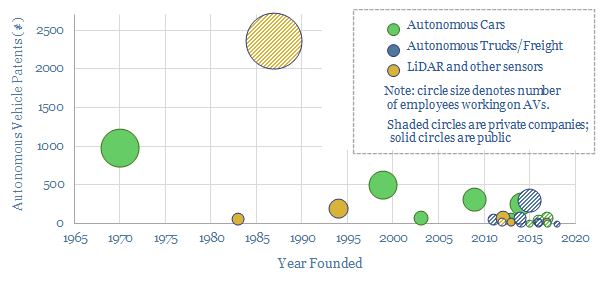
We have screened 25 leading companies in autonomous vehicles (public and private), tabulating their technical progress and proposals for Level 4-5 autonomy. 75% of the companies were founded in the last decade. Leaders are focused on freight, cars, taxis and LiDAR sensing.
Download
Download
Cost and CO2 intensity of home cooking technologies?
The most important determinant of cooking's CO2 intensity is consumer behaviour. At today's energy costs and grid mix, gas-fired cooking yields the lowest costs. Sometimes electrification of cooking will decrease CO2 and sometimes not. Electric induction is most efficient, but 2-3x more expensive than gas and electric hobs.
Download
Download
Industrial heating technologies: an overview?
This data-file summarizes over a dozen industrial heating technologies, including their temperatures, efficiency, advantages and challenges. Generally 90% of incoming energy can be converted to industrial process heat and c40% achieves useful exergetic output. But ranges very broadly from 10-90%.
Download
Download
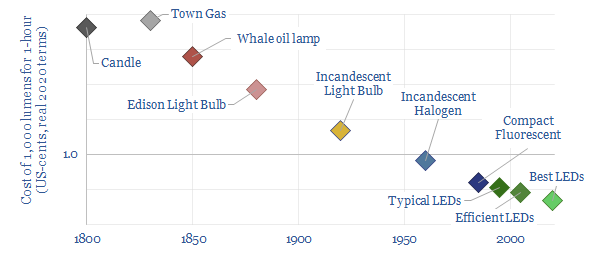
Lighting: historical costs and energy efficiency?
This data-file assesses lighting solutions throughout history, from candles, to whale oil, to incandescent bulbs, to modern LEDs. Overall, the best LEDs now achieve over 80% useful energy efficiency. Lighting costs have improved by 100x over the past century, while efficiency has improved 13x.
Download
Download
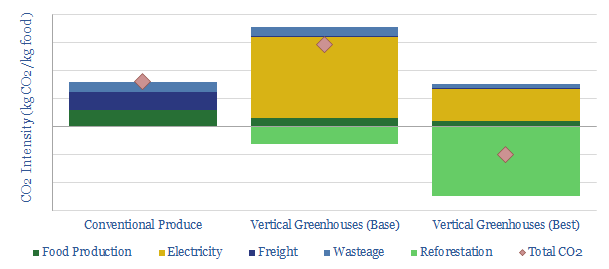
Vertical greenhouses: what future in the transition?
Vertical greenhouses achieve 10-400x greater yields per acre than field-growing, stacking layers of plants indoors, and illuminating each layer with LEDs. Economics are exciting. CO2 intensity varies. But it can be carbon-negative if powered by renewables. This 17-page case study outlines the opportunity.
Download
Download
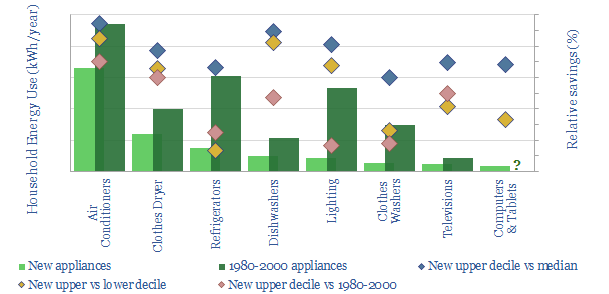
Energy efficiency of household appliances?
We estimate a house equipped with the best modern appliances will likely have 60% lower energy demand versus 30-years ago. 40% is from improvements over time, and 20% is from choosing the best modern appliances in each category. We present 20,000 data-points across eight categories.
Download
Download
Vehicles
Vehicles: energy transition conclusions?
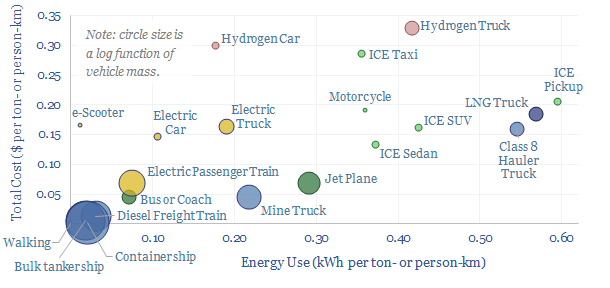
Vehicles transport people and freight around the world, explaining 70% of global oil demand, 30% of global energy use, 20% of global CO2e emissions. This overview summarizes all of our research into vehicles, and key conclusions for the energy transition.
Download
Download
Mapping vehicle value chains?
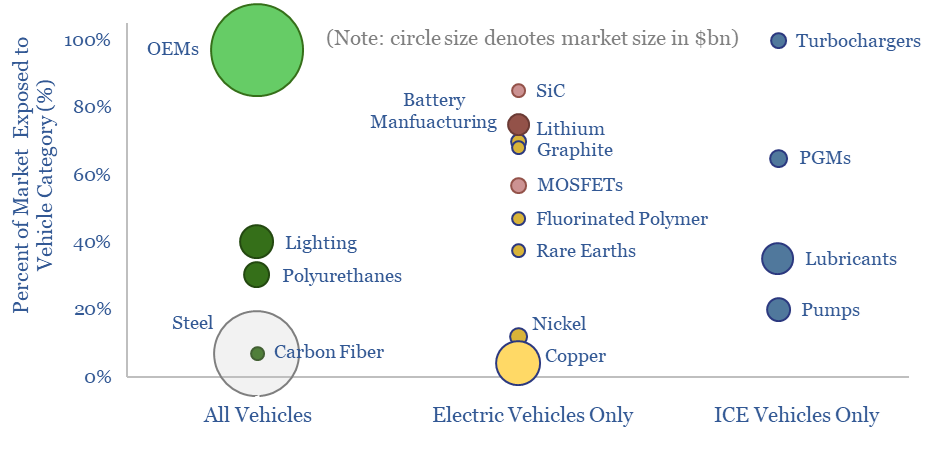
Who is impacted if vehicle sales, EVs or ICE volumes surprise? Autos are a $2.7 trn pa global market, a vast 2.5% of global GDP. 15% is gross margin for OEMs. The other 85% is spread across metals, materials and capital goods. Hence this 14-page note highlights 200 companies from our database of 1,500 companies. Some are geared to ICEs. Some to EVs. And some to both.
Download
Download
Global vehicle sales by manufacturer?
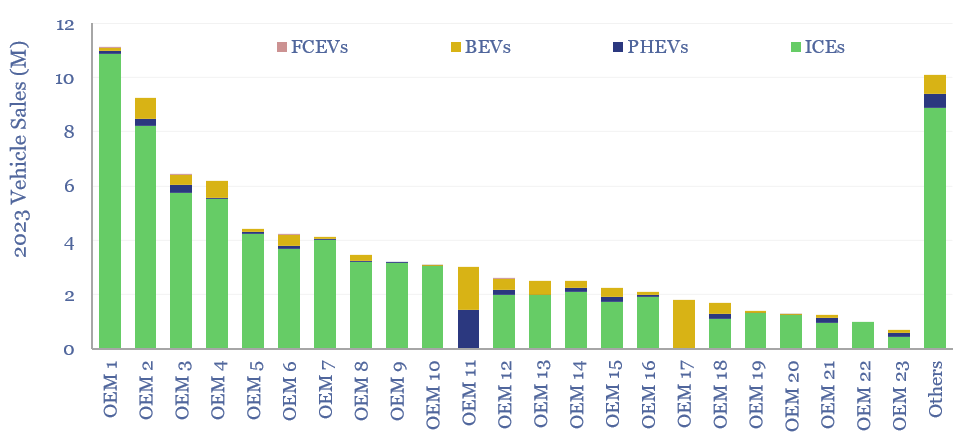
Global vehicle sales by manufacturer are broken down in this screen. 20 companies produce 85% of the world's vehicles, led by Toyota, VW, Stellantis, GM and Ford. The data-file contains key numbers and notes on each company, including each company's sales of BEVs, PHEVs, general EV strategy, and how it has been evolving in 2024.
Download
Download
Going platinum: PGMs in energy transition?
Could PGMs experience another up-cycle through 2030, on more muted EV sales growth in 2025-30, and rising catalyst loadings per ICE vehicle? This 16-page note explores global supply chains for platinum and palladium, the long-term demand drivers for PGMs in energy transition, and profiles leading PGM producers.
Download
Download
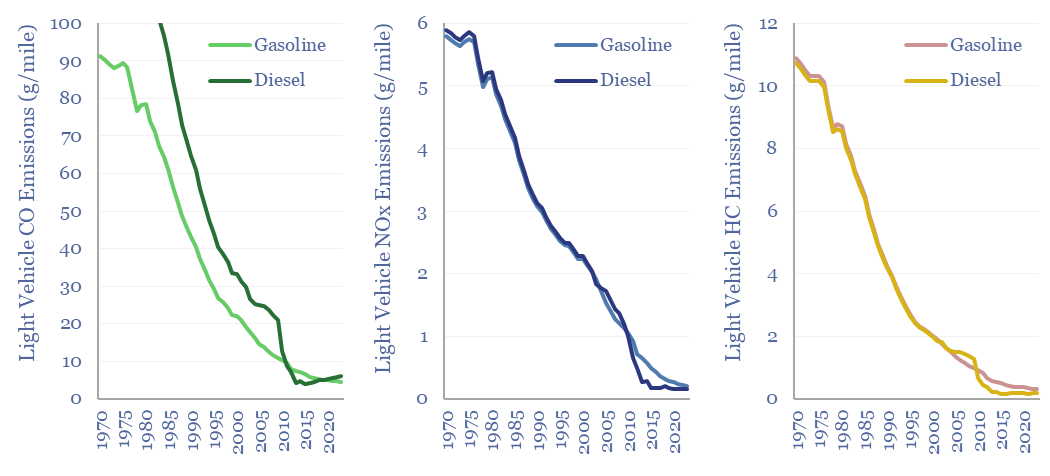
Vehicle emissions of CO, NOx and HCs?
There has been a remarkable reduction in the negative air quality impacts of combustion vehicles since 1970, as quantified in this data-file and over time. Vehicle emissions of CO, NOx and HCs have all fallen by 20-60x over the past 50-years, to 5 grams/mile, 0.2 grams/mile and 0.3 grams per mile, respectively. This data-file quantifies … Continue reading "Vehicle emissions of CO, NOx and HCs?"
Download
Download
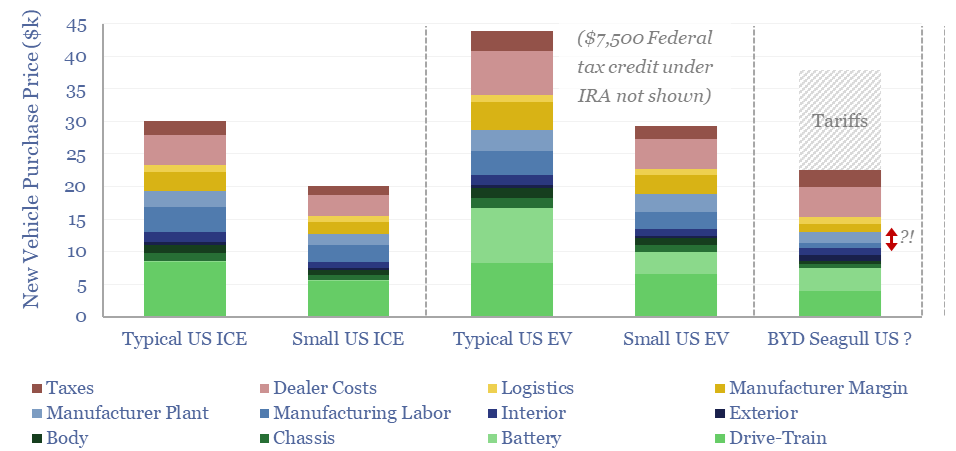
Electric vehicles: the road to cost parity?
Could electric vehicles deflate towards cost parity with ICEs in 2025-30, helping to re-accelerate EV adoption? This 13-page report contains a granular sum-of-the-parts cost breakdown for EVs vs ICEs. Then we consider battery deflation, power train deflation, small urban EVs, tax incentives, and the representativeness of low-cost Chinese EVs.
Download
Download
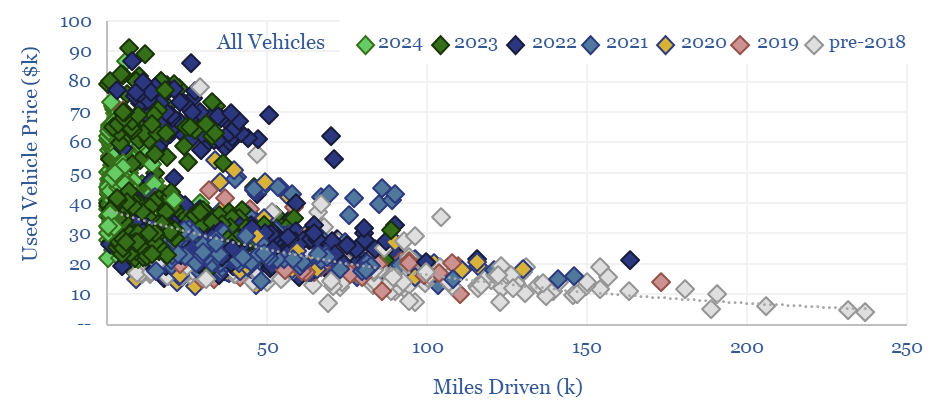
Vehicle depreciation rates: EVs versus ICEs?
This data-file quantifies the cost per mile of vehicle ownership across different categories by correlating second hand car prices with their accumulated mileage. Hybrids and regular passenger cars are most economical. SUVs and EVs are 2x more expensive. Hydrogen vehicles depreciate fastest and will have lost over 90% of their value after 100,000 miles.
Download
Download
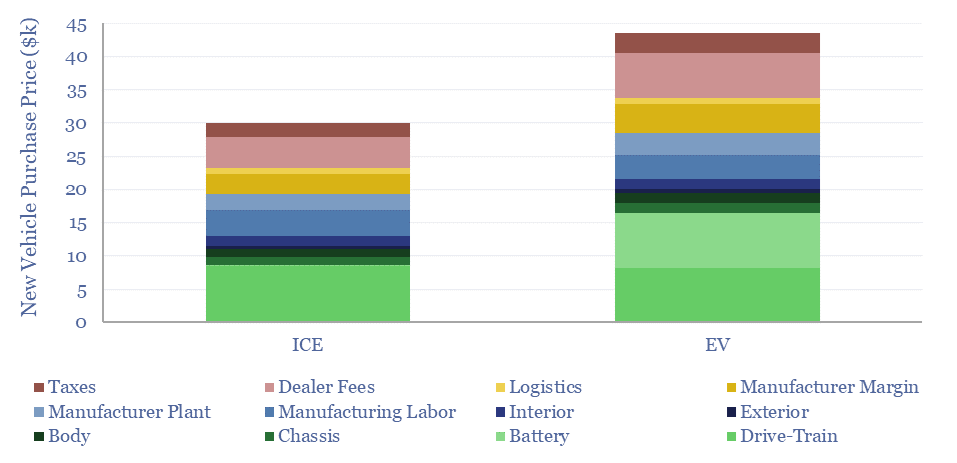
Electric vehicle cost breakdown by component?
This data-file disaggregates the $30k total cost of a typical new ICE and the c$45k total cost of a typical new EV, as a sum-of-the-parts, across 25 cost lines. Drivetrain costs are similar at $8-9k each. The key challenge for the EV is the battery. The electric vehicle cost breakdown shows promise for improving power electronics and smaller batteries.
Download
Download
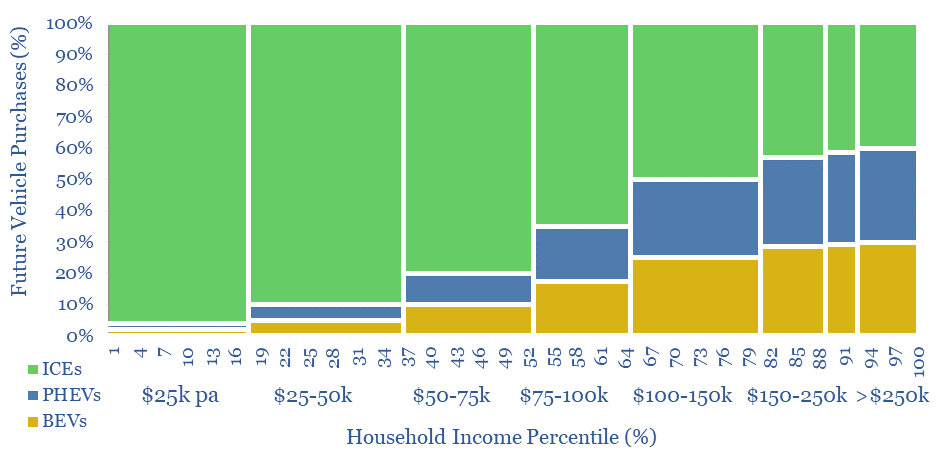
Electric vehicles: saturation point?
Energy transition technologies are often envisaged to follow S-curves: rapidly inflecting, then reaching 100% market adoption. However, this 17-page report argues electric vehicles will more likely saturate at 15-30% of sales in 2025-30. EVs were already at 15% of sales in 2023. So what would the more limited EV upside mean for energy and materials?
Download
Download
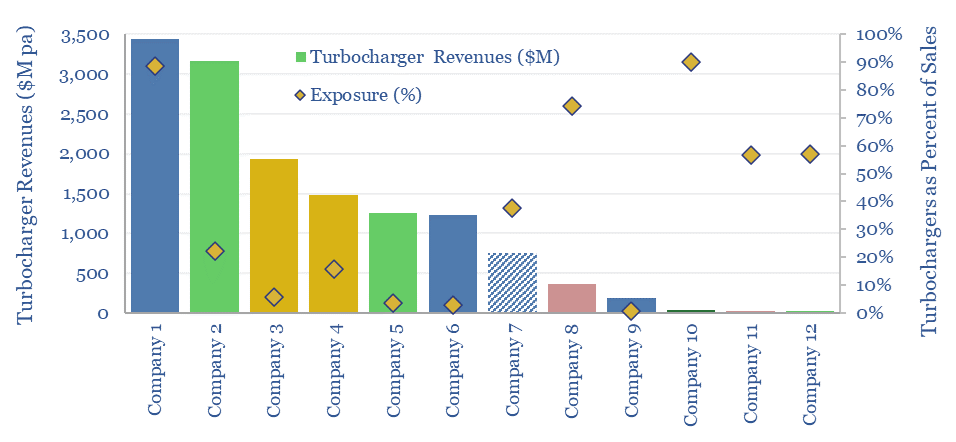
Turbochargers: leading companies?
Six leading companies in turbochargers control two-thirds of the $15-20bn pa global turbochargers market. 55% of ICE vehicles now have turbochargers, which can improve fuel economy my as much as 10%, by enabling smaller and better utilized engines to achieve higher peak power ratings. What opportunities ahead, to adapt for vehicle electrification, or even if EV sales accelerate less than expected in 2025-30?
Download
Download
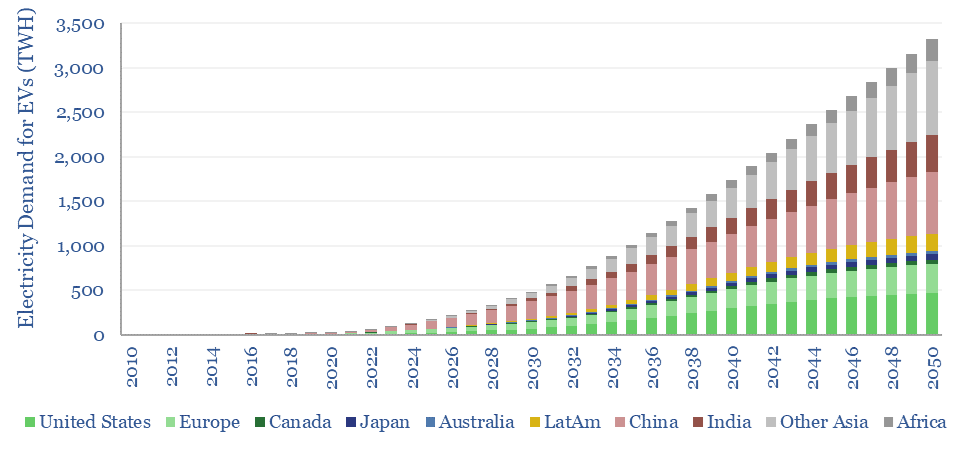
Electricity demand for electric vehicles?
Global electricity demand for electric vehicles will rise from 120TWH in 2024 to 500 TWH in 2030 and 3,300 TWH in 2050, ultimately adding 11% upside to today's global electricity demand, as part of our roadmap to net zero. This data-file quantifies electricity demand for EVs by region and over time, including data into the real-world fuel economy of EVs.
Download
Download
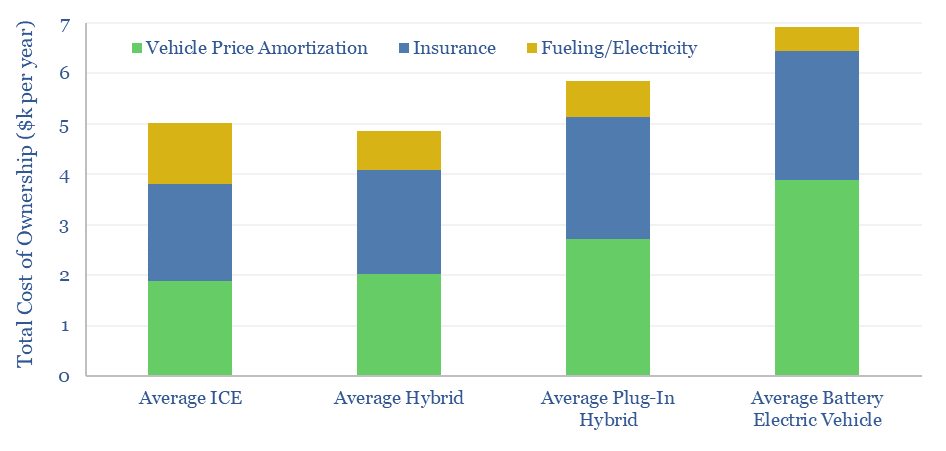
Electric vehicles: total cost of ownership?
Electric vehicles' total cost of ownership remains 40% higher than ICE vehicles, at $7,000 per year, versus $5,000 per year, all based on the latest 2024 data, for 50 vehicles. Electric vehicle up-front prices are 55% higher, insurance costs are 30% higher, while energy costs are 60% lower. 20 different pricing metrics are compared and contrasted in this data-file.
Download
Download
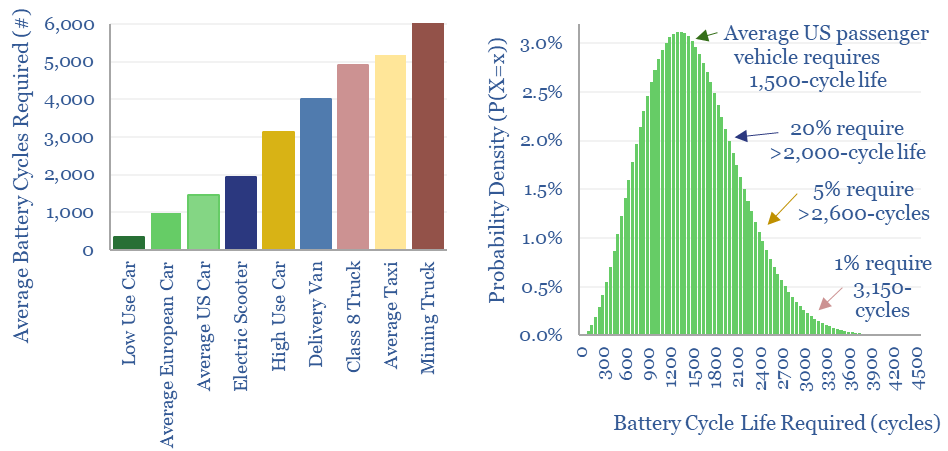
Electric vehicle: battery life?
Electric vehicle battery life will realistically need to reach 1,500 cycles for the average passenger vehicle, 2,000-3,000 cycles after reflecting a margin of safety for real-world statistical distributions, and 3,000-6,000 cycles for higher-use commercial vehicles. This means lithium ion batteries may be harder to displace with novel chemistries?
Download
Download
Electric vehicles: breaking the ICE?
Electric vehicles are a world-changing technology, 2-6x more efficient than ICEs, but how quickly will they ramp up to re-shape global oil demand? This 14-page note finds surprising ‘stickiness’. Even as EV sales explode to 200M units by 2050 (2x all-time peak ICE sales), the global ICE fleet may only fall by 40%. Will LT oil demand surprise to the upside or downside?
Download
Download
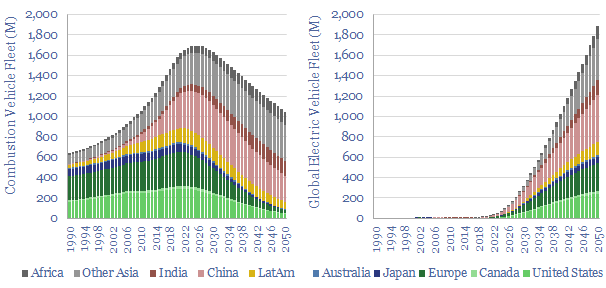
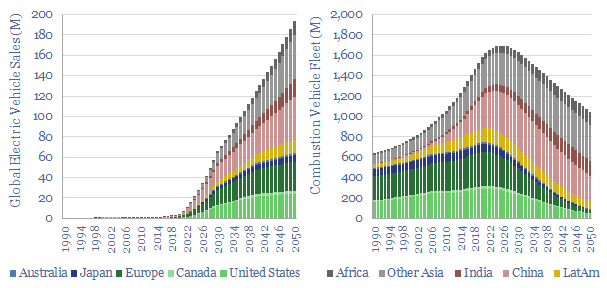
Global vehicle fleet: vehicle sales and electrification by region?
We have modeled the global light vehicle fleet, light vehicle sales by region, and the world's shift from internal combustion engines (ICEs) towards electric vehicles (EVs) through 2050. Our base case model sees almost 200M EV sales by 2050, and a c40% decline to around 1bn combustion vehicles in the world's fleet by 2050.
Download
Download
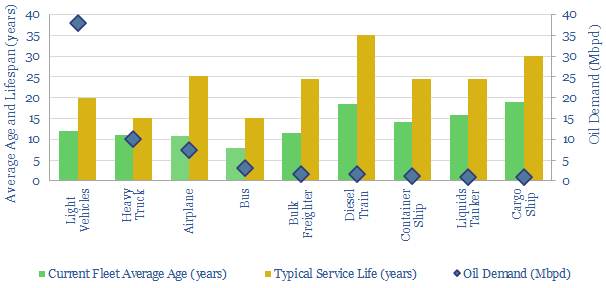
Vehicle fleets: service life and retirement age by vehicle type?
The weighted-average combustion vehicle in the world has a current age of 12-years and an expected service life of 20-years. In other words, a new combustion vehicle entering the global fleet in 2023 will most likely be running through 2043. Useful data and notes are compiled overleaf.
Download
Download
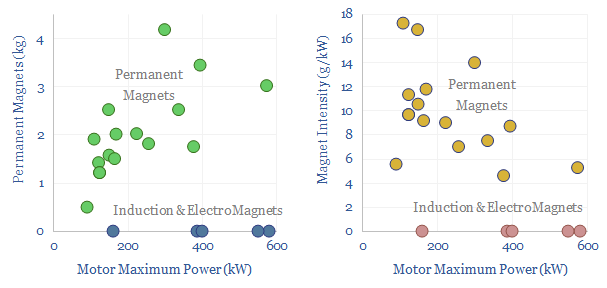
Electric vehicles: motors and magnets?
This data-file assesses electric vehicle magnets, permanent magnets and the use of Rare Earth materials such as neodymium (NdFeB). 80-90% of recent EVs have used Rare Earth permanent magnets, averaging 1.5 kg per vehicle, or 7.5g/kW of drive-train power, across the data-file. But the numbers vary vastly. From 0-4 kg per vehicle. 20 vehicles from different OEMs are tabulated in the data-file.
Download
Download
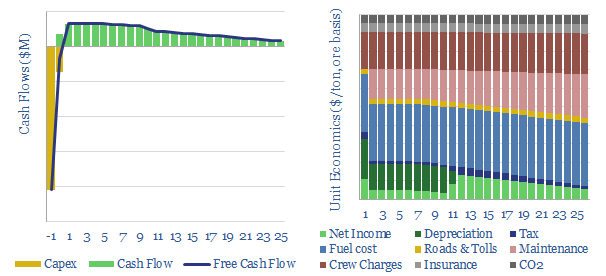
Bulk shipping: cost breakdown?
Bulk carriers move 5GTpa of commodities around the world, explaining half of all seaborne global trade. This model is a breakdown of bulk shipping cost. We estimate a cost of $2.5 per ton per 1,000-miles, and a CO2 intensity of 5kg per ton per 1,000-miles. Marine scrubbers increasingly earn their keep and uplift IRRs from 10% to 12% via fuel savings.
Download
Download
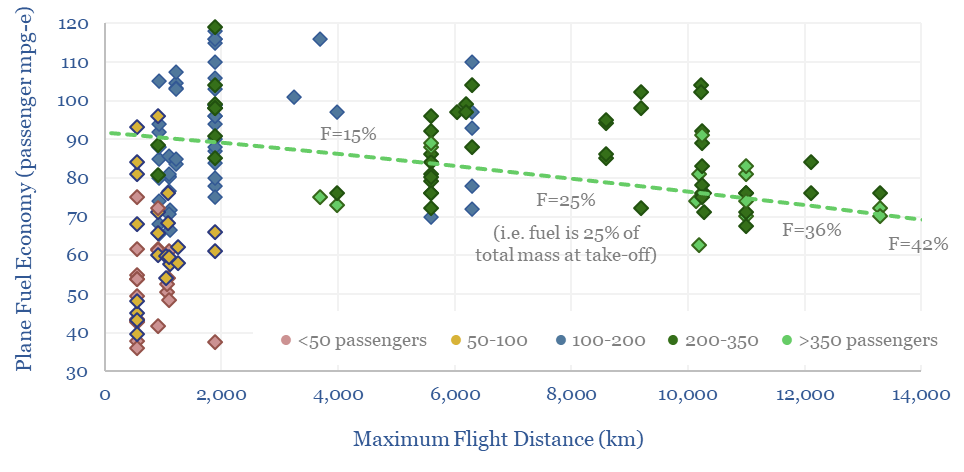
Commercial aviation: fuel economy of planes?
This data-file calculates the fuel economy of planes from first principles, using physics to calculate lift and drag, and comparing with actual data from aircraft manufacturers. The typical fuel economy of a plane is 80 passenger-mpg to carry 400 passengers, 8,000km at 900kmph, using jet fuel with 12,000 Wh/kg energy density. What sensitivities and decarbonization opportunities?
Download
Download
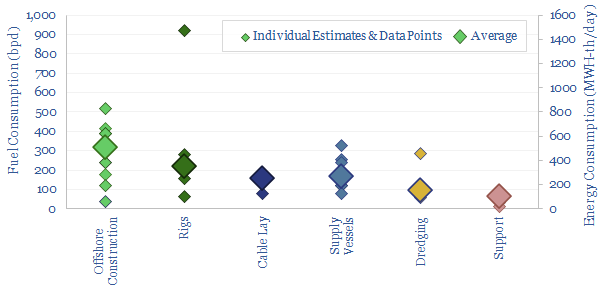
Offshore vessels: fuel consumption?
This database tabulates the typical fuel consumption of offshore vessels, in bpd and MWH/day. We think a typical offshore construction vessel will consume 300bpd, a typical rig consumes 200bpd, supply vessels consume 150bpd, cable-lay vessels consume 150bpd, dredging vessels consume 100bpd and medium-sized support vessels consume 50bpd. Examples are given in each category, with typical variations in the range of +/- 50%.
Download
Download
Hillcrest: ZVS inverter breakthrough?
Hillcrest Energy Technologies is developing an ultra-efficient SiC inverter, which has 30-70% lower switching losses, up to 15% lower system cost, weight, size, and thus interesting applications in electric vehicles. How does it work and can we de-risk the technology?
Download
Download
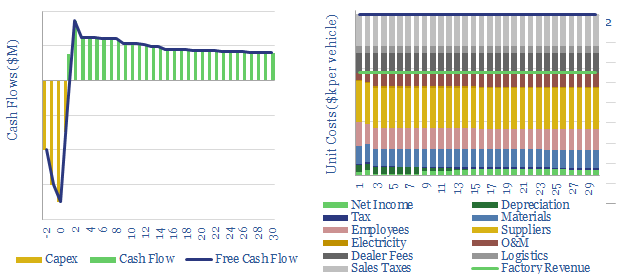
Auto manufacturing: the economics?
This is a simple model, to break down the $30k sales price of a typical mass-market automobile. c25% accrues to suppliers, c20% is sales taxes, c20% is dealer costs/logistics, c10% employees, c10% material inputs, c10% O&M, 1% electricity and c5% auto-maker margins. Prices may inflate 60% amidst industrial shortages.
Download
Download
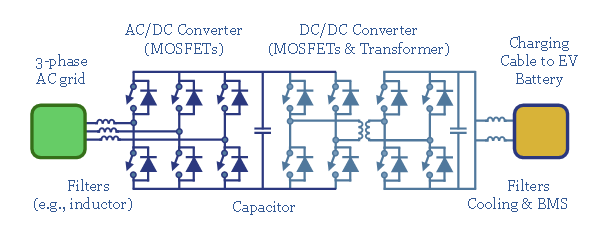
EV fast charging: opening the electric floodgates?
This 14-page note explains the crucial power-electronics in an electric vehicle fast-charging station, running at 150-350kW. Most important are power-MOSFETs, comprising c5-10% of charger costs. The market trebles by the late 2020s.
Download
Download
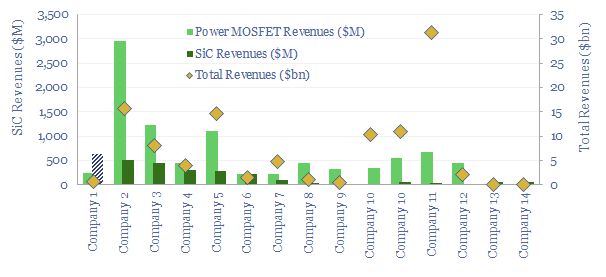
Power-MOSFETs: leading companies?
Power MOSFETs are an energy transition technology, the building block behind inverters, DC-DC converters, EV drive trains, EV chargers and other renewables-battery interfaces. Hence this data-file is a screen of companies making power MOSFETs, especially new and higher-efficiency devices using Silicon Carbide as the semi-conductor.
Download
Download
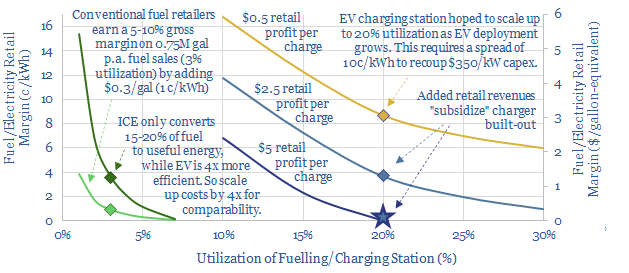
Electric vehicles: chargers of the light brigade?
This 14-page note compares the economics of EV charging stations with conventional fuel retail stations. Our main question is whether EV chargers will ultimately get over-built. Hence prospects may be best for charging equipment and component manufacturers.
Download
Download
Electric motors: state of flux?
This 15-page note explores whether axial flux motors could come to dominate in the future of transportation. They promise 2-3x higher power densities, even versus Tesla’s world-leading PMSRMs; and 10-15x higher than clunky industrial AC induction units; while also surpassing c96% efficiencies.
Download
Download
Axial flux motors: leading companies and products?
This data-file profiles leading companies and products in the space of axial flux motors, with an average power density of almost 8kW/kg, which is 10x higher than a typical AC induction motor in heavy industry. Leading companies are profiled, based on reviewing over 1,200 patents.
Download
Download
Mine trucks: transport economics?
There are around 50,000 giant mining trucks in operation globally. The largest examples are 15m long, 10m wide, 8m high, can carry around 350-450 tons and reach top speeds of 40mph. This data-file captures the economics, costs and inflationary impacts of decarbonization.
Download
Download
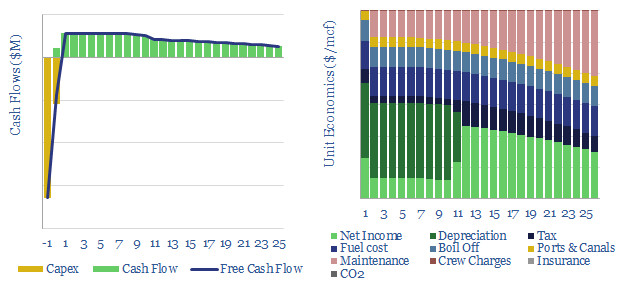
LNG transport: shipping economics?
This data-file breaks down the cost of shipping cryogenic cargoes in seaborne tankers. LNG costs $1-3/mcf. The most important input variable is transport distance. Although switching to e-fuels (green hydrogen, ammonia, methanol) can double total cost.
Download
Download
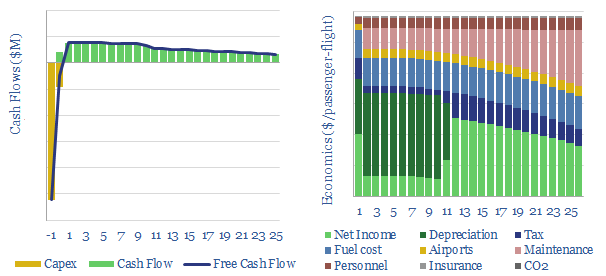
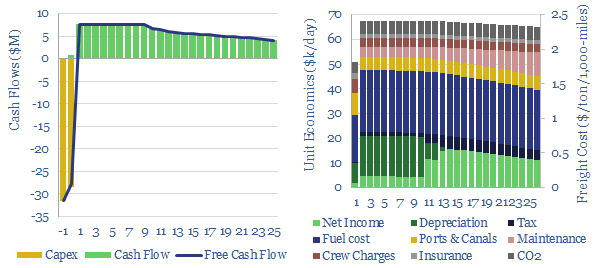
Commercial aviation: air travel economics?
This data-file estimates the economics of a passenger jet, over the course of its life: i.e., what ticket price must be charged to earn a 10% IRR after covering the capex costs of the plane, fuel costs, crew, maintenance and airport and air traffic charges. Decarbonization is challenging.
Download
Download
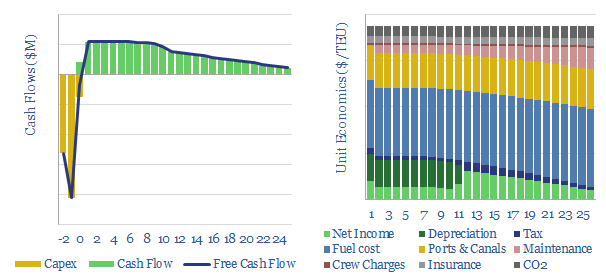
Container freight: shipping economics?
This data-file models the total costs of shipping a container c10,000 nautical miles from China to the West, in a 20,000 TEU vessel. Emerging fuels can lower the CO2 intensity of shipping from their baseline of 0.15kg/TEU-mile, by 60-90%, but freight costs inflate by 30%-3x.
Download
Download
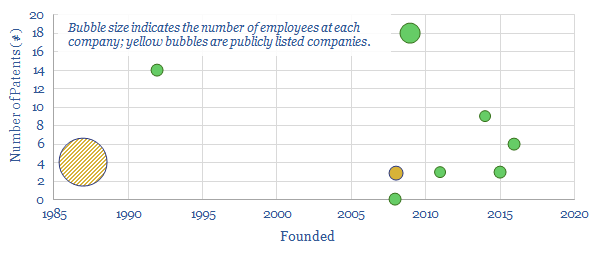
ChargePoint: electric vehicle charging edge?
ChargePoint is the leading provider of Level 2 EV charging stations in the US and aims to help electrify mobility and freignt. Our review finds a library of simple, clear, specific and easy-to-understand patents. More debatable are the technology edge and future IP defensability.
Download
Download
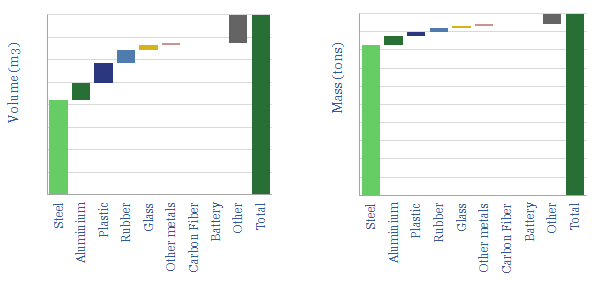
Vehicle mass: what opportunities to improve fuel economy?
Steel comprises c50% of the volume and c80% of the weight of materials in a vehicle. Each 1% reduction in mass yields a 1% improvement in fuel econome. Carbon fiber repays its extra costs after 30-70k miles, while hybridisation repays its extra costs after 10-30k miles.
Download
Download
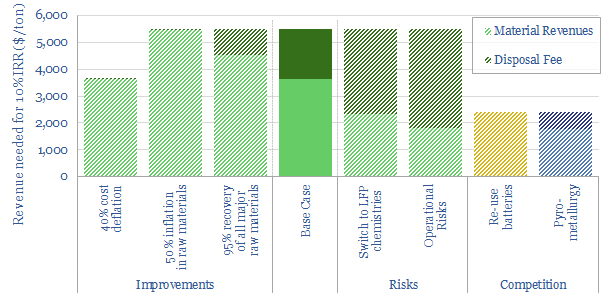
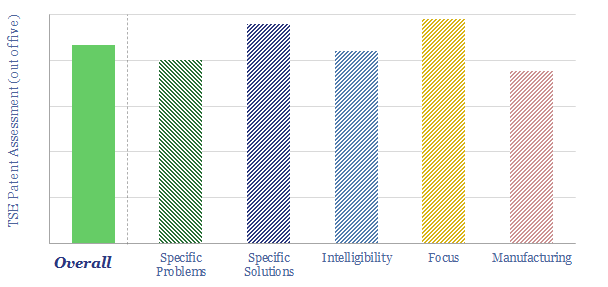
Battery recycling: long division?
Recycling lithium batteries could be worth $100bn per year by 2040 while supporting electric vehicles’ ascent. Hence new companies are emerging to recapture 95% of spent materials with environmentally sound methods. Our 15-page note explores what it would take for battery-recycling to become both practical and compelling.
Download
Download
Nio: EV-charging breakthrough?
Nio is a listed, electric vehicle manufacturer, headquartered in Shanghai. It operates over 200 "battery swap" stations, and the 2-millionth battery swap was completed in March-2021, with swap times soon falling to 3-minutes. Our patent analysis suggests a genuine moat in swappable batteries, which could only have been built up by an auto-maker.
Download
Download
Oil demand: the rise of autonomous vehicles?
We are raising our medium-term oil demand forecasts by 2.5-3.0 Mbpd to reflect the growing reality of autonomous vehicles. AVs improve fuel economy in cars and trucks by 15-35%, and displace 1.2Mbpd of air travel. But their convenience also increases travel. This note outlines the opportunity.
Download
Download
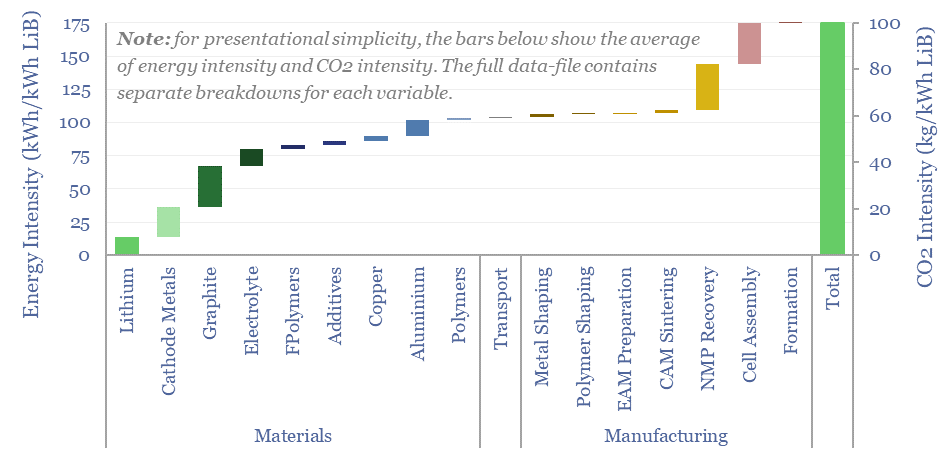
Energy costs of lithium ion batteries?
This data-file estimates the energy costs of lithium ion batteries across 17 lines. Our best estimate in 2024 is that manufacturing 1 kWh of lithium ion batteries requires 175 kWh of useful energy and emits 100kg of CO2. When a lithium ion battery is used in an electric vehicle, these up-front energy and CO2 costs should be repaid 10x over.
Download
Download
Autonomous vehicles: technology leaders?
We have screened 25 leading companies in autonomous vehicles (public and private), tabulating their technical progress and proposals for Level 4-5 autonomy. 75% of the companies were founded in the last decade. Leaders are focused on freight, cars, taxis and LiDAR sensing.
Download
Download
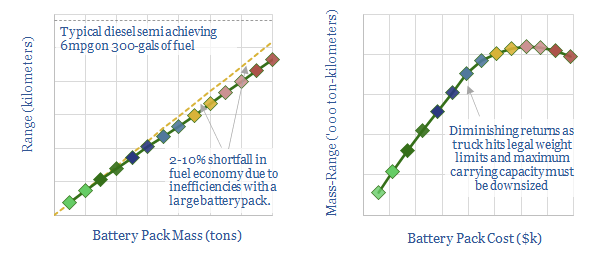
Electric trucks: what battery sizes?
An electric truck would need a 15 ton battery to match the c2,500-mile range of a diesel truck. However, larger batteries above c8-tons detract 10% from fuel economy and may cause trucks to exceed regulatory weight limits, lowering their payload capacities. 4-6 ton batteries with 700-1,000km ranges are optimal.
Download
Download
Electric vehicle charging: the economics?
This data-file models the economics of electric vehicle chargers, by disaggregating the costs of different charger types. Economics are most favorable where they lead to incremental retail purchases and for faster chargers. Economics are least favorable around apartments, charging at work and for slower charging speeds.
Download
Download
Metals
Going platinum: PGMs in energy transition?
Could PGMs experience another up-cycle through 2030, on more muted EV sales growth in 2025-30, and rising catalyst loadings per ICE vehicle? This 16-page note explores global supply chains for platinum and palladium, the long-term demand drivers for PGMs in energy transition, and profiles leading PGM producers.
Download
Download
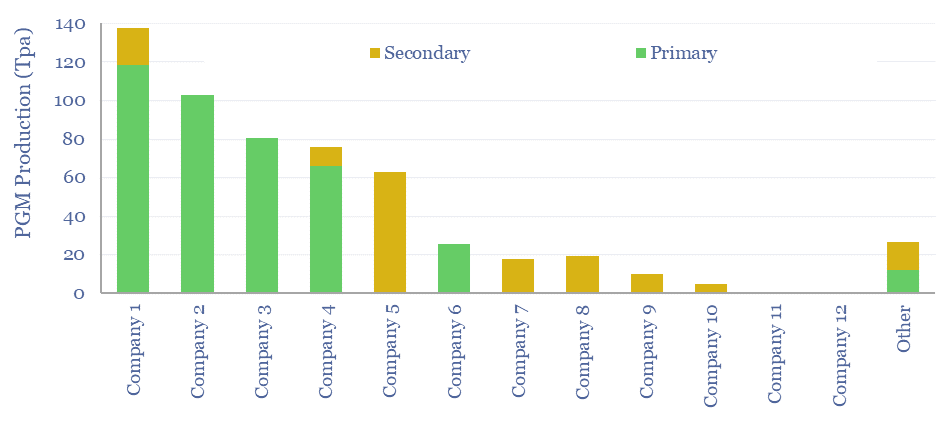
Leading PGM producers: mining, refining and recycling?
This data-file is a screen of leading PGM producers and recyclers. Eight companies control 90% of global production. Most are mid-caps. Four have primary listings in South Africa. Three are listed in Europe and the UK. Ore grades average 4 grams/ton, and recovery requires 60GWH/ton of energy, emitting 40kT/ton of CO2. But do recent company disclosures suggest that the gloom over PGMs is lifting?
Download
Download
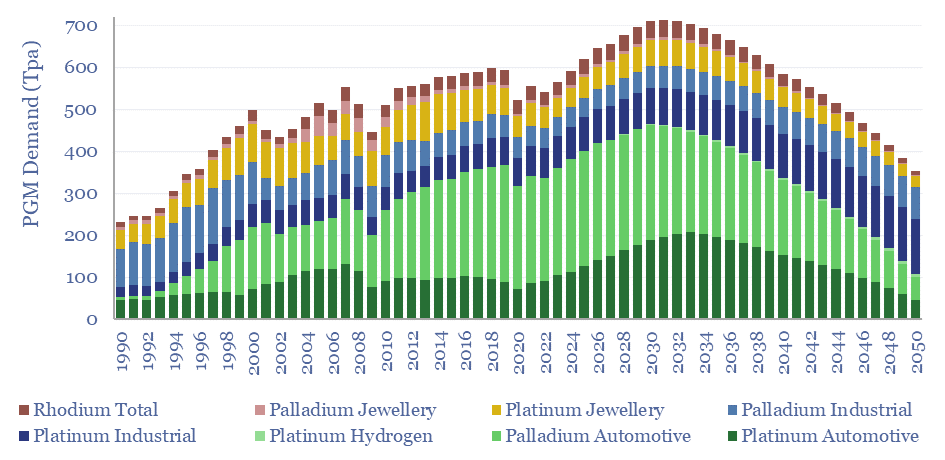
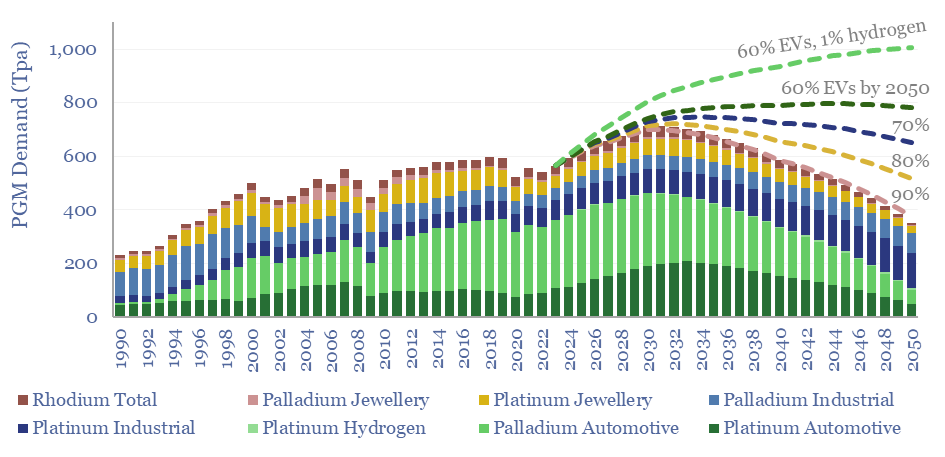
Global PGM demand: breakdown by metal and use?
Core global PGM demand ran at 565 tons in 2023, which remains c6% lower than the all-time peak demand of 600Tpa in 2019. We model a recovery to 700 Tpa of demand for platinum, palladium and rhodium in 2030, then a long run decline to 350Tpa if EVs ultimately reach 90% of vehicle sales by 2050. Numbers can be stress-tested in this model.
Download
Download
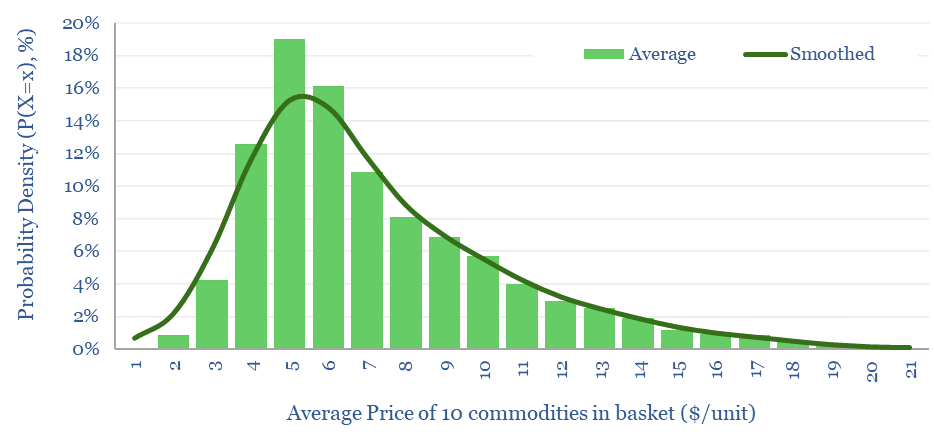
Commodity price volatility: energy, metals and ags?
Commodity price volatility tends to be lognormally distributed, based on the data from ten commodities, over the past 50-years. Means are 20% higher than medians. Skew factors average +1.5x. Standard errors average 50%, while more volatile prices have more upside skew.
Download
Download
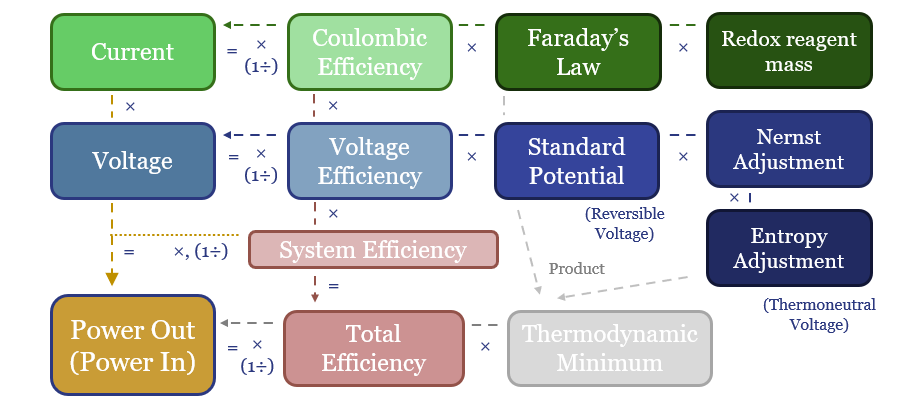
Electrochemistry: redox potential?
Batteries, electrolysers and cleaner metals/materials value chains all hinge on electrochemistry. Hence this 19-page note explains the energy economics from first principles. The physics are constructive for lithium and next-gen electrowinning, but perhaps challenge green hydrogen aspirations?
Download
Download
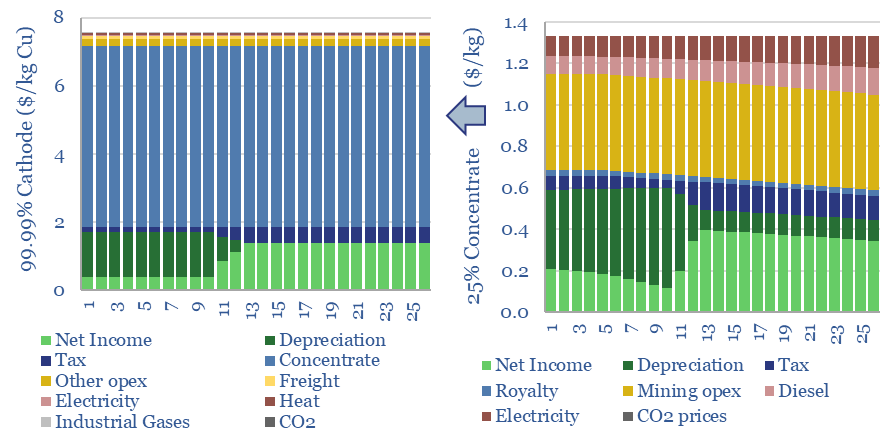
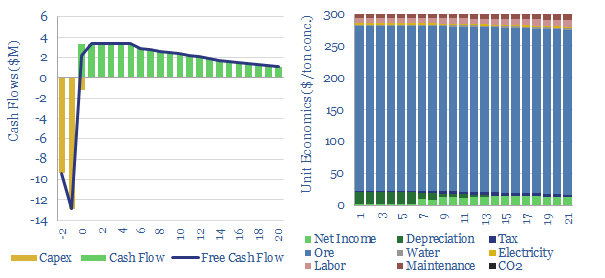
Copper: the economics?
The economic cost of copper production is build up from first princples in this model, from mine, to concentrator, to smelter to 99.99% pure copper cathodes. Our base case is $7.5/kg copper cathode, with 4 tons/ton CO2 intensity, after starting from an 0.57% ore grade. Numbers vary sharply and can be stress-tested in the data-file.
Download
Download
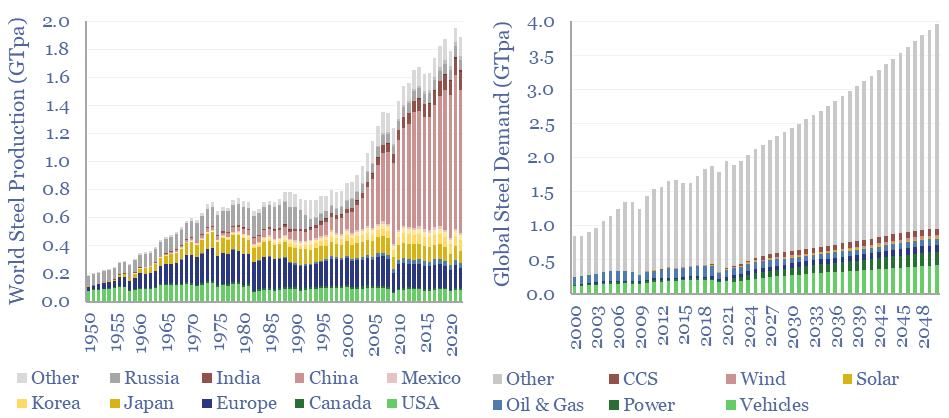
Global steel supply-demand model?
Global steel supply-demand runs at 2GTpa in 2023, having doubled since 2003. Our best estimate is that steel demand rises another 80%, to 3.6GTpa by 2050, including due to the energy transition. Global steel production by country is now dominated by China, whose output exceeds 1GTpa, which is 8x the #2 producer, India, at 125MTpa.
Download
Download
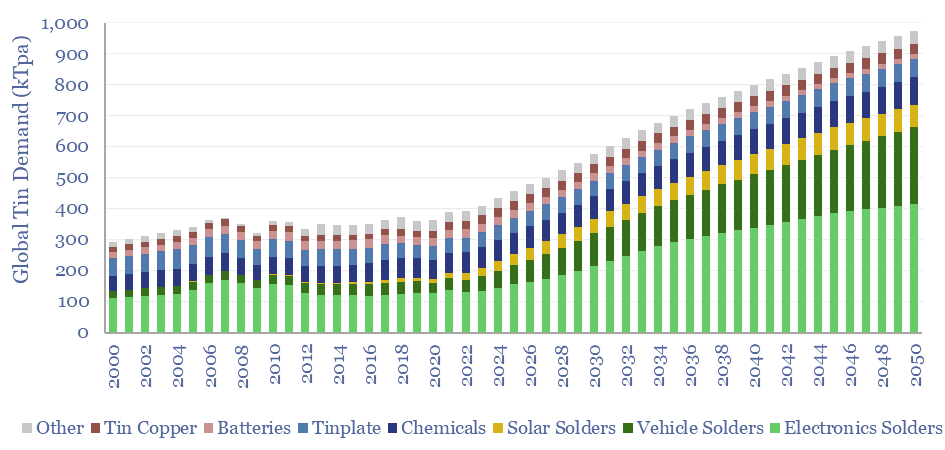
Global tin demand: upside in energy transition?
Global tin demand stands at 400kTpa in 2023 and rises by 2.5x to 1MTpa in 2050 as part of the energy transition. 50% of today's tin market is for solder, which sees growing application in the rise of the internet, rise of EVs and rise of solar. Global tin supply and demand can be stress-tested in the model.
Download
Download
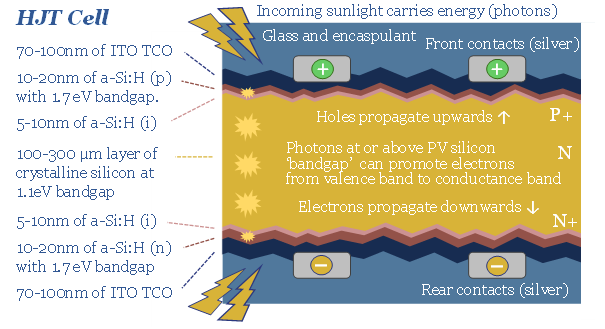
HJT solar: Indium summer?
HJT solar modules are accelerating, as they are highly efficient, and easier to manufacture. But HJT could also be a kingmaker for Indium metal, which is used in transparent and conductive thin films (ITO). Our forecasts see primary Indium use rising 4x by 2050. Indium is 100x rarer than Rare Earth metals. It could be a bottleneck. What implications?
Download
Download
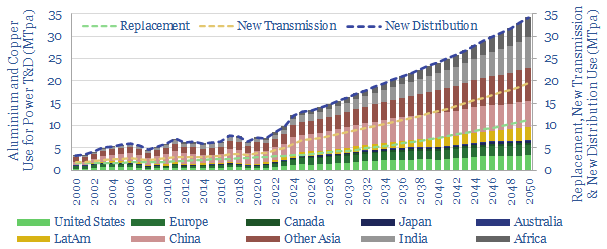
Power grids: down to the wire?
Power grid circuit kilometers need to rise 3-5x in the energy transition. This trend directly tightens global aluminium markets by over c20%, and global copper markets by c15%. Slow recent progress may lead to bottlenecks, then a boom? This 12-page note quantifies the rising demand for circuit kilometers, grid infrastructure, underlying metals and who benefits?
Download
Download
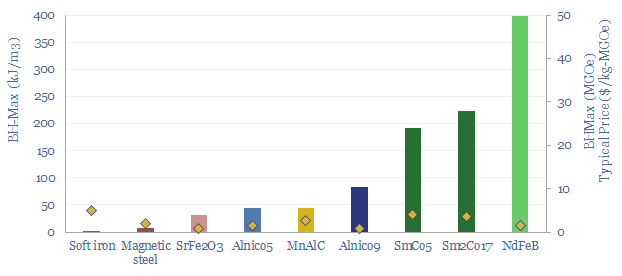
Magnets and energy: fundamental attraction?
Electric currents create magnetic fields. Moving magnets induce electric currents. These principles underpin 95% of global electricity, while 50% of wind turbines and 95% of electric vehicles use permanent magnets with Rare Earth metals. This 15-page overview of magnets explains key magnet concepts and controversies for the energy transition.
Download
Download
Blue steel: construction boom?
The DRI+EAF pathway already underpins 6% of global steel output, with 50% lower CO2 than blast furnaces. But could IRA incentives encourage another boom here? Blue hydrogen can reduce CO2 intensity to 75% below blast furnaces, and unlock 20% IRRs at $550-600/ton steel? This 13-page report explores the opportunity, and who benefits.
Download
Download
Electrasteel: renewable steel breakthrough?
Electra is developing an electrochemical refining process, to convert iron ore into high purity iron, and ultimately into steel, using only renewable electricity. It has raised c$100M, gained high-profile backers, and is working towards a test plant. This 9-page note reviews an exceptionally detailed patent, finds clear innovations, but also some remaining risks and cost question marks.
Download
Download
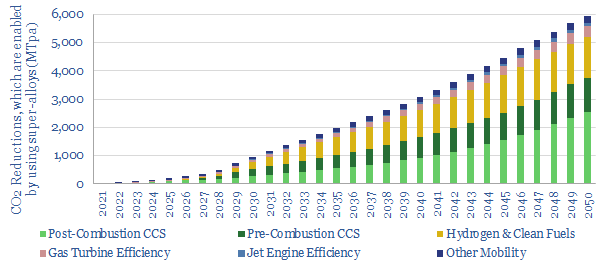
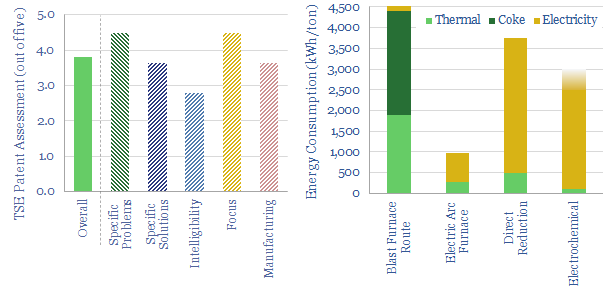
Super-alloys: what role in energy transition?
Super-alloys have exceptionally high strength and temperature resistance. They help to enable 6GTpa of decarbonization, across efficient gas turbines, jet engines (whether fueled by oil, hydrogen or e-fuels), vehicle parts, CCS, and geopolitical resiliency. Hence this 15-page report explores nickel-niobium super-alloys, energy transition upside, and leading companies.
Download
Download
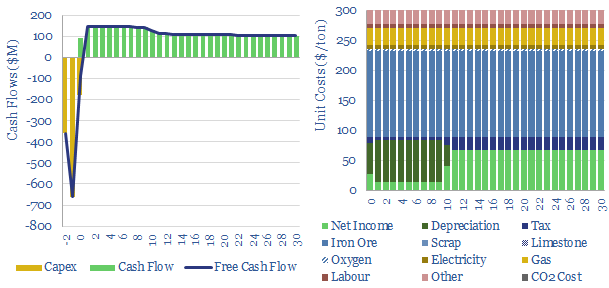
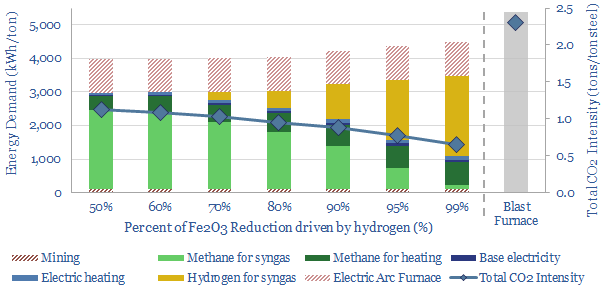
Direct reduced iron: costs and projects?
Direct reduced iron (DRI) is produced by reacting iron ore with H2-CO syngas, fueled by natural gas, in over 150 facilities worldwide. Direct reduction iron costs $300/ton, consuming 3,000kWh/ton of energy and CO2 intensity of 0.6 tons/ton. The process can be decarbonized via low-carbon hydrogen in the syngas, as the world strives towards decarbonized steel.
Download
Download
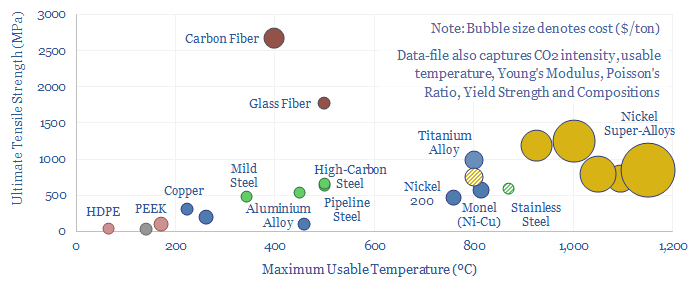
Metals and materials: strength and temperature resistance?
This data-file aggregates information into the strength, temperature resistance, rigidity, costs and CO2 intensities of important metals and materials. These are used in gas turbines, wind turbines, pipelines, CCS, power transmission.
Download
Download
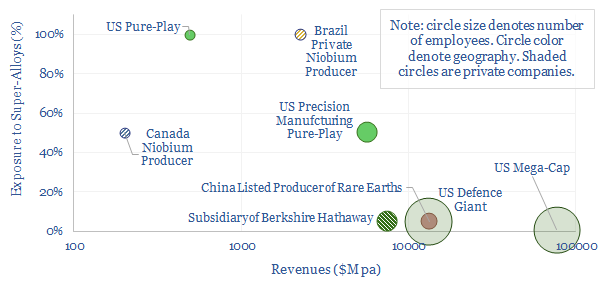
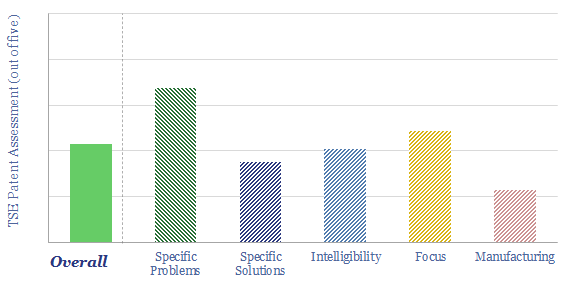
Leading companies in super-alloys?
This data-file is a screen of leading companies in super-alloys, covering US pure-plays, mega-caps in industrials and defence, and emerging world producers of Rare Earth metals. In each case, we have included our notes and observations.
Download
Download
Boston Metal: molten oxide electrolysis of steel?
Boston Metal aims to decarbonize steel, using molten oxide electrolysis, absorbing 4MWH/ton of steel. This data-file is a Boston Metal technology review, based on assessing 55 patents across 3 families. We were unable to de-risk the technology. A key challenge is conveying current into the cell, as it operates around 1,600C, which is above the melting point of most feasible conductor materials.
Download
Download
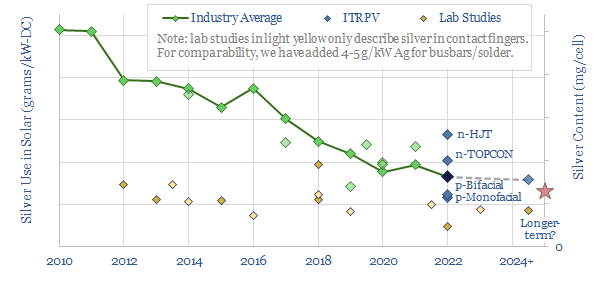
Solar surface: silver thrifting?
Ramping new energies is creating bottlenecks in materials. But how much can material use be thrifted away? This is a case study of silver intensity in the solar industry, which halved in the past decade, and could halve again. Conclusions matter for solar companies, silver markets, other bottlenecks.
Download
Download
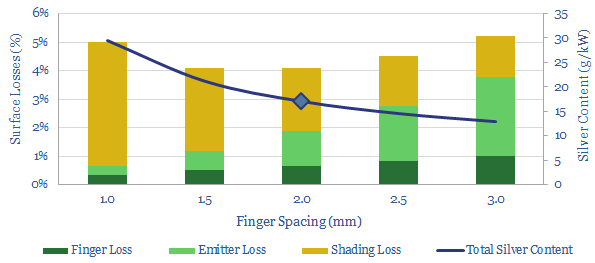
Model of losses in a solar cell: surface, emitter and shading?
This data-file calculates the losses in a solar cell from first principles. Losses on the surface of the cell are typically c4%, due to contact resistance, emitter resistance and shading. Sensitivity analysis suggests there may be future potential to halve silver content in a solar cell from 20g/kW to 10g/kW without materially increasing the losses beyond 4%.
Download
Download
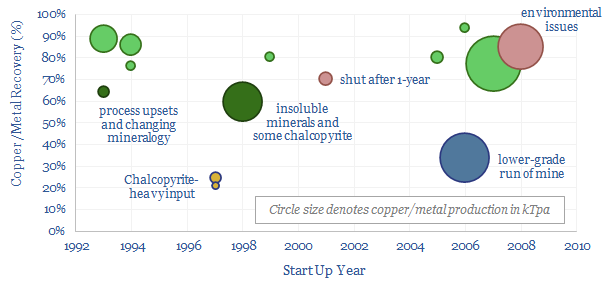
Bioleaching: case studies and examples?
Bioleaching uses bacteria to metabolize insoluble sulfides and iron complexes. It produces 20% of the world's copper; with 50% lower capex, at least 50% less CO2 and up to 80-90% recoveries; but it is currently limited to specific mineralogies. A prospect for the 2020s is that new technologies may unlock more minerals.
Download
Download
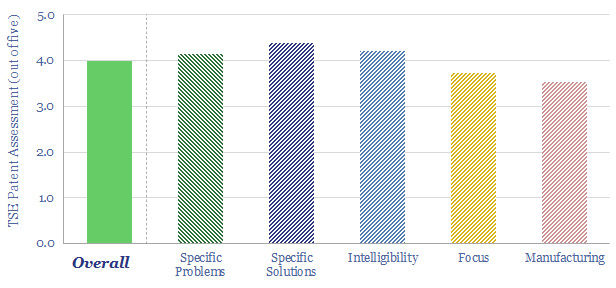
Jetti Resources: copper leaching breakthrough?
Jetti Resources has developed a breakthrough technology to recover copper from low-grade sulfide ores, by leaching with sulphuric acid, thiocarbonyls, ferric iron (III) sulphates and oxidizing bacteria. The patents lock up the technology, with detailed experimental data. But what are the costs of copper production, what CO2 intensity and what technical challenges remain?
Download
Download
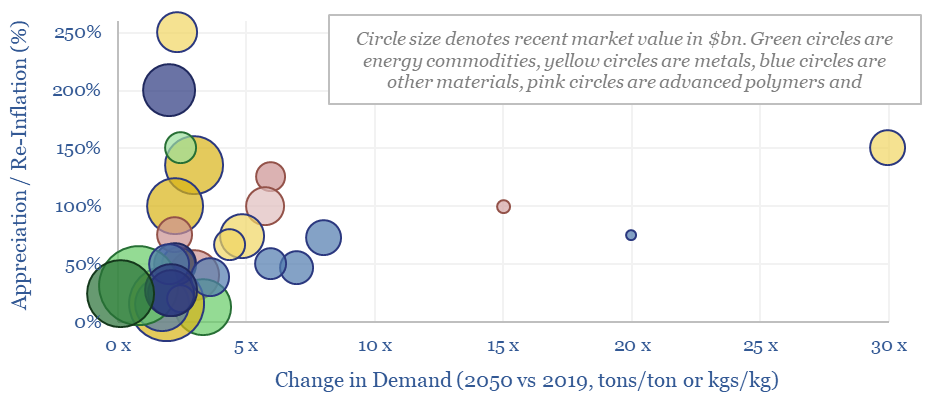
Energy transition: top commodities?
This data-file summarizes our latest thesis on ten commodities with upside in the energy transition. The average one will see demand rise by 3x and price/cost appreciate or re-inflate by 100%. The data-file contains a 6-10 line summary of our work into each commodity.
Download
Download
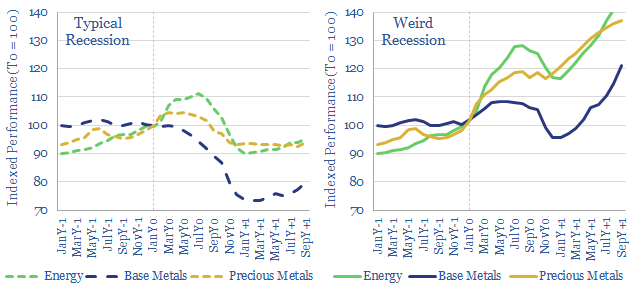
Weird recessions: can commodities de-couple?
In a ‘weird recession’, GDP growth turns negative, yet commodity prices continue surprising to the upside. This 10-page note explores three reasons that 2022-24 may bring a ‘weird recession’. There is historical precedent, prices must remain high to attract new investment and buyers may stockpile bottlenecked materials. How will this affect different industries?
Download
Download
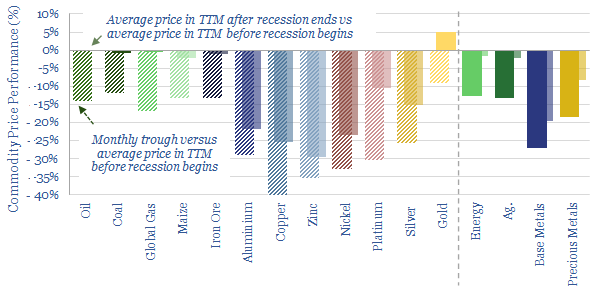
How do commodities perform during recessions?
How do commodities perform in recessions? Industrial metals are usually hit hardest, falling 35% peak-to-trough. Energy price spikes partly cause two-thirds of recessions, then typically trade back to pre-recession levels. Precious metals, mainly gold, tend to appreciate in financial crises. Data are compiled in this file, across recessions back to 1970.
Download
Download
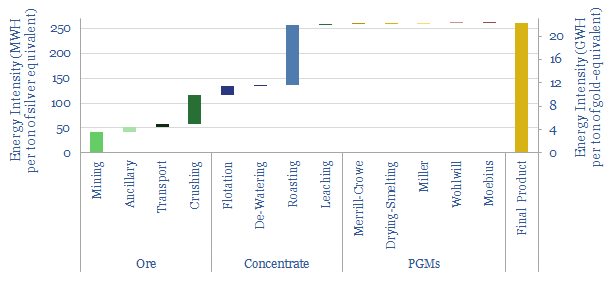
Silver and gold: medal winners?
Gold and silver are stores of value, especially in a world of persistently high inflation and low rates. Silver is also likely to be the main bottleneck for solar in the 2020s. Hence our 18-page note models the end-to-end mining and refining of these metals. We find very steep energy/CO2 curves, and fear supply shortages. What upside for well-run gold-silver incumbents?
Download
Download
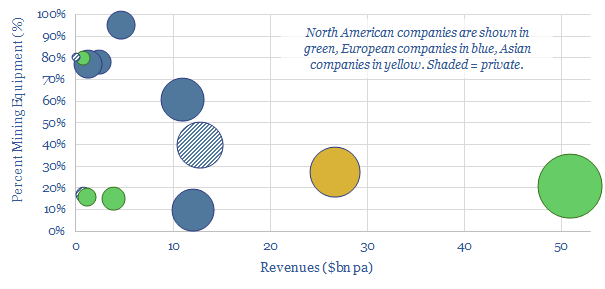
Overview of mining equipment companies?
This data-file is an overview of mining equipment companies. For each company, we have noted its location, size, age, number of employees, number of patents, latest revenues, operating margins, exposure to the mining equipment industry, and a few short summary sentences. Where possible, we have also broken down the company's revenues by end-market or by commodity.
Download
Download
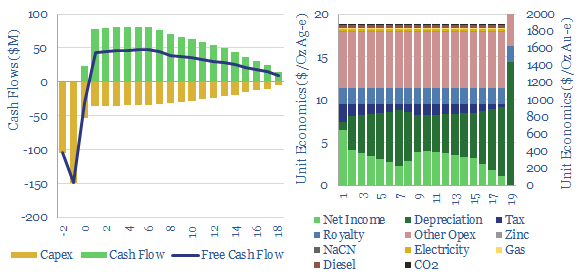
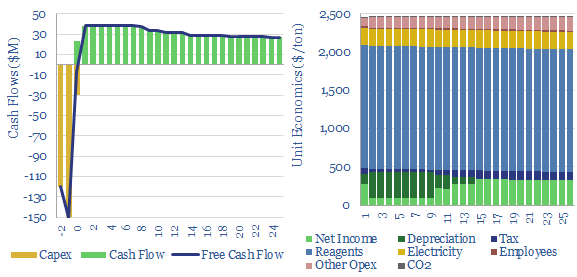
Silver and gold: the economics?
This data-file captures the marginal cost of silver and gold production, at an integrated mining-refining operation. In our base case, a 10% IRR requires a silver price of $17/Oz and a gold price of $1,750/Oz, while the energy and CO2 intensities are an eye watering 100-150 tons/ton and 9,000 tons/ton, respectively. Numbers vary widely on ore grade.
Download
Download
Heap leaching: energy economics?
This data-file captures the energy economics of leaching in the mining industry, especially the costs of heap leaching, for the extraction of copper, nickel, gold, silver, other precious metals, uranium, and Rare Earths. The data-file allows you to stress test costs in $/ton of ore, $/ton of metal, capex, opex, chemicals costs, energy intensity and CO2 intensity.
Download
Download
Electrowinning: costs and energy economics?
Electrowinning costs and energy economics are built up in this data-file. A charge of $900/ton is required to earn a 10% IRR on a $3,000/kTpa plant with a median energy consumption of 2-3 MWH/ton. Although this will vary metal by metal.
Download
Download
Froth flotation: the economics?
The costs of froth flotation are aggregated in this data-file, building up the typical capex costs (in $/Tpa), energy costs (in kWh/ton) and other opex lines (in $/ton) of one of the most important processes for the modern metals and materials industry. A good rule of thumb is $10/ton costs to concentrate a material by over 4x.
Download
Download
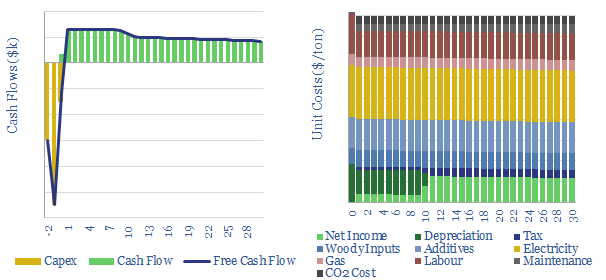
Bio-coke: energy economics?
Bio-coke is a substitute for coal-coke in steel-making and other smelting operations. We model it will cost c$450/ton, c50% more than coal-coke, but saves 2 - 2.5 tons/ton of CO2. Abatement costs can be as low as $70/ton. Although not always, and there are comparability issues.
Download
Download
Mining: crushing, grinding and comminution costs?
Mining crushing-grinding costs are typically $10/ton of ore, breaking 3-10cm rubble into 30-100 micron powders. Capex averages $20/Tpa and energy cost averages 20kWh/ton.
Download
Download
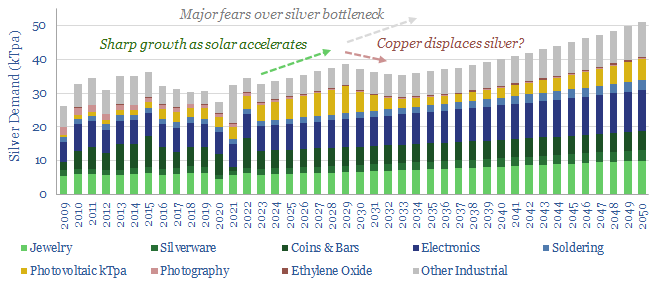
Solar contacts: silver bullet?
The front contacts in today’s solar cells are made of screen-printed silver, absorbing 11% of 2021’s silver market. Silver can be substituted with copper, but manufacturing is c5x more costly. So we expect a silver spike, then a switch. This 16-page note explains our outlook, and who benefits?
Download
Download
Silver demand: upside and substitution?
This data-file is a simple demand outlook for silver in the energy transition. Demand could rise 2.5x from 30kTpa to 85kTpa in 2050, driven by solar and electrification. Although in practice, we think a price spike will displace silver with copper.
Download
Download
Aurubis: copper recycling breakthrough?
Aurubis produces copper products from 1MTpa of recycled materials and 2.25MTpa of concetrates. Energy use and CO2 emissions are two-thirds lower than primary copper production. Our technology review finds a partial moat.
Download
Download
Recycling: a global overview of energy savings?
1GTpa of material is recycled globally, across steel, paper, glass, plastics and other metals. On average, 35% of these materials are produced from recycled feeds, saving 70% of the energy and CO2, with upside in the Energy Transition.
Download
Download
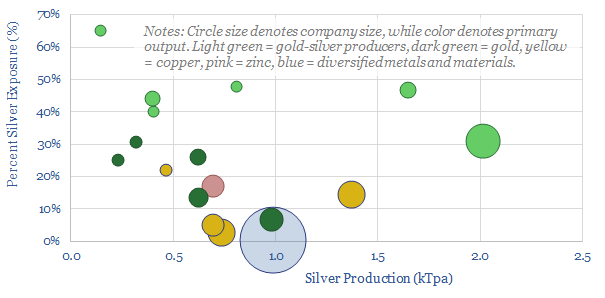
Silver producers: leading companies?
Half of the world's 28kTpa global silver market is controlled by 17 public companies, with silver output ranging from 0.1 - 2.0 kTpa, and co-producing gold, copper or other metals. This data-file is a screen of silver producers, in order to identify leading companies.
Download
Download
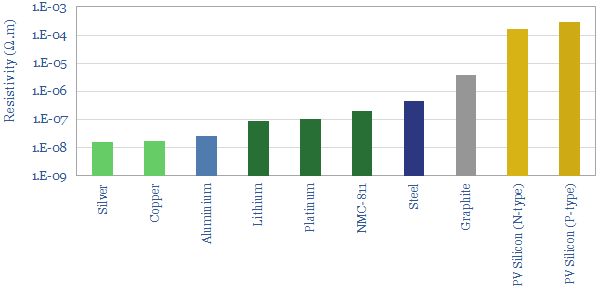
Electrical conductivity: energy transition materials?
Electrical conductivity of energy transition materials is tabulated in this data-file. 'The action' takes place in the range of 10^-8 to 10^-3 Ohm-meters, including silver in solar cells, copper in renewables and EVs, aluminium transmission lines, batteries, and solar semiconductors.
Download
Download
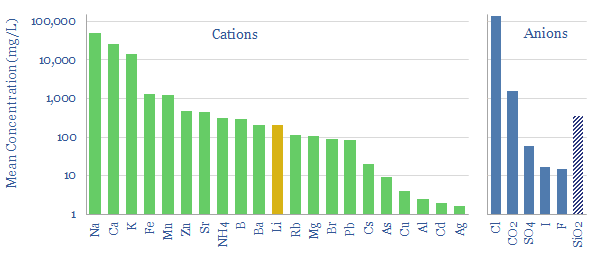
Direct lithium extraction: ten grains of salt?
Direct Lithium Extraction from brines could help lithium scale 30x in the Energy Transition; with costs and CO2 intensities 30-70% below mined lithium; while avoiding the 1-2 year time-lags of evaporative salars. This 15-page note reviews the top ten challenges that decision-makers need to de-risk.
Download
Download
Materials
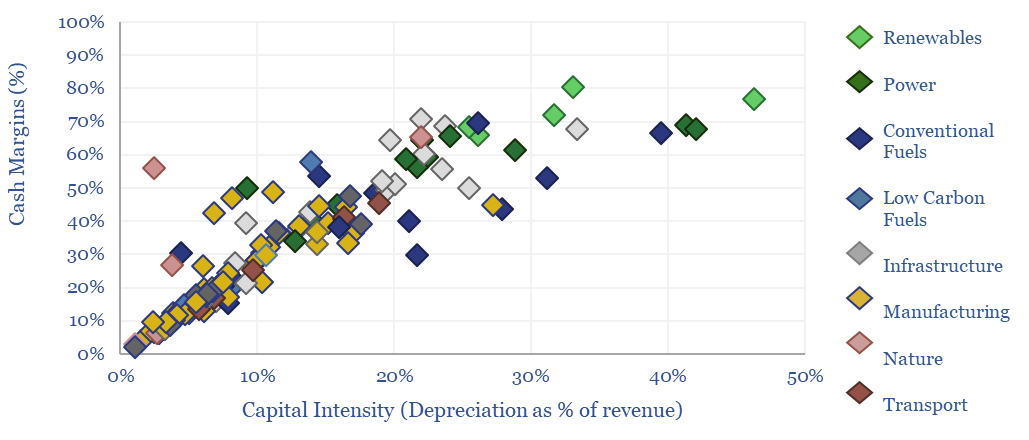
Energy economics: an overview?
This data-file provides an overview of energy economics, across 175 different economic models constructed by Thunder Said Energy, in order to put numbers in context. This helps to compare marginal costs, capex costs, energy intensity, interest rate sensitivity, and other key parameters that matter in the energy transition.
Download
Download
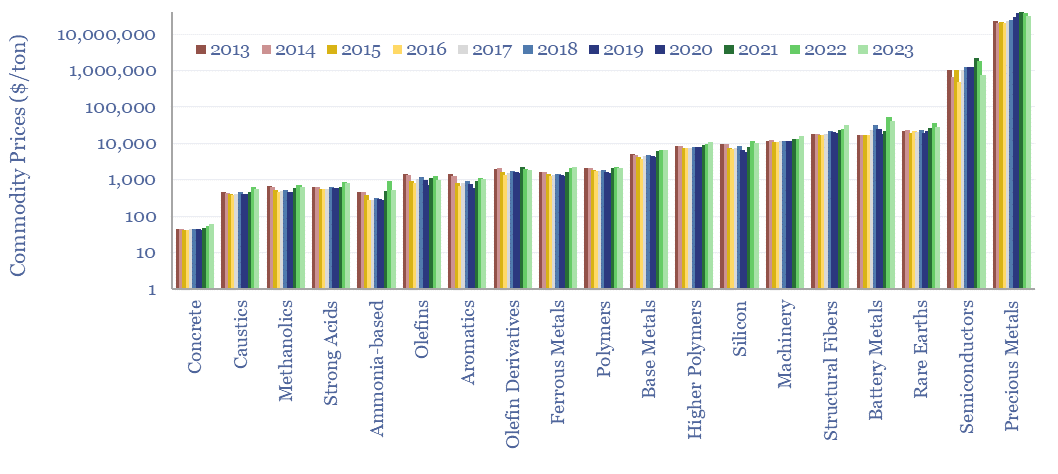
Commodity prices: metals, materials and chemicals?
Annual commodity prices are tabulated in this database for 70 materials commodities; covering steel prices, other metal prices, chemicals prices, polymer prices, all with data going back to 2012. 2022 was a record year for commodities. The average material commodity traded 25% above its 10-year average and 60% of all material commodities made ten-year highs.
Download
Download
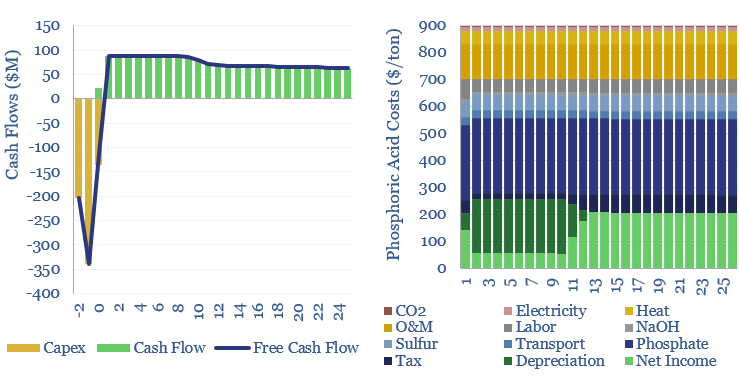
Phosphoric acid production costs?
Phosphoric acid production costs are $500-900/ton, for a 10% IRR on a new facility, with $1,000-2,000/Tpa of capex. This is using the 'wet process', where phosphate ores are reacted with sulfuric acid. CO2 intensity is 0.6 tons/ton. However, the numbers depend on product purity. There is also a 10x higher carbon, yet potentially lower-cost process, using coke in China. These variations are captured in our model.
Download
Download
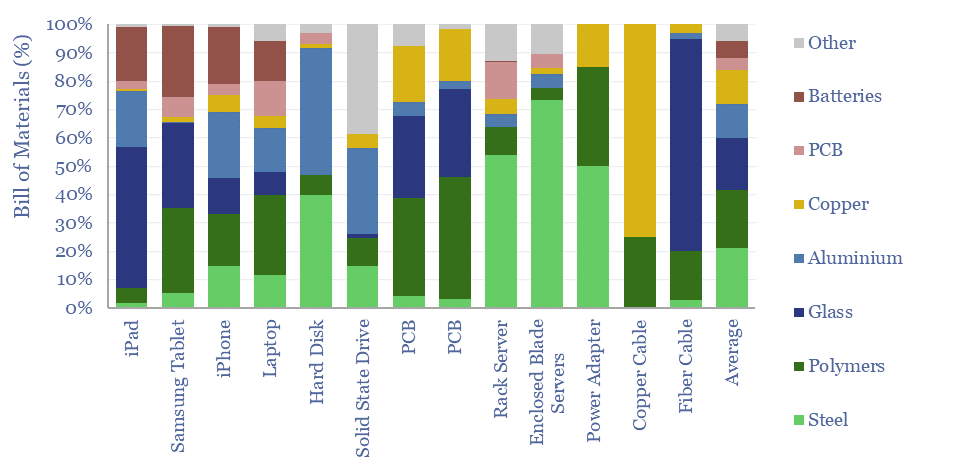
Bill of materials: electronic devices and data-centers?
Electronic devices are changing the world, from portable electronics to AI data centers. Hence what materials are used in electronic devices, as percentage of mass, and in kg/kW terms? This data-file tabualates the bill of materials, for different devices, across different studies.
Download
Download
Peak commodities: everything, everywhere, all at once?
This 15-page note evaluates 10 commodity disruptions since the Stone Age. Peak demand for commodities is just possible, in total tonnage terms, as part of the energy transition. But it is historically unprecedented. And our plateau in tonnage terms is a doubling in value terms, a kingmaker for gas, plastics and materials. Outlooks for 30 major commodities are reviewed.
Download
Download
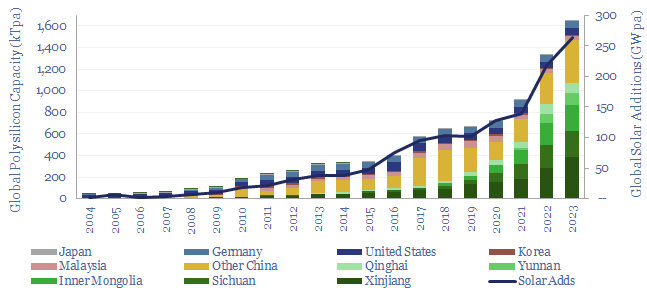
Global polysilicon production capacity?
Polysilicon is a highly pure, crystalline silicon material, used predominantly for photovoltaic solar, and also for 'chips' in the electronics industry. Global polysilicon capacity is estimated to reach 1.65MTpa in 2023, and global polysilicon production surpasses 1MTpa in 2023. China now dominates the industry, approaching 90% of all global capacity.
Download
Download

New energies: the age of materials?
Over the past decade, costs have deflated by 85% for lithium ion batteries, 75% for solar and 25% for onshore wind. Now new energies are entering a new era. Future costs are mainly determined by materials. Bottlenecks matter. Deflation is slower. Even higher-grade materials are needed to raise efficiency. This 14-page note explores the new … Continue reading "New energies: the age of materials?"
Download
Download
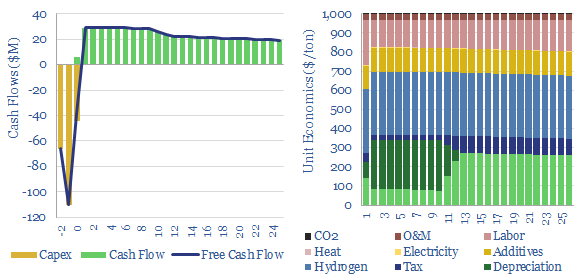
Hydrogen peroxide: production costs?
Hydrogen peroxide production costs run at $1,000/Tpa, to generate a 10% IRR at a greenfield production facility, with c$2,000/Tpa capex costs. Today's market is 5MTpa, worth c$5bn pa. CO2 intensity runs to 3 kg of CO2 per kg of H2O2. But lower-carbon hydrogen could be transformational for clean chemicals?
Download
Download
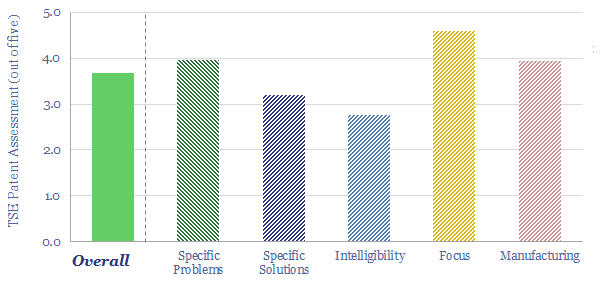
MIRALON: turquoise hydrogen breakthrough?
MIRALON is an advanced material, being commercialized by Huntsman, purifying carbon nanotubes from the pyrolysis of methane and also yielding turquoise hydrogen. This data-file reviews MIRALON technology, patents, and a strong moat. Our model sees 15% IRRs if Huntsman reaches a medium-term cost target of $10/kg MIRALON and $1/kg H2.
Download
Download
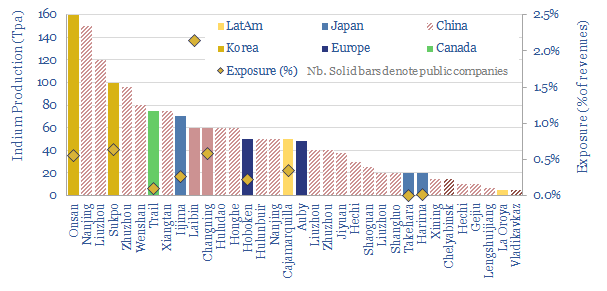
Indium producers: companies and market outlook?
35 indium producers are screened in this data-file, as our energy transition outlook sees primary demand rising 4x from 900 tons in 2022 to over 3.5ktons in 2050, for uses in HJT solar cells and digital devices. 60% of global supply is produced by 20 Chinese companies. But five listed materials companies in Europe, Canada, Japan and Korea also stand out.
Download
Download
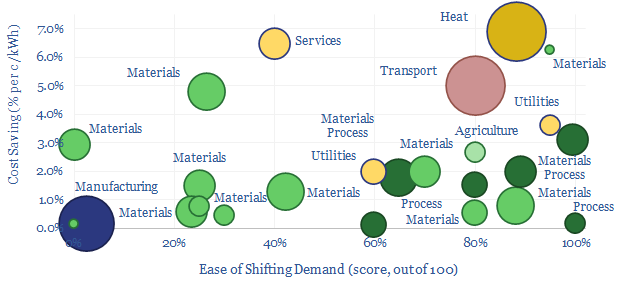
Smooth operators: who benefits from volatile power grids?
Some industries can absorb low-cost electricity when renewables are over-generating and avoid high-cost electricity when they are under-generating. The net result can lower electricity costs by 2-3c/kWh and uplift ROCEs by 5-15% in increasingly renewables-heavy grids. This 14-page note ranges over 10,000 demand shifting opportunities, to identify who can benefit most.
Download
Download
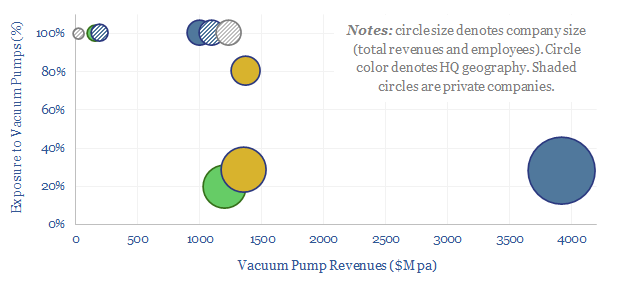
Vacuum pumps: company screen?
The global market for vacuum pumps is worth $15bn per year, with growing importance for making semiconductors, solar panels and AI chips. This data-file reviews ten leading companies in vacuum pumps, including one European-listed capital goods leader, a European pure-play and a Japanese-listed pure-play.
Download
Download
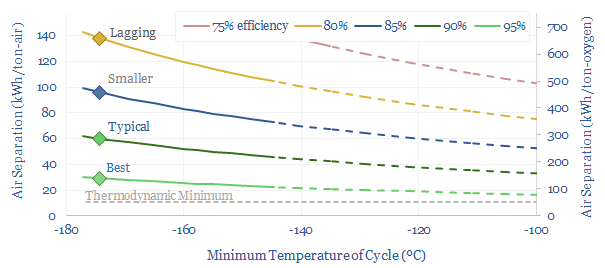
Industrial gases: air separation units?
Cryogenic air separation is used to produce 400MTpa of oxygen, plus pure nitrogen and argon; for steel, metals, ammonia, wind-solar inputs, semiconductor, blue hydrogen and Allam cycle oxy-combustion. Hence this 16-page report is an overview of industrial gases. How does air separation work? What costs, energy use and CO2 intensity? Who benefits amidst the energy transition?
Download
Download
Electric vehicles: motors and magnets?
This data-file assesses electric vehicle magnets, permanent magnets and the use of Rare Earth materials such as neodymium (NdFeB). 80-90% of recent EVs have used Rare Earth permanent magnets, averaging 1.5 kg per vehicle, or 7.5g/kW of drive-train power, across the data-file. But the numbers vary vastly. From 0-4 kg per vehicle. 20 vehicles from different OEMs are tabulated in the data-file.
Download
Download
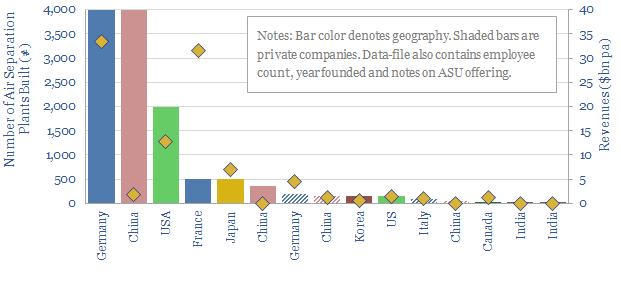
Cryogenic air separation: company screen?
Over $100bn pa of industrial gases and $5-6bn pa of cryogenic air separation plants are produced each year. This data-file is a screen of leading industrial gas companies and cryogenic air separation companies, breaking down their market share (number of ASUs constructed) history, geography, sales and headcounts.
Download
Download
Metals and materials: strength and temperature resistance?
This data-file aggregates information into the strength, temperature resistance, rigidity, costs and CO2 intensities of important metals and materials. These are used in gas turbines, wind turbines, pipelines, CCS, power transmission.
Download
Download
Bulk shipping: cost breakdown?
Bulk carriers move 5GTpa of commodities around the world, explaining half of all seaborne global trade. This model is a breakdown of bulk shipping cost. We estimate a cost of $2.5 per ton per 1,000-miles, and a CO2 intensity of 5kg per ton per 1,000-miles. Marine scrubbers increasingly earn their keep and uplift IRRs from 10% to 12% via fuel savings.
Download
Download
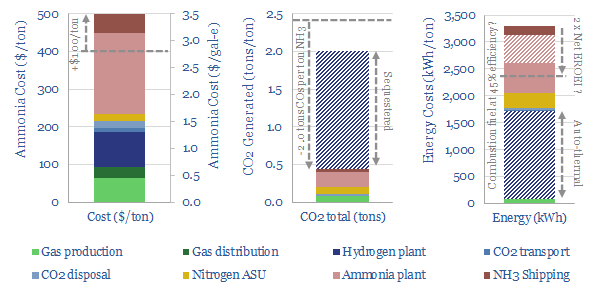
Blue ammonia: options strategy?
Blue ammonia can economically decarbonize the fertilizer industry, using low-cost natural gas; with options to decarbonize combustion fuels in the future. This report covers where we see the best opportunities, as reforms to the 45Q have already kick-started a 20MTpa boom of new US projects.
Download
Download
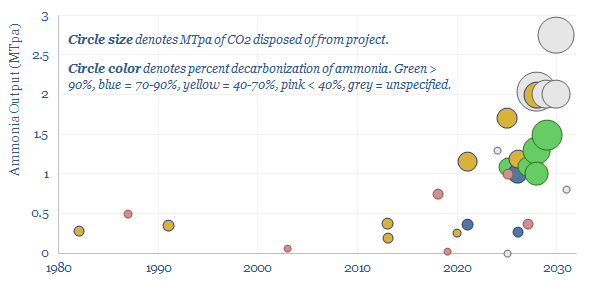
Blue ammonia projects: a screen?
This data-file captures a sample of 30MTpa of blue ammonia projects from 1980 to 2030, including their location, companies, timings (year of FID, year of start-up), their sizes (in MTpa), their CO2 reductions (in %), their capex costs (in $M, where disclosed) and the implied capex costs ($/Tpa). We have also summarized each project with 3-10 lines of text.
Download
Download
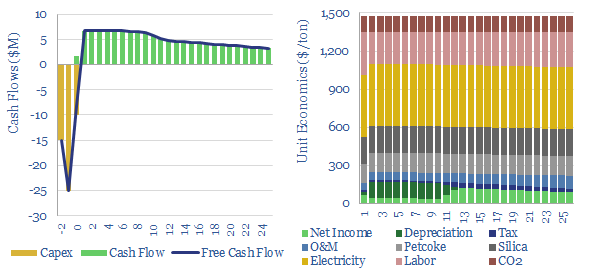
Silicon carbide: production costs?
This data-file captures the costs of producing different grades of silicon carbide: from materials grade SiC ($1,500/ton marginal cost, 5 tons/ton CO2 intensity) through to SiC wafers that are used in the electronics industry ($30M/ton, 200 tons/ton?). SiC semiconductor remains opaque.
Download
Download
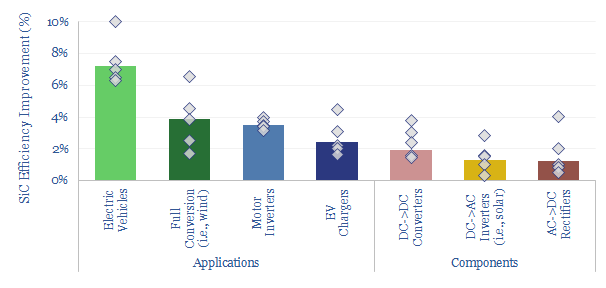
Silicon carbide: faster switching?
Silicon carbide power electronics will jolt the energy transition forwards, displacing silicon, and improving the efficiency of most new energies by 1-10 pp. Hence we wonder if this disruptor will surprise to the upside, quintupling by 2027. This 12-page note reviews the technology, advantages, challenges, and who benefits?
Download
Download
Energy transition: top commodities?
This data-file summarizes our latest thesis on ten commodities with upside in the energy transition. The average one will see demand rise by 3x and price/cost appreciate or re-inflate by 100%. The data-file contains a 6-10 line summary of our work into each commodity.
Download
Download
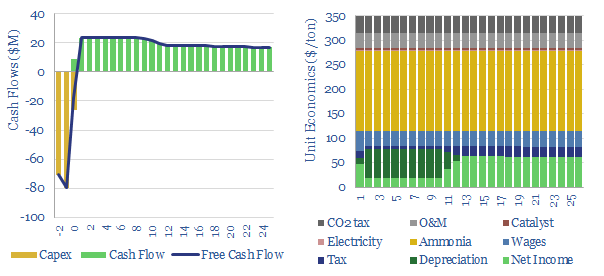
Nitric acid: production costs?
Global production of nitric acid is 60MTpa, in a $25bn pa market, spanning c500 production facilities. This data-file estimates a marginal cost of $350/ton HNO3 and a CO2 intensity averaging 1.8 tons/ton. There are feedback loops where gas shortages could result in fertilizer and metal shortages.
Download
Download
Overview of mining equipment companies?
This data-file is an overview of mining equipment companies. For each company, we have noted its location, size, age, number of employees, number of patents, latest revenues, operating margins, exposure to the mining equipment industry, and a few short summary sentences. Where possible, we have also broken down the company's revenues by end-market or by commodity.
Download
Download
Froth flotation: the economics?
The costs of froth flotation are aggregated in this data-file, building up the typical capex costs (in $/Tpa), energy costs (in kWh/ton) and other opex lines (in $/ton) of one of the most important processes for the modern metals and materials industry. A good rule of thumb is $10/ton costs to concentrate a material by over 4x.
Download
Download
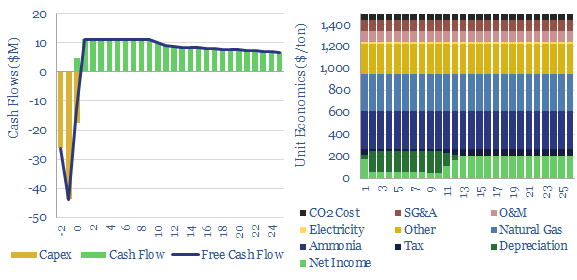
Cyanide production: the economics?
Hydrogen cyanide is a chemical intermediate, used for making perspex, nylon-6,6 and sodium cyanide, which in turn is a crucial chemical for extracting gold and silver from precious metal ores. Marginal costs are usually $1,500-1,650/ton and CO2 intensities are 2-3 tons/ton.
Download
Download
Mining: crushing, grinding and comminution costs?
Mining crushing-grinding costs are typically $10/ton of ore, breaking 3-10cm rubble into 30-100 micron powders. Capex averages $20/Tpa and energy cost averages 20kWh/ton.
Download
Download
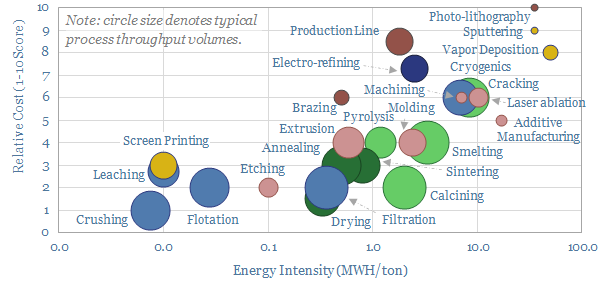
Manufacturing methods: an overview?
An of overview of manufacturing methods is given in this data-file. Costs are 70% correlated with energy intensity, ranging from well below 0.3 MWH/ton to well above 7MWH/ton. The lowest cost techniques take place at huge throughput in the mining industry, while the most intricate are used in semiconductor.
Download
Download
Recycling: a global overview of energy savings?
1GTpa of material is recycled globally, across steel, paper, glass, plastics and other metals. On average, 35% of these materials are produced from recycled feeds, saving 70% of the energy and CO2, with upside in the Energy Transition.
Download
Download
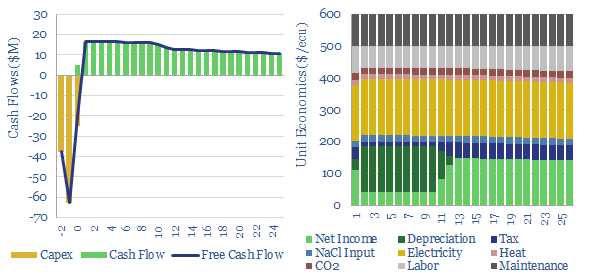
Chlor-alkali process: the economics?
This data-file captures chlor-alkali process economics, to produce 80MTpa of chlorine and 90MTpa of caustic soda. Our base case requires $600 per ecu for a 10% IRR and a growth project costing $600/Tpa. Electricity is 45% of cash cost. CO2 intensity is 0.5 tons/ton. Interestingly, chlor-alkali plants can demand shift.
Download
Download
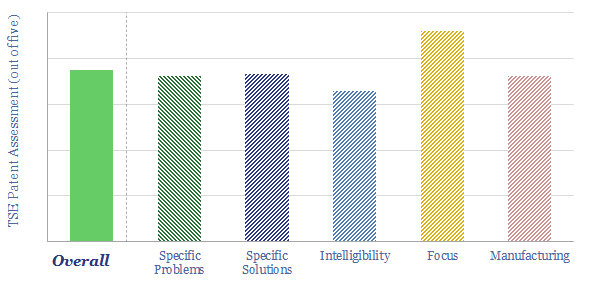
Albemarle: lithium, bromine, catalyst improvements?
Albemarle is a specialty chemicals company. Our patent screen de-risks incremental improvements in novel fire-proofing bromine compositions, further and better lithium pathways, and longer-lasting catalysts for cleaner fuels. Overall we think 70% of the patents are for technologies that will advance the energy transition in some way.
Download
Download
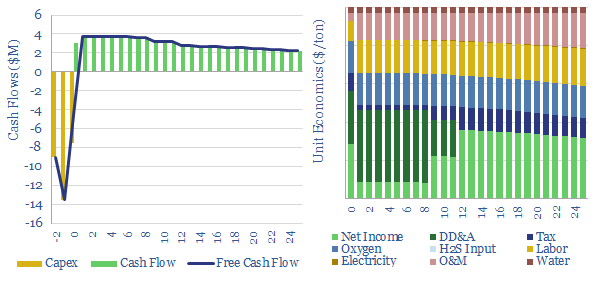
Sulphur recovery units: Claus process economics?
This data-file captures the economics of producing sulphur from H2S via the Claus process, yielding an important input for phosphate fertilizers and metals. Cash costs are $40-60/ton and marginal costs are $100/ton. CO2 intensity is low at 0.1 tons/ton. Data-file explores shortages in energy transition?
Download
Download
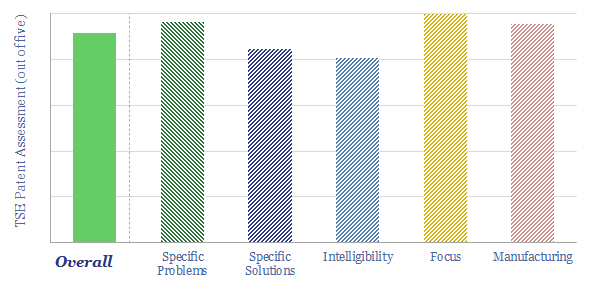
Tricoya: engineered wood breakthrough?
Tricoya is an engineered wood product like MDF, but it has been "acetylated", in order to confer >50-year longevity, even when exposed to the elements. Accsys Technologies is the parent company listed on AIM and Euronext Amsterdam. This data-file reviews its technology and patent library.
Download
Download
Wood use: what CO2 credentials?
The carbon credentials of wood are not black-and-white. They depend on context. This 13-page note draws out the numbers and five key conclusions. They count against deforestation, in favor of using waste wood, in favor of wood materials (with some debate around paper) and strongly in favor of natural gas.
Download
Download
CO2 intensity of wood: context by context?
This data-file calculates the CO2 intensity of wood in the energy transition. Context matters, and can sway the net climate impacts from -2 tons of emissions reductions per ton of wood through to +2 tons of incremental emissions per ton of wood. Calculations can be stress-tested in the data-file.
Download
Download
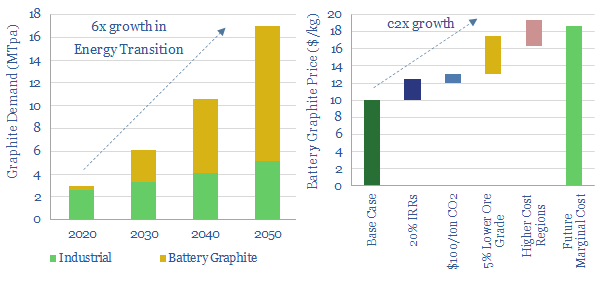
Graphite: upgrade to premium?
Global graphite volumes grow 6x in the energy transition, mostly driven by electric vehicles. We see the industry moving away from China’s near-exclusive control. The future favors a handful of Western producers, integrated from mine to anode, with CO2 intensity below 10kg/kg. This 10-page note outlines the opportunity.
Download
Download
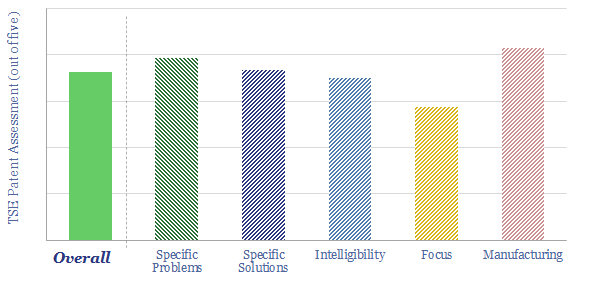
Stora Enso: next-generation packaging breakthrough?
Stora Enso is a pulp, paper and forestry products business, headquartered in Finland, with €10bn per year of revenues. It argues "everything made from fossil-based materials today can be made from a tree tomorrow". Our patent screen finds a strong focus on sustainable packaging solutions, especially Microfibrillated Cellulose (MFC).
Download
Download
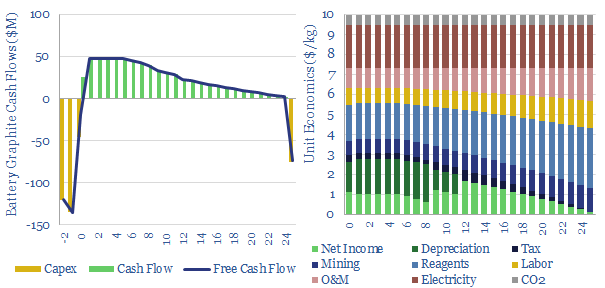
Graphite production: the economics?
This data-file captures simplified costs for producing battery-grade graphite (i.e., 99.9% pure, coated, spheronized graphite) in an integrated facility, from mine to packaged output. Our marginal cost is estimated at around $10,000/ton for a 10% IRR. CO2 intensity varies but averages 10kg/kg.
Download
Download
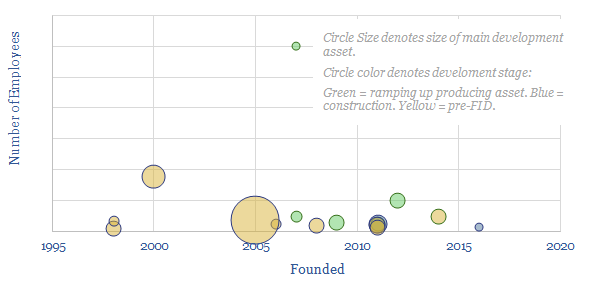
Graphite producers: leading companies?
This data-file screens 15 companies that are developing graphite mines, plus downstream refining facilities, to upgrade their output into highly pure spheronized graphite that can be used as an anode material for lithium ion batteries, such as in electric vehicles.
Download
Download
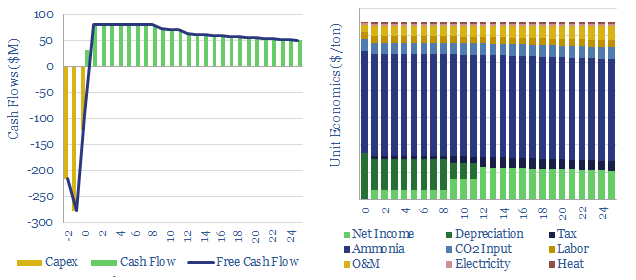
Urea production: the economics
This data-file captures the economics of producing urea, an important fertilizer and intermediate material. We estimate a marginal cost of $325/ton, based on $2/mcf-e energy inputs. CO2 intensity is 1.5 tons/ton. But costs will increase well above $800/ton during times of energy shortages.
Download
Download
Digital
Moving targets: molecules, electrons or bits ?!
New AI data-centers are facing bottlenecked power grids. Hence this 15-page note compares the costs of constructing new power lines, gas pipelines or fiber optic links for GW-scale computing. The latter is best. Latency is a non-issue. Thus AI reshapes the future of US shale, midstream and fiber-optics?
Download
Download
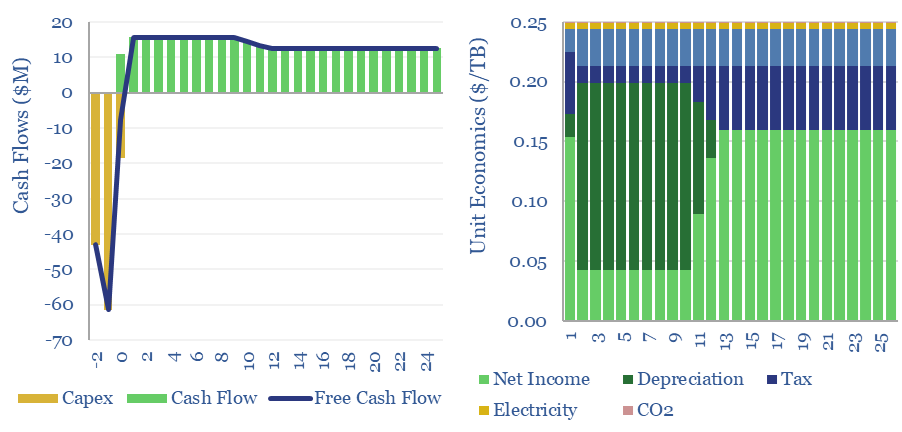
Fiber optic data transmission costs?
The costs of fiber optic data transmission run at $0.25/TB per 1,000km in order to earn a 10% IRR on constructing a link with $120 per meter capex costs. Capex is 85% of the total cost. This data fiber breaks down the costs of fiber optic data transmission from first principles, across capex, utilization, electricity and maintenance.
Download
Download
Internet energy consumption: data, models, forecasts?
This data-file forecasts the energy consumption of the internet, rising from 800 TWH in 2022 to 2,000 TWH in 2030 and 3,750 TWH by 2050. The main driver is the energy consumption of AI, plus blockchains, rising traffic, and offset by rising efficiency. Input assumptions to the model can be flexed. Underlying data are from technical papers.
Download
Download
Omniscience: how will AI reshape the energy transition?
AI will be a game-changer for global energy efficiency, saving 10x more energy than it consumes directly, closing 'thermodynamic gaps' where 80-90% of all primary energy is wasted today. Leading corporations will harness AI to lower costs and accelerate decarbonization. This 19-page note explores opportunities.
Download
Download
What is the energy consumption of the internet?
Powering the internet consumed 800 TWH of electricity in 2022, as 5bn users generated 4.7 Zettabytes of traffic. Our guess is that the internet’s energy demands double by 2030, including due to AI (e.g., ChatGPT), adding 1% upside to global energy and 2.5% to global electricity demand. This 13-page note aims to break down the numbers and their implications.
Download
Download
Energy intensity of fiber optic cables?
What is the energy intensity of fiber optic cables? Our best estimate is that moving each GB of internet traffic through the fixed network requires 40Wh/GB of energy, across 20 hops, spanning 800km and requiring an average of 0.05 Wh/GB/km. Generally, long-distance transmission is 1-2 orders of magnitude more energy efficient than short-distance.
Download
Download
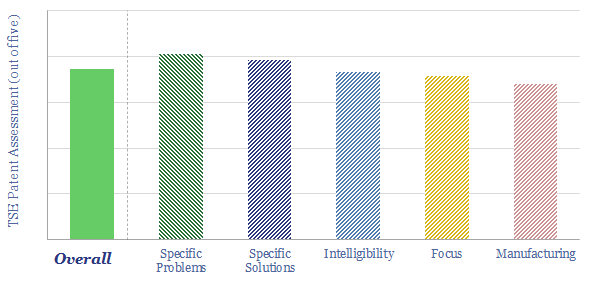
Sentient Energy: smart grid breakthrough?
This data-file is a technology review for Sentient Energy, assessing innovations in smart grids. Its technology can achieve energy savings via a combination of "Conservation Voltage Reduction" and "Volt-VAR optimization at the grid edge". This also helps to integrate more solar and EV charging into power grids. We explain the technology.
Download
Download
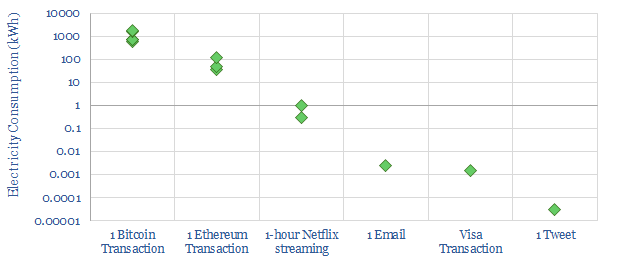
Blockchain: why so energy intensive?
A single Bitcoin transaction currently uses c1,000kWh of electricity, 1 million times more than a traditional payment. Hence this note aims to explain how blockchain works, why it has been so energy intensive in the past, and how the energy multiplier could be reduced to maybe 100 - 1,000x.
Download
Download
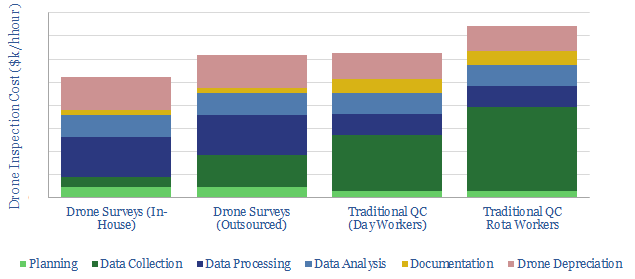
Inspection costs: drones versus traditional quality control?
This data-file estimates the costs of drone inspections, for the construction and resources industries, using bottom-up numbers from technical papers. Costs per hour can be 30% lower than for traditional quality control. A single drone, including software licenses likely costs c$30k.
Download
Download
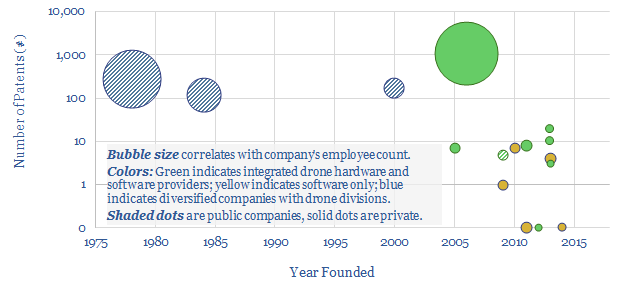
Companies in drones and drone services for construction?
This data-file is a simple screen of companies manufacturing drones and commercializing drone software. It includes 12 private companies and 4 public companies. For each company, we have tabulated their history, geography, number of patent filings and a short description.
Download
Download
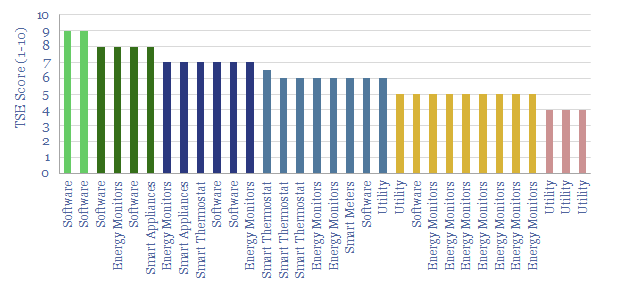
Smart Energy: technology leaders?
Smart meters and smart devices are capable of transmitting and receiving real-time consumption data and instructions. This data-file tracks 40 leading companies, mostly at the venture and growth stages. They help lower demand, smooth grid volatility and encourage appliance upgrades.
Download
Download
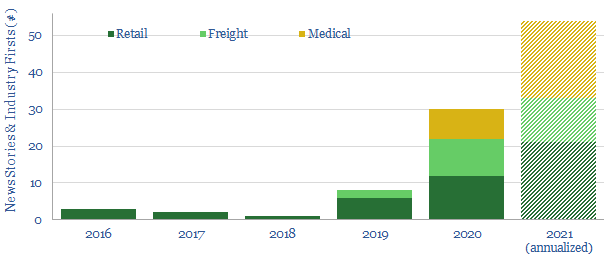
The ascent of drones?
In 2019, we argued drones would be the single most disruptive technology to gain share in the 2020s, with potential to save over 500MTpa of CO2 emissions, while re-shaping urban consumption, retail and manufacturing. This data-file aims to tabulate key news flow and data-points.
Download
Download
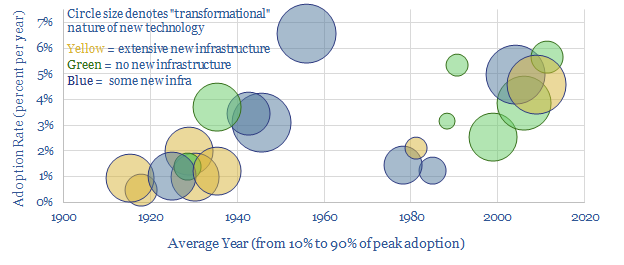
Technology transitions: thinking fast and slow?
It takes 15-100 years for a new technology to ramp from 10% to 90% of its peak adoption rate. But what determines the pace? This 15-page note finds answers by evaluating 20 examples that changed the world from 1870 to 2020. We derive four rules of thumb, in order to quantify the pace at which different energy transition technologies will scale up.
Download
Download
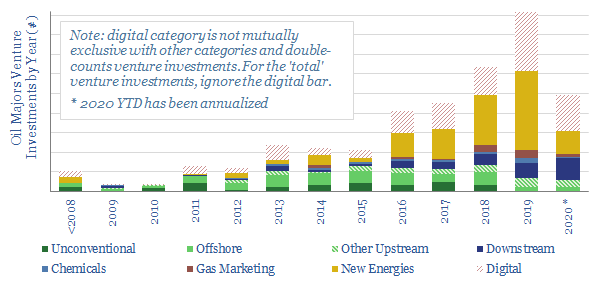
Ventures for an Energy Transition?
This database tabulates c300 venture investments, made by 9 of the leading Oil Majors. Their strategy is increasingly geared to advancing new energies, digital technologies and improving mobility. Different companies are compared and contrasted, including the full list of venture investments over time.
Download
Download
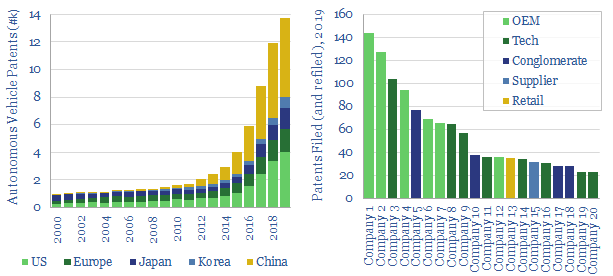
Autonomous vehicles: where’s the IP?
We screen 37,000 patents into autonomous vehicles, which will likely increase total road travel by c10%. The pace of activity has been rising at a rapid, 37% CAGR. Our data-file notes the most active companies, including tech firms (Denso, MobilEye, TuSimple, Uber, Waymo, Zoox) and auto companies (Ford, GM, Honda, Toyota, Volvo et al).
Download
Download
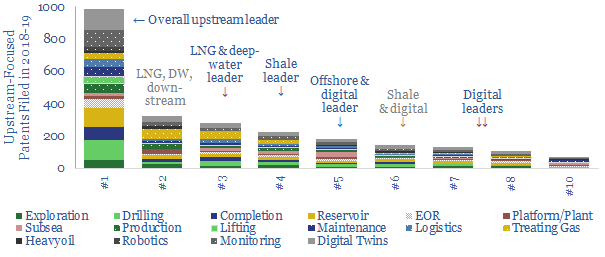
Upstream technology leaders: weathering the downturn?
Leading technologies correlate 50-80% with ROACEs and -88% with costs in the energy industry. Hence, we assessed 6,000 patents from 2018-19, to determine which Energy Majors are best-placed to weather the downturn, benefit from dislocation and thrive in the recovery. We find clear leaders in onshore, offshore, shale, LNG and digital.
Download
Download
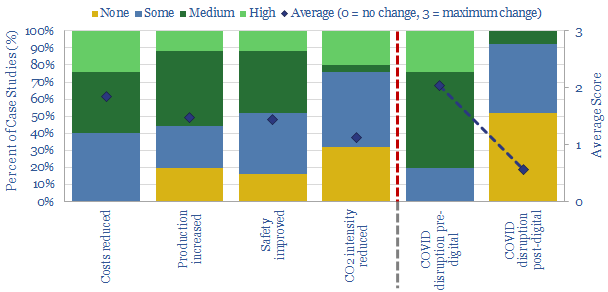
Digitization after the crisis: who benefits and how much?
We have constructed a database of digitization case studies around the energy industry to quantify the benefits, screen the most digital operators and identify longer-term winners in the supply chain. The theme will accelerate. Just 8% of digitized industrial processes will be materially disrupted due to COVID-19, compared to 80% of non-digitized processes.
Download
Download
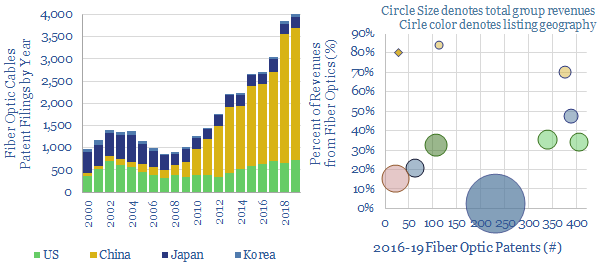
Fiber Optic Cables: Patents and Leading Companies?
This data-file screens for the technology leaders in fiber-optic cables, which are crucial for the digitization of industries and the world's structural shift towards remote-working, based on screening 37,000 patents. Revenues and market shares are summarized for the leaders.
Download
Download
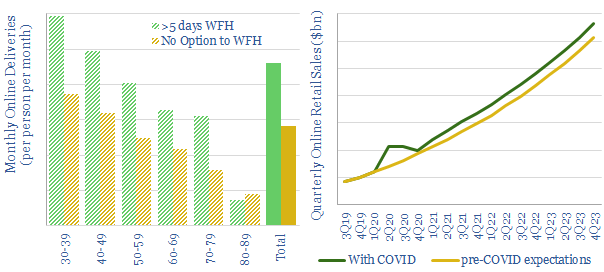
The structural ascent of online retail?
Online retail sales could structurally accelerate by c9% due to the COVID-19 crisis. A full breakdown of inputs and underlying data are included in this model. Individuals that work from home tend to make c63% more online retail purchases than in situ workers.
Download
Download
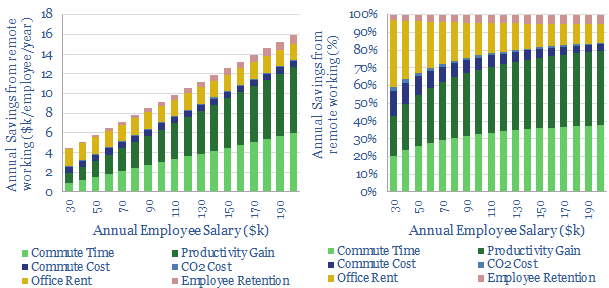
Working remotely: the economics, the opportunity?
The economic benefits of working remotely are between $5-16k per employee per year, as modelled in shit data-file. Hence we quantify that remote work could step up to displace 30% of all commutes from a typical developed world economy by 2030. The conclusions are substantiated using US data.
Download
Download
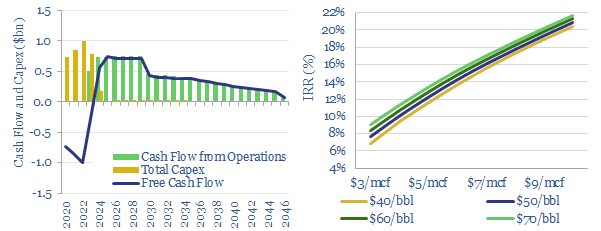
Fully subsea offshore projects: the economics?
The model presents the economic impacts of developing a typical, 625Mboe offshore gas condensate field using a fully subsea solution, compared against installing a new production facility. The result is a c4% uplift in IRRs, a 50% uplift in NPV6 and a 33% reduction in the project's gas-breakeven price. The economics are attractive.
Download
Download
Chevron: SuperMajor Shale in 2020?
SuperMajors’ shale developments are assumed to differ from E&Ps’ mainly in their scale and access to capital. Access to superior technologies is rarely discussed. But new evidence is emerging. This note assesses 40 of Chevron’s shale patents from 2019, showing a vast array of data-driven technologies, to optimize every aspect of shale.
Download
Download
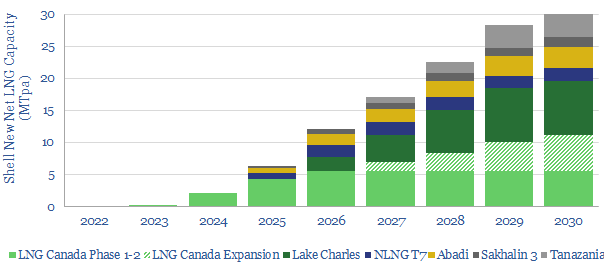
Shell: the future of LNG plants?
Shell is revolutionizing LNG project design, based on reviewing 40 of the company’s gas-focused patents from 2019. The innovations can lower LNG facilities’ capex by 70% and opex by 50%; conferring a $4bn NPV and 4% IRR advantage over industry standard greenfields. Smaller-scale LNG, modular LNG and highly digitized facilities are particularly abetted. This note … Continue reading "Shell: the future of LNG plants?"
Download
Download
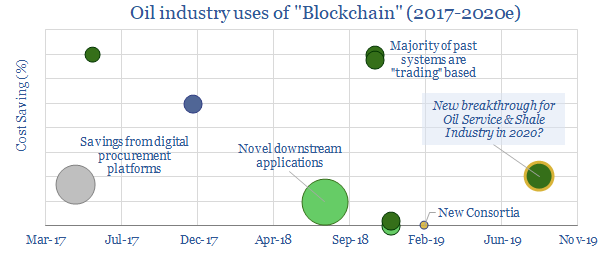
Blockchain in the Oil & Gas Supply Chain
This datafile tabulates ten examples of deploying Blockchain in the oil and gas industry since 2017; including companies and cost savings. Most prior examples are in trading. For 2020, we are particularly excited by the broadening of Blockchain technologies into the procurement industry, which can deflate shale costs.
Download
Download
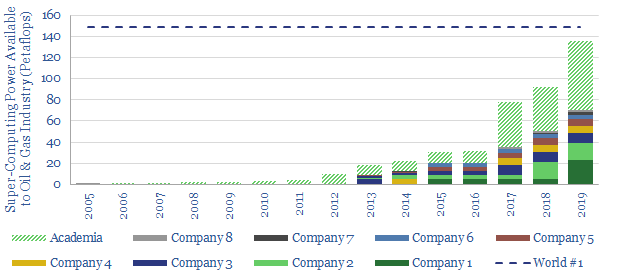
Super-Computers at Oil Majors?
This data-file tabulates super-computing capacity possessed by leading companies in the energy industry. Computing capacity has risen 4x since 2016, and 70x since 2009. Main uses are seismic interpretation, reservoir modelling and for operational decision-making, which all increases efficiency. Leading companies are identified in the data-file.
Download
Download
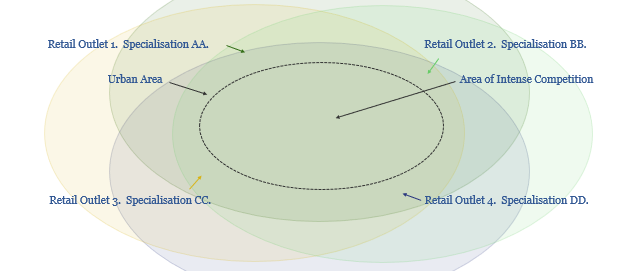
Drones & droids: deliver us from e-commerce
Small, autonomous, electric vehicles are emerging. They are game-changers: rapidly delivering online purchases to customers, creating vast new economic possibilities, but also driving the energy transition. Their ascent could eliminate 500MTpa of CO2, 3.5Mboed of fossil fuels and c$3trn pa of consumer spending across the OECD. The mechanism is a re-shaping of urban consumption habits, … Continue reading "Drones & droids: deliver us from e-commerce"
Download
Download
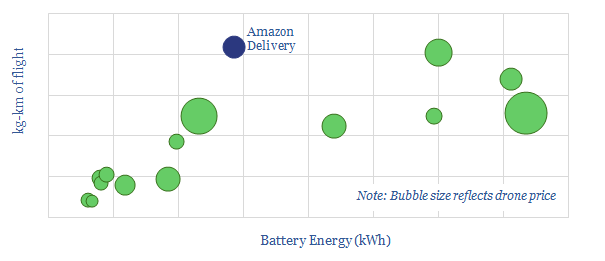
Drone Delivery: the Energy Economics
We have tabulated energy economics on 15 commercial drones and run the equations of flight on Amazon's "Prime Air" solution. We conclude that drone delivery will use 90% less energy, 99% less cost and 90% lower carbon than is typical in current last-mile truck deliveries. Please download the model for all of the numbers.
Download
Download
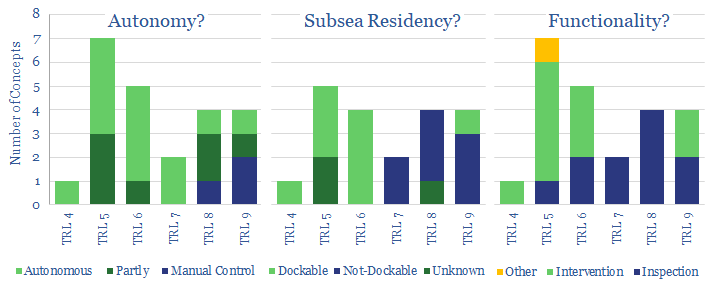
Subsea Robots: the next generation?
Over 20 next-generation subsea robotics concepts are presented. These electric solutions are increasingly autonomous, they reside subsea and can conduct more thorough inspection/intervention work. Inspection is 2-6x faster, and maintenance costs can be halved, yielding savings of $0.5-1/boe at a typical field. The data-file also summarizes the leading Majors and Service Companies in the space.
Download
Download
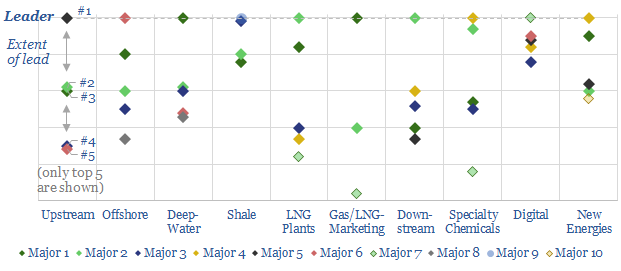
Patent Leaders in Energy
Technology leadership is crucial in energy. But it is difficult to discern. Hence, we reviewed 3,000 patents across the 25 largest companies. This note ranks the industry’s “Top 10 technology-leaders”: in upstream, offshore, deep-water, shale, LNG, gas-marketing, downstream, chemicals, digital and renewables. In each case, we profile the leading company, its edge and the proximity … Continue reading "Patent Leaders in Energy"
Download
Download
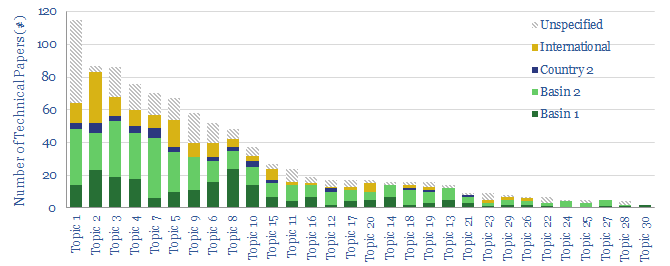
The cutting edge of shale technology?
This data-file reviews 950 technical papers from the shale industry in 2018-2020, to identify the cutting edge of shale technology. The trends show an incredible uptick in completion design, frac fluids, EOR and machine learning. Each paper is summarized and categorized. The file also shows which companies and services have a technology edge.
Download
Download
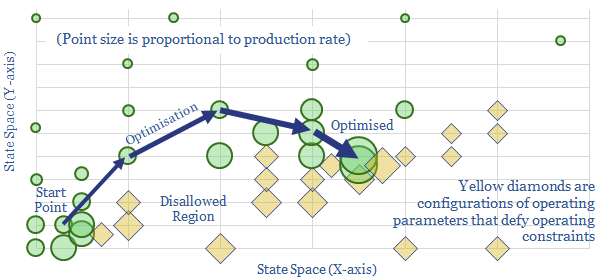
Well-by-well optimisation?
Well-by-well production optimisation can uplift mature fields' output 5-20%. This data-file summarises the methodology employed by BP, which has filed the most detailed patent we have seen on the topic, from our screen of 3,000 patents around the industry.
Download
Download
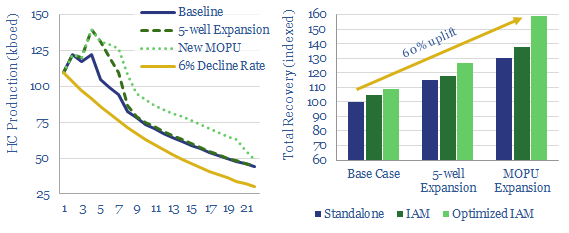
Can super-computers lower decline rates?
Advanced reservoir modelling can stave off production declines at complex offshore assets. This data-file illustrates how, tabulating production estimates based on a technical paper using Eni's high-speed computer assets. 60% uplifts in LT production and EUR are achieved.
Download
Download
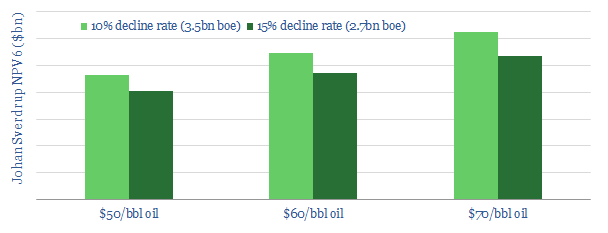
Johan Sverdrup: Don’t Decline
Equinor is deploying three world-class technologies to mitigate Johan Sverdrup’s decline rates, based on reviewing c115 of the company’s patents and dozens of technical papers. This 15-page note outlines how its efforts may unlock an incremental $3-5bn of value from the field, as production surprises to the upside.
Download
Download
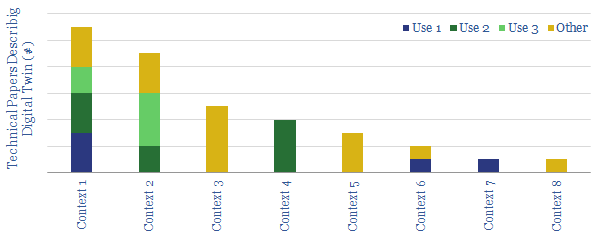
Deploying the Digital Twin
This data-file tabulates 36 recent technical papers into "digital twins" since 2017, in order to understand how the technology is being deployed around the upstream oil and gas industry: principally to improve platform uptime, prevent rig downtime and inspect subsea infrastructure.
Download
Download
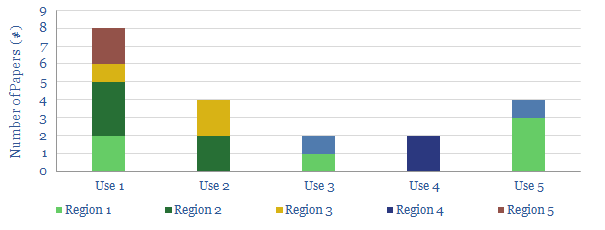
Inflow Control: Our Top 20 Papers from 2019
This data-file summarises twenty recent papers using inflow control devices: an exciting digital technology to optimise horizontal wells by limiting production from zones that are susceptible to flowing water or gas. Each paper is categorized by company, country, field and focus. Also included are our 'Top 10' facts from the technical literature.
Download
Download
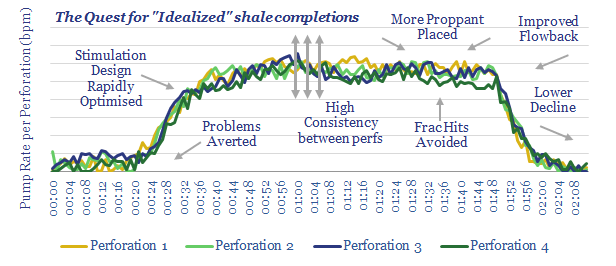
Shale: Upgrade to Fiber?
This note focuses on the most exciting new data methodology we have seen across the entire shale space: distributed acoustic sensing (DAS) using fiber-optic cables. It has now reached critical mass.
Download
Download
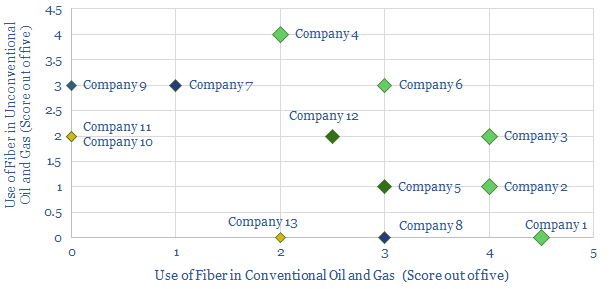
Leading Companies in DAS?
This data-file quantifies the leading companies in Distributed Acoustic Sensing (DAS), the game-changing technology for enhancing shale and conventional oil industry productivity. Operators are screened from their patents and technical papers. Services are screened based on their size and their technology.
Download
Download
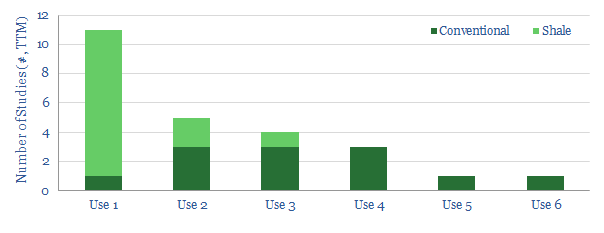
DAS. At the cutting edge in shale?
This data-file summarises 25 of the most recent technical papers around the industry, using fiber-optic cables for Distributed Acoustic Sensing (DAS). The technology is now hitting critical mass to spur shale productivity upwards.
Download
Download
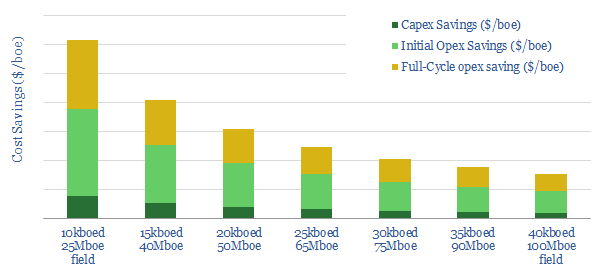
De-Manning Deepwater?
We estimate a typical deepwater oilfield could save $15-20/bbl by "de-manning", if implemented correctly. This data-file contains our workings, across 15 cost lines, based on recent design work from Technip-FMC.
Download
Download
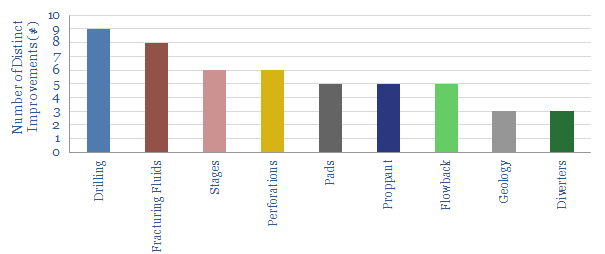
Shale Productivity: Our “Top 50” Improvements
Critics still downplay shale productivity. This simple data-file compiles fifty examples of genuine improvements across the industry since 2015. A "one line" summary is provided for each one.
Download
Download