Half of the world’s 28kTpa global silver market is controlled by 17 public companies, with silver output ranging from 0.1 – 2.0 kTpa. This data-file is a screen of silver producers, in order to identify leading companies, especially as there may be demand upside from growing solar demand.
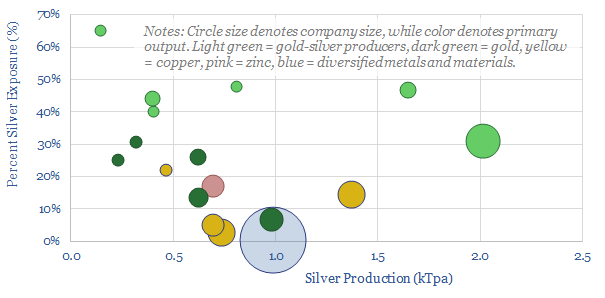
There are no pure-plays. The average company in the screen is c25% exposed to silver. 40% of the output is from gold-silver producers (c45% average silver exposure), 20% from gold producers (20% exposure), 25% is from copper producers (11%) and the remainder is from other and more diversified metals companies.
Our roadmap to net zero shows upside for demand in many of these metals, but they also differ in their defensiveness, gearing to the business cycle and defensiveness. In a concentrated market with sharp upside potential, there is always a debate whether you want to own the bottom of the cost curve (around $10/Oz; most resilient, highest margin) or the top of the cost curve (around $25/Oz; re-rating as they move from ‘out of the money’ to ‘in the money’).
CO2 intensity is surprisingly high, most likely around 150-200 kg/kg, with upper estimates as high as 500 kg/kg of CO2 per unit of silver; which stems from the very high processing intensity of very low ore grades (4-400 grams/ton).
To read more about silver producers leading companies, please see our article here.