The purpose of this data-file is to tabulate our best estimates for the CO2 associated with different activities. It is not intended to be preachy, just present some data-driven conclusions…
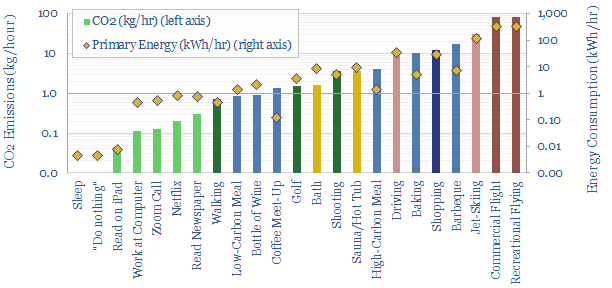
(1) The tyranny of choice. Every activity in the data-file has some CO2 footprint, but the axes are logarithmic. Thus 1-hour of higher-carbon activity emits 100-1,000x more CO2 than a lower-carbon activity. 1-hour of flying emits as much CO2 as watching Netflix for 17-days.
(2) You can weight the numbers into an average. A weekend ‘mini break’ might average together into 8kg CO2e per person per hour, while a weekend of solid reading is 500g pp ph.
(3) The average US person has a CO2 footprint of 20 tons per year (data here), which is 2.2kg per hour (coincidentally, or not, about the same as going to play a round of golf). Hence 2kg/hour is a good yardstick for segmenting higher- and lower-carbon activities on the chart above.
(4) Food choices have a surprisingly large impact (blue bars above), from <1 kg CO2e for a lower-carbon meal per person, 4kg for a higher-carbon meal, 10kg for an hour of baking and 20kg for an hour of barbecuing. I am not saying there is anything inherently evil about brownies or ribs. Simply that you can lower your CO2 by 20-70% through dietary choices (note here).
(5) The lowest carbon activities emit 50-100g of CO2 per hour. For example, this is the full life-cycle CO2 for reading on your iPad or desktop, and even comes out 30-90% lower-carbon than reading a physical newspaper. So with that said, here is a link to our PDF research.