This data-file is a breakdown of global energy demand by end use, drawing across our entire research library, to disaggregate the global energy system across almost 50 applications. Such as transportation, heat, electricity, materials and manufacturing. Numbers, calculations, efficiencies and heating temperatures are in the data-file.
Primary global energy demand runs at 160,000 TWH pa. Useful global energy demand (net of efficiency losses) runs at 80,000 TWH pa. Per our global energy supply models, it is relatively easy to disaggregate energy supply, by summing across oil, gas, coal, nuclear, hydro, wind and solar, biomass and other.
A breakdown of global energy demand is more challenging. But we have slowly been building up a library of economic models and supply-demand models, looking theme-by-theme, material-by-material, market by market. Hence we have attempted a full granular breakdown of global energy demand by end use here.
As simple rules of thumb, electricity generation absorbs almost 40% of primary energy, heat is 30%, transportation is almost 25%, and 10% is feedstocks for materials. However, some of the categories overlap. Materials and manufacturing absorb c35% of global primary energy to make 60GTpa of stuff, drawing upon electricity, heat and feedstocks.
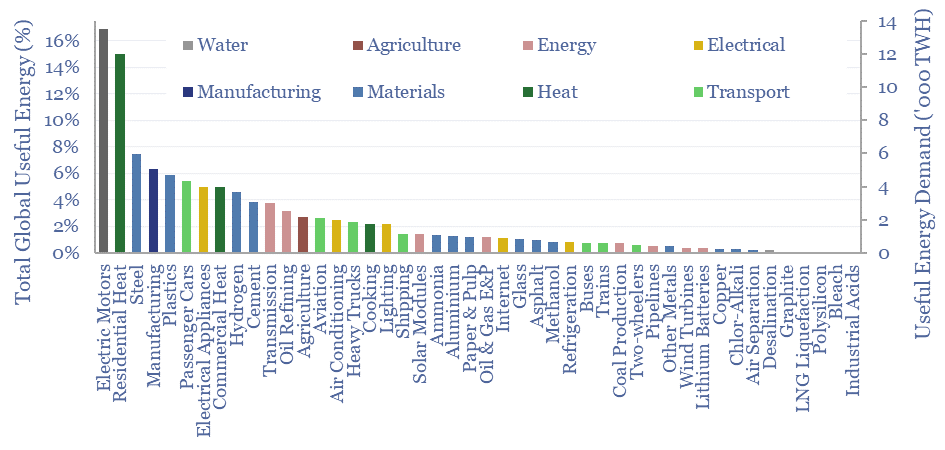
A breakdown of primary global energy demand by category is plotted below. The largest categories are electric motors (15%), passenger cars (13%), residential heat (10%), manufacturing processes (6%) and other electrical appliances (5%). Although note that this is also because these are some of the broadest categories in the data-file.
The database of global energy demand also allows us to quantify the most and least efficient value chains. For example, passenger cars comprise c13% of global primary energy in the chart above but only c5% of global useful energy, due to the relatively low efficiency in internal combustion engines. Conversely, residential heat is highly efficient, comprising c10% of primary energy above but 13% of useful energy.
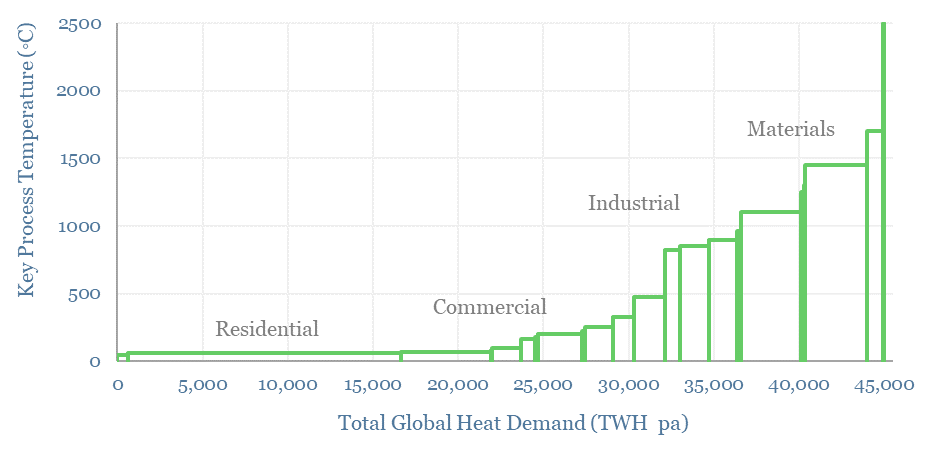
The breakdown of global energy demand by end use also allows us to disaggregate global heat, which comprises 30% of primary global energy. 50% is used residentially or commercially at temperatures below <100◦C. Conversely, at the other end of the spectrum, 20% is ultra-hot industrial heat >1,000◦C (chart below).
The full data-file includes estimates of global energy demand across almost fifty end uses: agriculture, air conditioning, air separation, aluminium, ammonia, asphalt, aviation, bleach, buses, cement, chlor-alkali, coal production, commercial heat, cooking, copper, desalination, electric motors, electrical appliances, glass, graphite, heavy trucks, hydrogen, industrial acids, internet, lighting, lithium batteries, LNG liquefaction, manufacturing, methanol, oil & gas E&P, oil refining, other metals, paper & pulp, passenger cars, pipelines, plastics, polysilicon, refrigeration, residential heat, shipping, solar modules, steel, trains, transmission, two-wheelers and wind turbines.