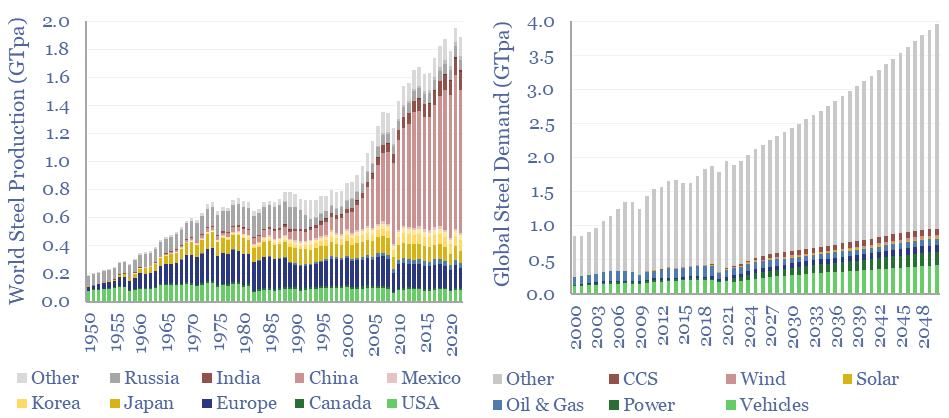
Global steel supply-demand runs at 2GTpa in 2023, having doubled since 2003. Our best estimate is that steel demand rises another 80%, to 3.6GTpa by 2050, including due to the energy transition. Global steel production by country is now dominated by China, whose output exceeds 1GTpa, which is 8x the #2 producer, India, at 125MTpa.
Global steel demand is running at 2GTpa in 2023, having doubled since 2003. Our best estimate is that steel demand will rise by another 80%, to 3.6GTpa by 2050, including due to the energy transition.
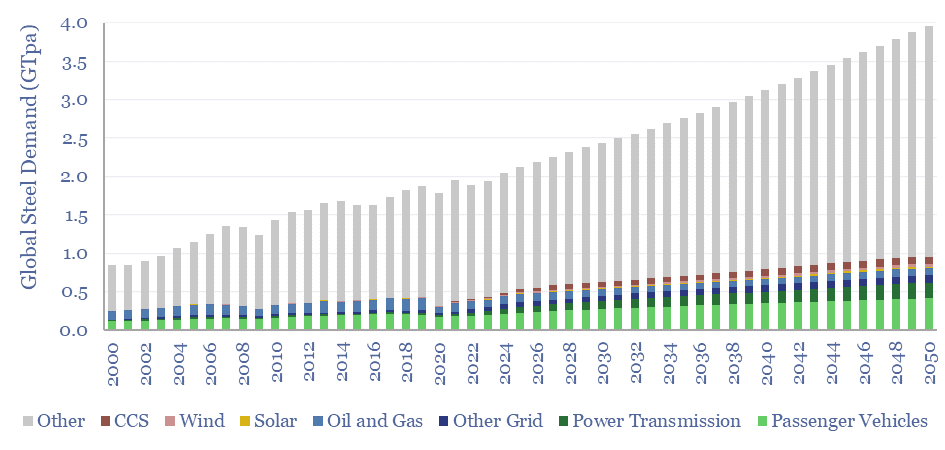
Specifically, passenger vehicles currently use 200MTpa of steel, which doubles to over 400MTpa, as energy transition requires a rapid build-out of electric vehicles alongside increasing turnover of the vehicle fleet. These numbers are based on breaking down the mass of vehicles and our forecasts for passenger vehicle volumes.
Other energy uses of steel currently consume around 250MTpa of steel, which we think will double to 500MTpa, across wind turbines, expanding power grids, and CCS infrastructure. These numbers are dominated by the expansion of the global power grid. And by building out renewables, primarily wind.
Another major trend in our analysis is shifting towards lighter-weight materials, especially to reduce the weight of passenger vehicles, displacing steel with aluminium, glass fiber, carbon fiber, mass timber, advanced polymers. Indeed, steel demand could exceed 4GTpa by 2050, if we were not assuming 2x growth in global plastics to 1GTpa.
Some humility is warranted when analyzing global steel markets in aggregate, overlooking the differences between 500 different products/grades, made via three different pathways (blast furnace, DRI, EAF), and for which there are c80 different decarbonization options currently swirling. We use a regression to GDP to estimate ‘other demand’ in our model, which can be flexed in the model.
On the other hand, global steel supply reads like something out of a George Orwell novel. Back in 1950, when Nineteen Eighty-Four was first published, there really were three world super-powers — the US, the Soviet Union and Europe — producing over 90% of the world’s steel. Really the chart below shows the history of the world post World War II.
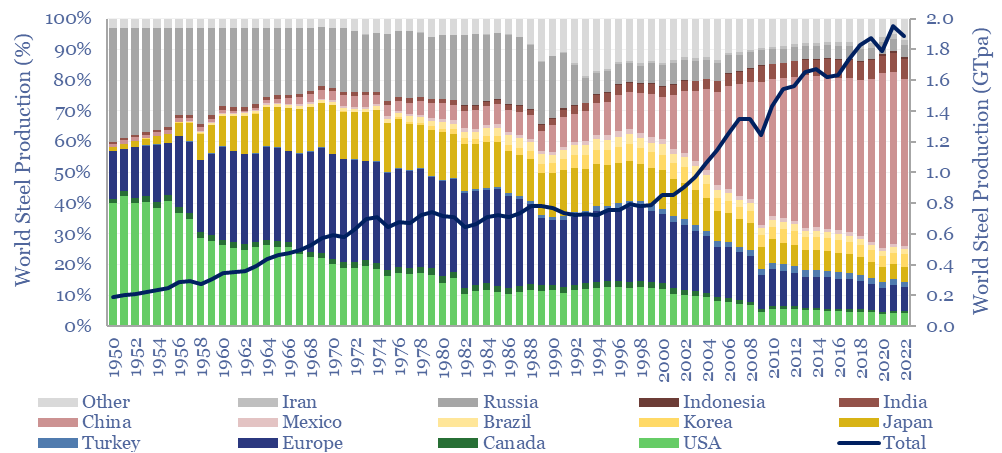
Since 1950, the US has declined from 40% of the world’s steel to 4%. Europe has declined from 35% to 7%. Meanwhile China now produces over 1GTpa of steel, more than half of the global total, an order of magnitude more than the world’s #2 producer (India, 125MTpa) and #3 producer (Japan, 90MTpa).
Geopolitics matters in the energy transition, and we cannot help feeling that the world is careening towards a strange dichotomy between carbon-abolitionist nations and carbon-emitting industrial titans, somehow strangely reminiscent of the United States in the 1840s and 1850s.