Average home sizes matter for overall residential energy demand, heating and cooling demand. Hence the purpose of this data-file is to aggregate average home sizes by country, then translate the data into living space per capita. A good rule of thumb is that each $1k pp pa of GDP translates one-for-one into 1m2 pp pa of useful living space. The trend towards ever larger homes challenges the notion of peak energy demand?
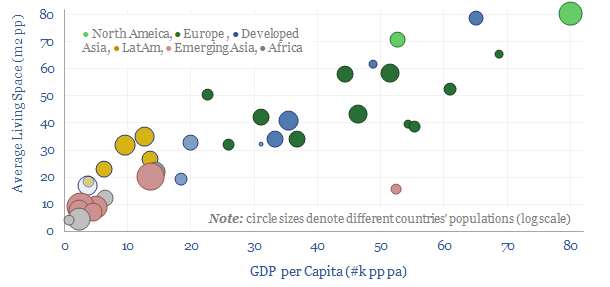
On a global average basis, the average home is 70m2 in size and shared between 3.5 inhabitants, which equates to an average of 20m2 of living space per capita.
There is a direct linear relationship between income per capita and living space per capita. A good rule of thumb is that each $1k of GDP per capita equates to 1m2 per capita of living space.
In wealthy countries, the average home is 130-200m2 in size, shared between 2-2.5 people, for an average of 60-80m2 of living space per person, which is 3x the global average. This is large, but still not that large. A mansion is 800m2 and above. The largest houses in the US are catalogued here. And the largest house in the world, belonging to the Sultan of Brunei, is 200,000m2.
In the least wealthy countries, the average home is 20-40m2 in size, shared between 3-5 people, and thus living space per capita is 5-10m2, 50-75% below the global average. This is staggeringly low. For example, a recent press article highlighted that the average living space per capita in a dwelling in India is “less than the recommended size of a prison cell”.
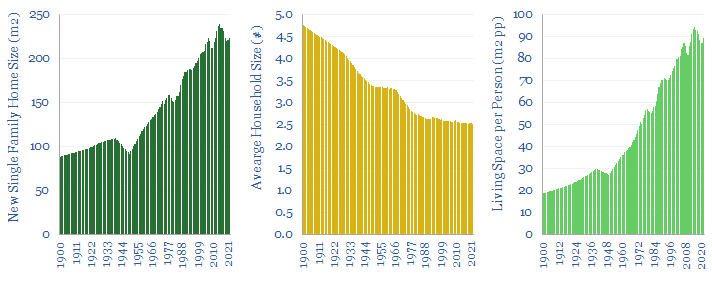
Average home sizes have been increasing in substantively every country we surveyed. For example, the average new single-family home being built in the United States in 2022 is 223 m2, up 45% since 1980, up 2.5x since 1900. Household sizes have fallen from 4.8 people in 1900 to 2.5 people in 2022. Hence overall, total living space per American in these newly built homes has risen by 60% since 1980 and 5x since 1900 (charts below).
In my adopted homeland of Estonia, I have also seen my fair share of boxy 30-40m2 concrete monstrosities, dating back to the fifty year period of Soviet occupation. No one really wants to live in them. The average size of a new dwelling constructed in 2023 has jumped to 83 square meters.
Urbanization patterns are another driver of average home sizes. A typical urban apartment is about half the size of a typical ‘house’. However another demographic trend is that wealthier urbanites tend to move out of apartments and ‘out into the suburbs’ which also adds energy demand in the form of commuting.
Overall we think that rising home sizes are another example of a rebound effect severely challenging the idea of ‘peak energy demand’. Improved living standards, building materials, efficiency, insulation, heating and cooling, will almost invariably result in people choosing to live in larger houses, which in turn consume more energy.
The data in this file are the best aggregation we could find from technical papers, national records, internet searches, and data-based triangulation. As far as we are aware, there is no aggregated source of home sizes released by global statistical agencies.
Countries covered in the data-file include Argentina, Australia, Bangladesh, Bolivia, Brazil, Canada, China, Colombia, Congo, Denmark, Egypt, Estonia, Finland, France, Germany, Greece, Hong Kong, India, Indonesia, Italy, Japan, Korea, Mexico, Netherlands, New Zealand, Nigeria, Norway, Poland, Portugal, Romania, Russia, South Africa, Spain, Sweden, the United Kingdom, the United States and Vietnam.