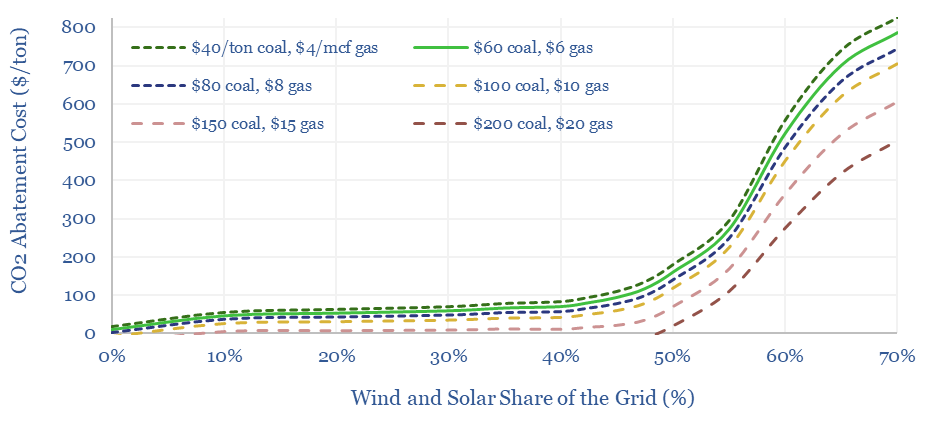
The costs of decarbonizing by ramping up solar and wind depend heavily on the context. But our best estimate is that solar and wind can reach 40% of the global grid for a $60/ton average CO2 abatement cost. This is a relatively low cost. Yet it still raises retail electricity prices from 10c/kWh to 12c/kWh. This 7-page note explores numbers and implications in the decarbonization costs of wind and solar.
The costs of wind and solar are commonly expressed in c/kWh or $/MWH terms, including in our own models of onshore wind economics, offshore wind economics and solar project economics. But what are the decarbonization costs, i.e., the costs per ton of CO2 avoided?
The answer depends on context. Obviating the need to construct a new coal-fired power plant (negative CO2 abatement cost) yields a very different answer from causing a fully depreciated nuclear plant to shut down prematurely (infinite CO2 abatement cost!).
However this report contains our best estimates for the decarbonization costs of wind and solar, across the global average grid, in order to inform our roadmap to net zero. After five years looking at this question, there is really only one way to model it correctly, which requires looking at total system costs.
Specifically, it is necessary to calculate how the total cost of the grid increases/decreases (in c/kWh terms) and then divide this by how the total CO2 intensity of the grid decreases (in kg/kWh), then finally, re-arrange the units. Our own assumptions are below.
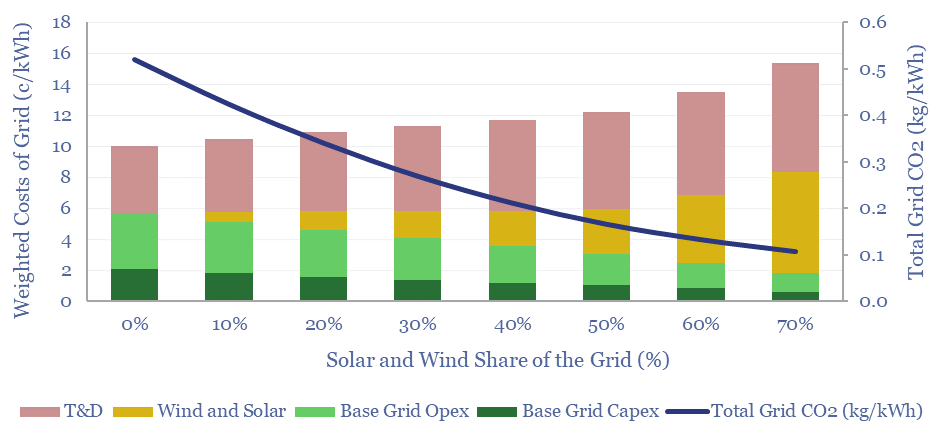
Many interesting mix effects are explained in the note, as renewables gain share, such as falling grid utilization, rising curtailment rates and the concomitant rise in total grid costs.
CO2 abatement costs can be negative for ramping the best 10% of renewables in the global power grid, average $60/ton of CO2 avoided as renewables grow from 10% to 40% of the grid, then inflect sharply higher. There are two main reasons for the inflection.
The conclusions reward solar/wind developers who pick the best locations/contexts. For those looking to stress-test their own scenarios, the underlying model is here. But our own base case assumptions and observations are explained in the PDF report.