This data-file evaluates transmission and distribution costs, averaging 7c/kWh in 2024, based on granular disclosures for 200 regulated US electric utilities, which sell 65% of the US’s total electricity to 110M residential and commercial customers. Costs have doubled since 2005. Which utilities have rising rate bases and efficiently low opex?
Regulated electrical utilities in the US are required to submit their capex, opex and SG&A costs to FERC via Form 1 filings. The data are used to determine acceptable utility charges, and also made freely available to the public, after a lag.
Costs of transmission and distribution utilities have doubled in the past 20-years, even in real terms, from 3.5 c/kWh in 2004-05 to 7c/kWh in 2024. Rising costs would seem to incentivize self-generating, especially amidst grid bottlenecks?
The largest reason for rising costs is rising transmission and distribution capex to accomodate renewables, trebling from 1c/kWh to 3c/kWh. Our numbers actually understate the costs charged to consumers, which will also include a statutory return on prior period capex, in addition to the direct costs that are tabulated in the file. This underscores a conclusion in our recent research: while renewables are a good, low-cost way of decarbonizing, they do add costs on a total system basis.
Over the past ten years, we estimate that 50% of utilities’ direct costs are capex and 50% are opex. The capex is 50% distribution, 35% transmission and 15% plant. The opex is 60% customer G&A, 25% T&D opex and c15% T&D maintenance.
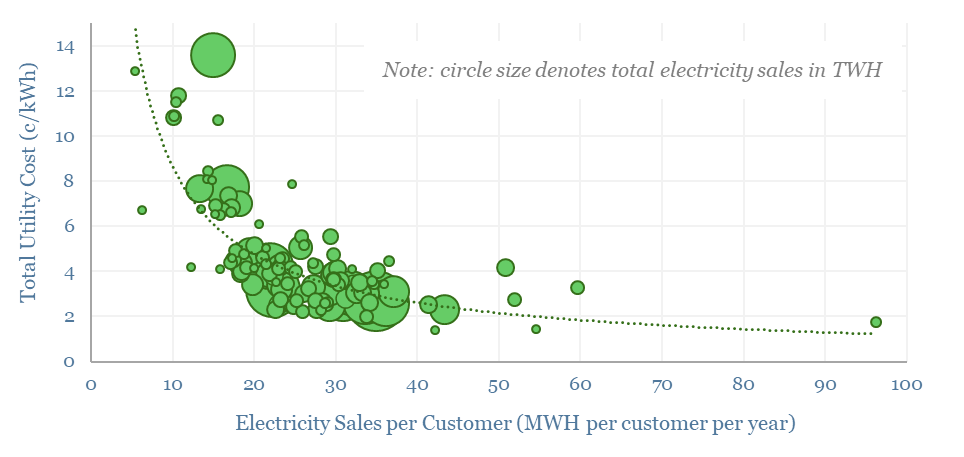
Costs are -60% correlated with average power sales per customer, or in other words, customer type. Across the US, the average residential household uses 10MWH pa, the average commercial business uses 70MWH and the average industrial facility uses 2GWH. Costs approximately halve when average power use per customer doubles.
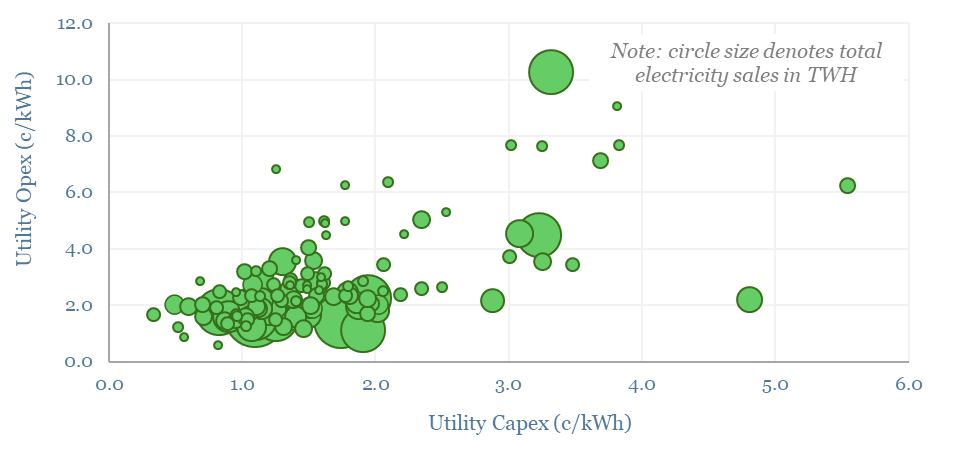
The largest US utilities, with 2-5M customers each and 80-120 TWH pa of electricity sales include PG&E, SCE, FPL, Oncor, ConEd, ComEd, Duke, Centerpoint, DTE. Capex costs range from 0.5-5 c/kWh and opex costs range from 1-10 c/kWh.
The ideal mix is high capex and low opex, as this indicates a well-run utility with a rising rate base and thus rising earnings potential? PSEG, SCE, ConEd, FPL perhaps stand out most on these metrics.
Regulated utilities are not really meant to have pricing power. But bottlenecks are biting, and we do wonder whether value inevitably trickles back to infrastructure owners and operators, in power grids and especially in gas pipelines.
The key drawback to the data that are tabulated in this file is their recency. FERC has released data from 1994-2019 in Excel format, utility by utility. The FERC website has data through 1H21 in dbf format. We will update this data-file if and when further data are made available by FERC.