This database breaks reasons for travel (especially long-distance travel, on journeys with a distance greater than 100-miles) by purpose, by transportation type and by distance category, for the average person in the US, and in aggregate.
The Excel file is based on over 1.2GB of raw data, collected by the US FHWA and US DOT in 2007-11, which is still widely cited around the Academic literature and thus relevant to assessing the post-COVID landscape. We have cleaned up the data.
The data show the full breakdown of reasons for travel by plane, car, bus and train; for business, leisure activities and commuting; from 100-miles to 4,000-miles; how these different factors co-vary; and how they have changed between 2010 and 2017.
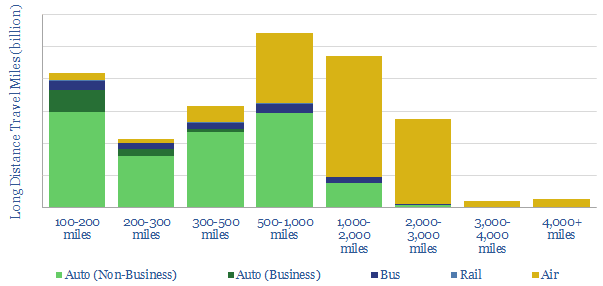
The chart below illustrates the headline data, aggregating all modes of transport by purpose and travel distance. Alternate versions of the chart are available for just planes, automobiles, buses and trains.
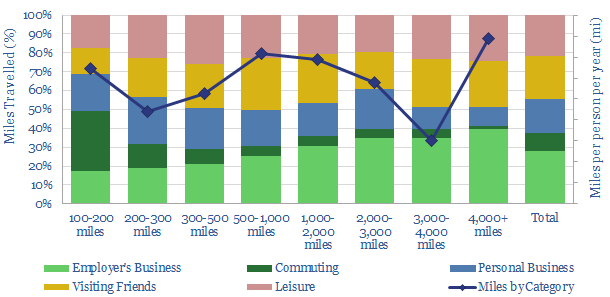
Travel by purpose, 28% of long-distsance trips are for employers’ business, 10% are commuting, 18% are personal business and 45% are for leisure or friends. The splits vary over time and by transport type. This breakdown suggests strong decarbonization potential from digital meeting technologies and remote working.
Travel by vehicle. Autos are c95% of <500-mile trips. Planes are c90% of >1,000-mile trips. But the 500-1,000 mile category is competitive: planes rose from c40% in 2008 to 75% share in 2017. We find that driving can be 50% lower-cabon than flying, especially when plane load factors are low (data here).