This data-file contains the output from some enormous data-pulls, evaluating UK grid power generation by source, its volatility, and the relationship to hourly traded power prices. We conclude the grid is growing more expensive and volatile, with the increasing share of wind.
This data-file tracks the mix of power generation sources in the UK grid, month by month, going back to 2016. In the trailing twelve months ended June-2025, the UK power grid was 32% natural gas, 27% wind, 17% nuclear, 13% imports, 11% biomass and ‘other’, and <1% coal.
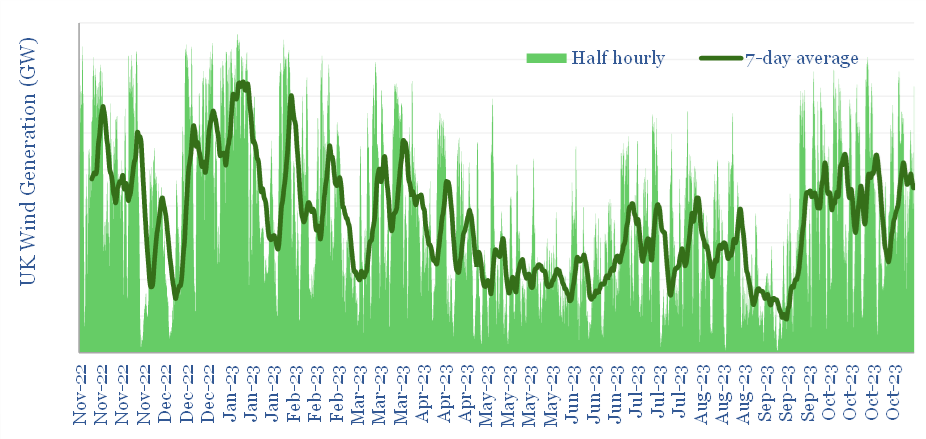
Wind. The biggest change is the ramp up of wind, which has grown from 8% of the grid in 2016 to 27% in the trailing twelve months (chart below). However, the output of wind is volatile. 11% of the time, wind is supplying over 50% of the total UK grid, and 13% of the time it is generating less than 10% of the UK grid.

Different durations of wind volatility can be seen in the data-file, from half-hour-by-half-hour, to day-to-day, to season-to-season. The latter is particularly challenging for energy storage economics, as wind in the UK tends to generate 2x more electricity in the peak month of February versus the trough in July.
Natural gas power backs up wind today, as shown in the fascinating chart below. Gas has always been a flexible supply source. And the total share of gas has remained relatively constant at 30-40%. But look how the volatility profile has changed! In 2016, gas was supplying 30-50% of the grid 65% of the time, and was outside this range just 35% of the time. Conversely, by 2025, gas is supplying >50% of the grid or <20% of the grid 50% of the time, and only providing 30-50% of the grid 30% of the time.

Nuclear power is less flexible but has also been scaled back as more volatile generation has scaled up. For the first time in many years, in 2024-25, nuclear was generation less than 20% of the UK grid for about two-thirds of the time.

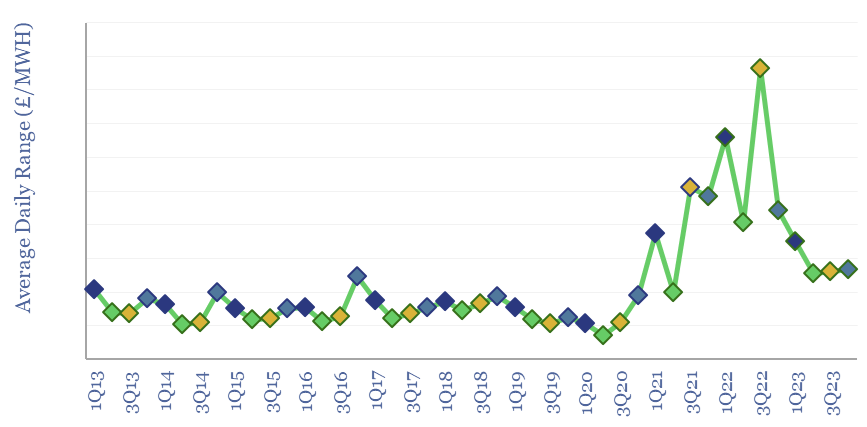
Power prices are therefore becoming more volatile, reflecting the increasing volatility of the generation mix. For example, the chart below shows the average daily ‘range’ between the highest and lowest intra-day power prices, from 2013-2023. The numbers are shown in the data-file in £/MWH and c/kWh terms. This determines the spreads that are theoretically available to providers of energy storage or to companies that can flex demand. We have found a better way to measure power price volatility more recently, which is shown in the second download linked below.
Underlying data in these data-files are sourced from Elexon, however this data-file includes the output from running description statistics on literally hundreds of MB of half-hourly input data. We are simply summarizing the output here in a way that we hope is a useful reference.