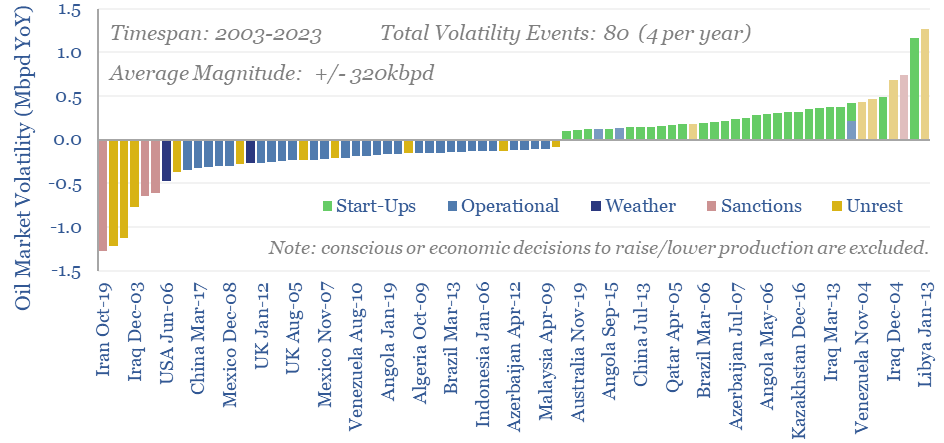
Oil markets endure 4 major volatility events per year, with a magnitude of +/- 320kbpd, on average. Their net impact detracts -100kbpd per year. OPEC and shale have historically buffered out oil market volatility, so annual oil output is 70% less volatile than renewables’ output. This 10-page note explores the numbers and the changes that lie ahead?
Our outlook for 2024 is that global energy markets should balance, but this base case will likely be overwhelmed by unexpected volatility (page 2).
An era of rising volatility is starting to grip global energy markets more broadly, due to mega-trends in the energy transition itself (page 3).
But haven’t oil markets always been volatile? And how volatile? To answer these questions, we have aggregated oil production by country by month. Then we have reviewed the data line-by-line, excluded conscious decisions to raise/lower production in response to prices (e.g., during COVID-2019), and tabulated 80 events where individual countries’ output varied by +/- 100kbpd YoY, on a trailing twelve month basis. Our methodology is explained on pages 4-5.
Upside volatility versus downside volatility? The statistical distribution of oil market volatility is quantified on pages 6-7. Disruptions can occur, but they can also reverse.
Oil market volatility versus oil market surprises? Large new field start-ups do create statistical volatility in individual countries’ oil output. But not in a way that is entirely unexpected. The prevalence of oil market surprises is quantified on page 8.
Counteracting volatility? Core members of OPEC and US shale have very clearly acted to counteract oil market volatility over the past 15-20 years. On pages 9-10, we wonder whether this buffering role will continue in the future, especially as US shale growth slows?
Ultimately, volatility benefits those with flexibility: from upstream producers, to midstream companies, to flexible energy consumers.