This data-file is a screen of the world’s largest copper companies, across c15 miners and producers that produce half of the global market, averaging 0.9MTpa each, deriving 45% of their EBITDA from copper, at 35% EBITDA margins, with a reserve life of 29-years. Summary details are given for each copper company, and their recent AI initiatives, in the data-file.
We have tabulated 15 copper companies’ size, type, headcount, patent count, production, reserves, RP ratio, relative exposure, key assets and other notes in this data-file.
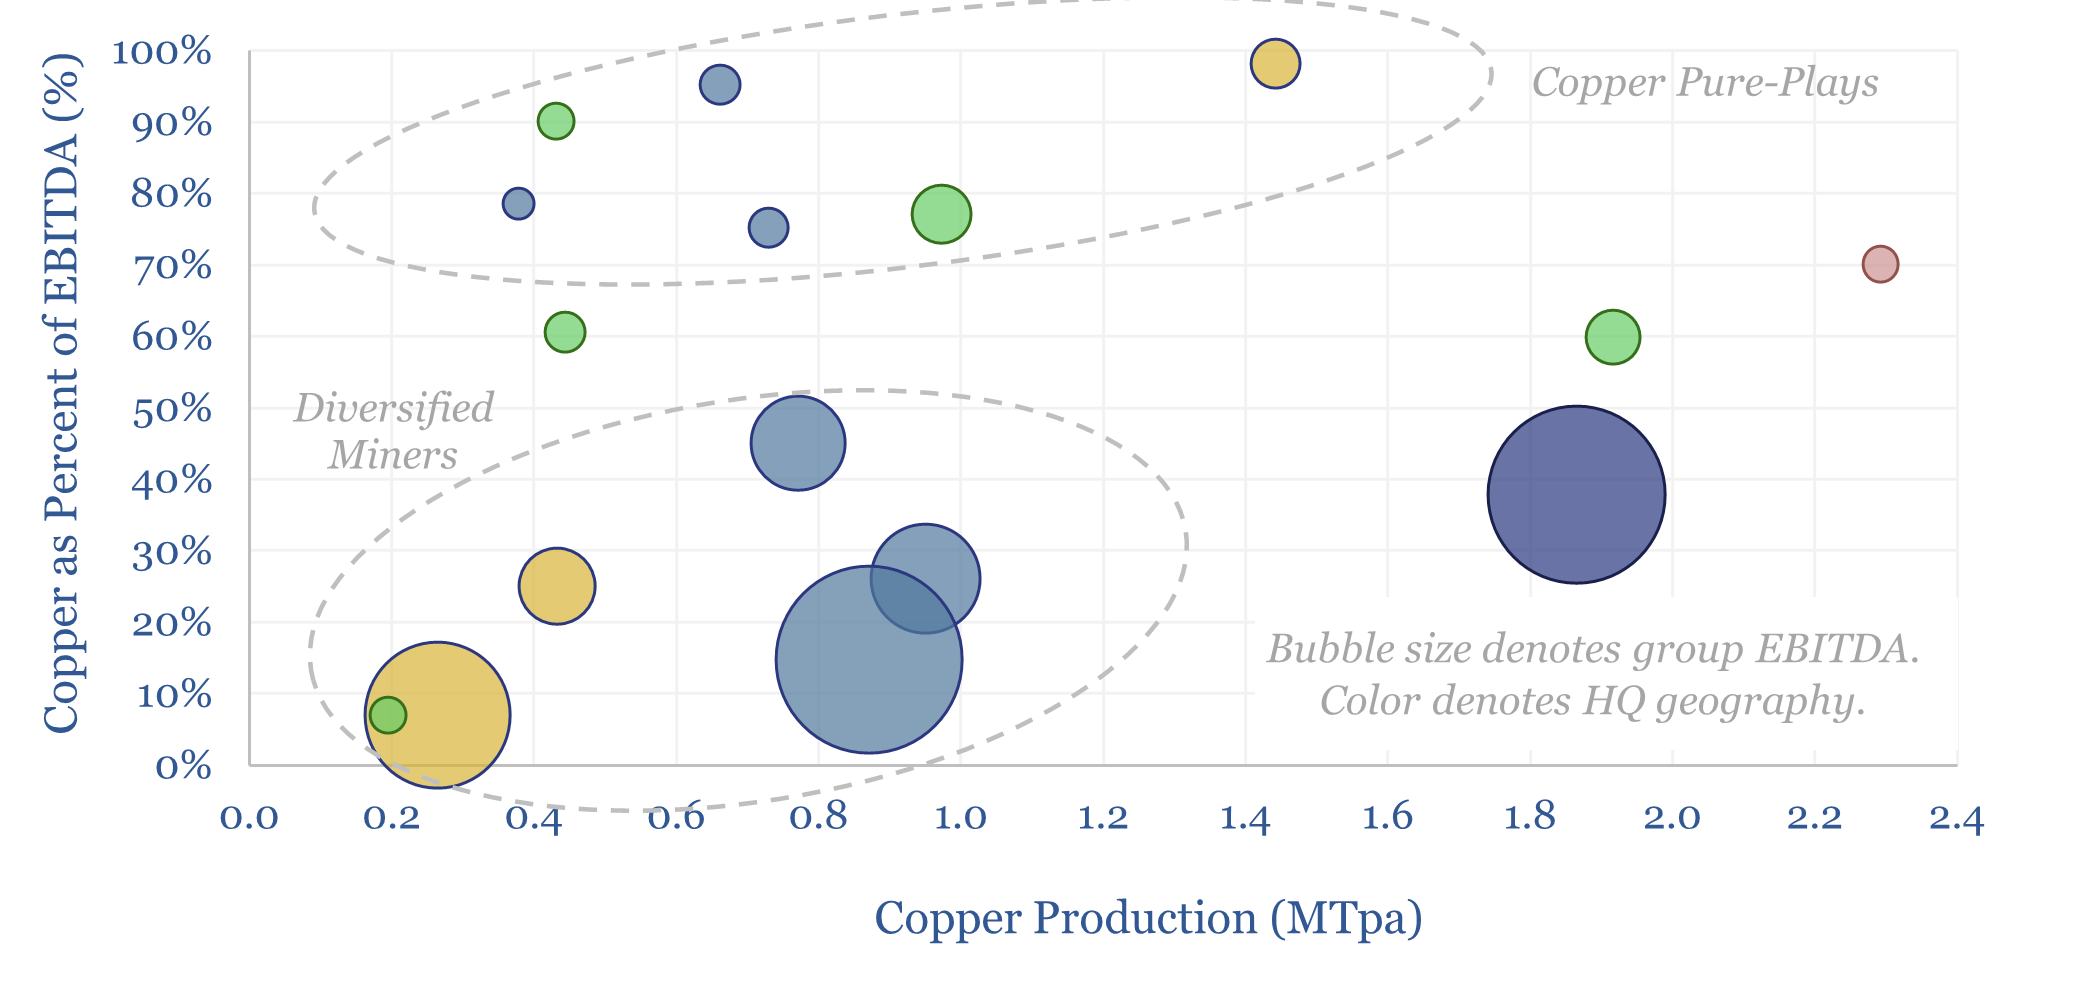
These 15 leading companies produce half of the world’s primary copper, and generated $65bn of copper EBITDA in 2025, at an average margin of $4.4k/kg. But do the data in our screen point to tightening markets and/or a steepening global cost curve for copper?
The average company produces around 0.9MTpa of copper, has a 29-year reserve life, and derives 45% of its EBITDA from copper.
Global copper demand rises from 33MTpa in 2023 to 44MTpa by 2030, due to electrification, solar, EVs and the rise of AI.
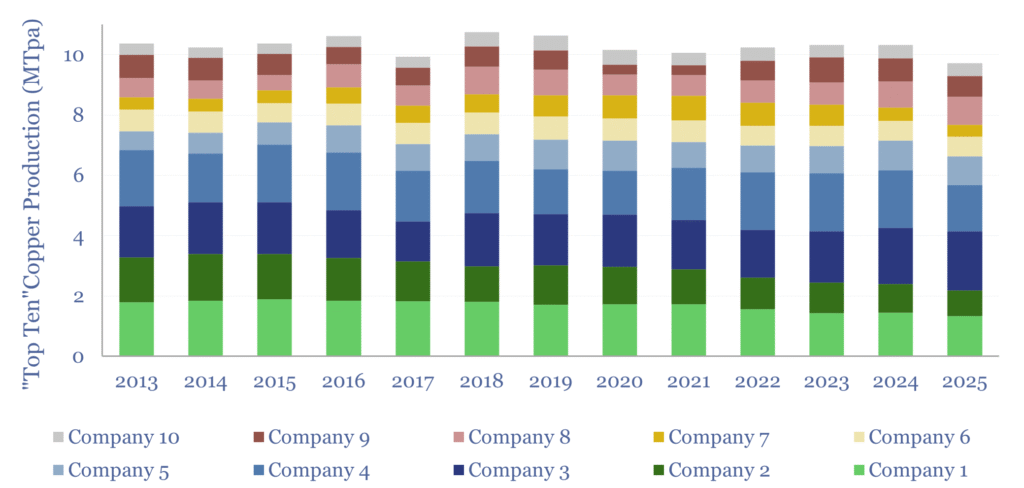
However, capital discipline and the impacts of declining ore grades over the past decade are shown in the chart below. Output from the top ten largest copper producers has trended sideways.
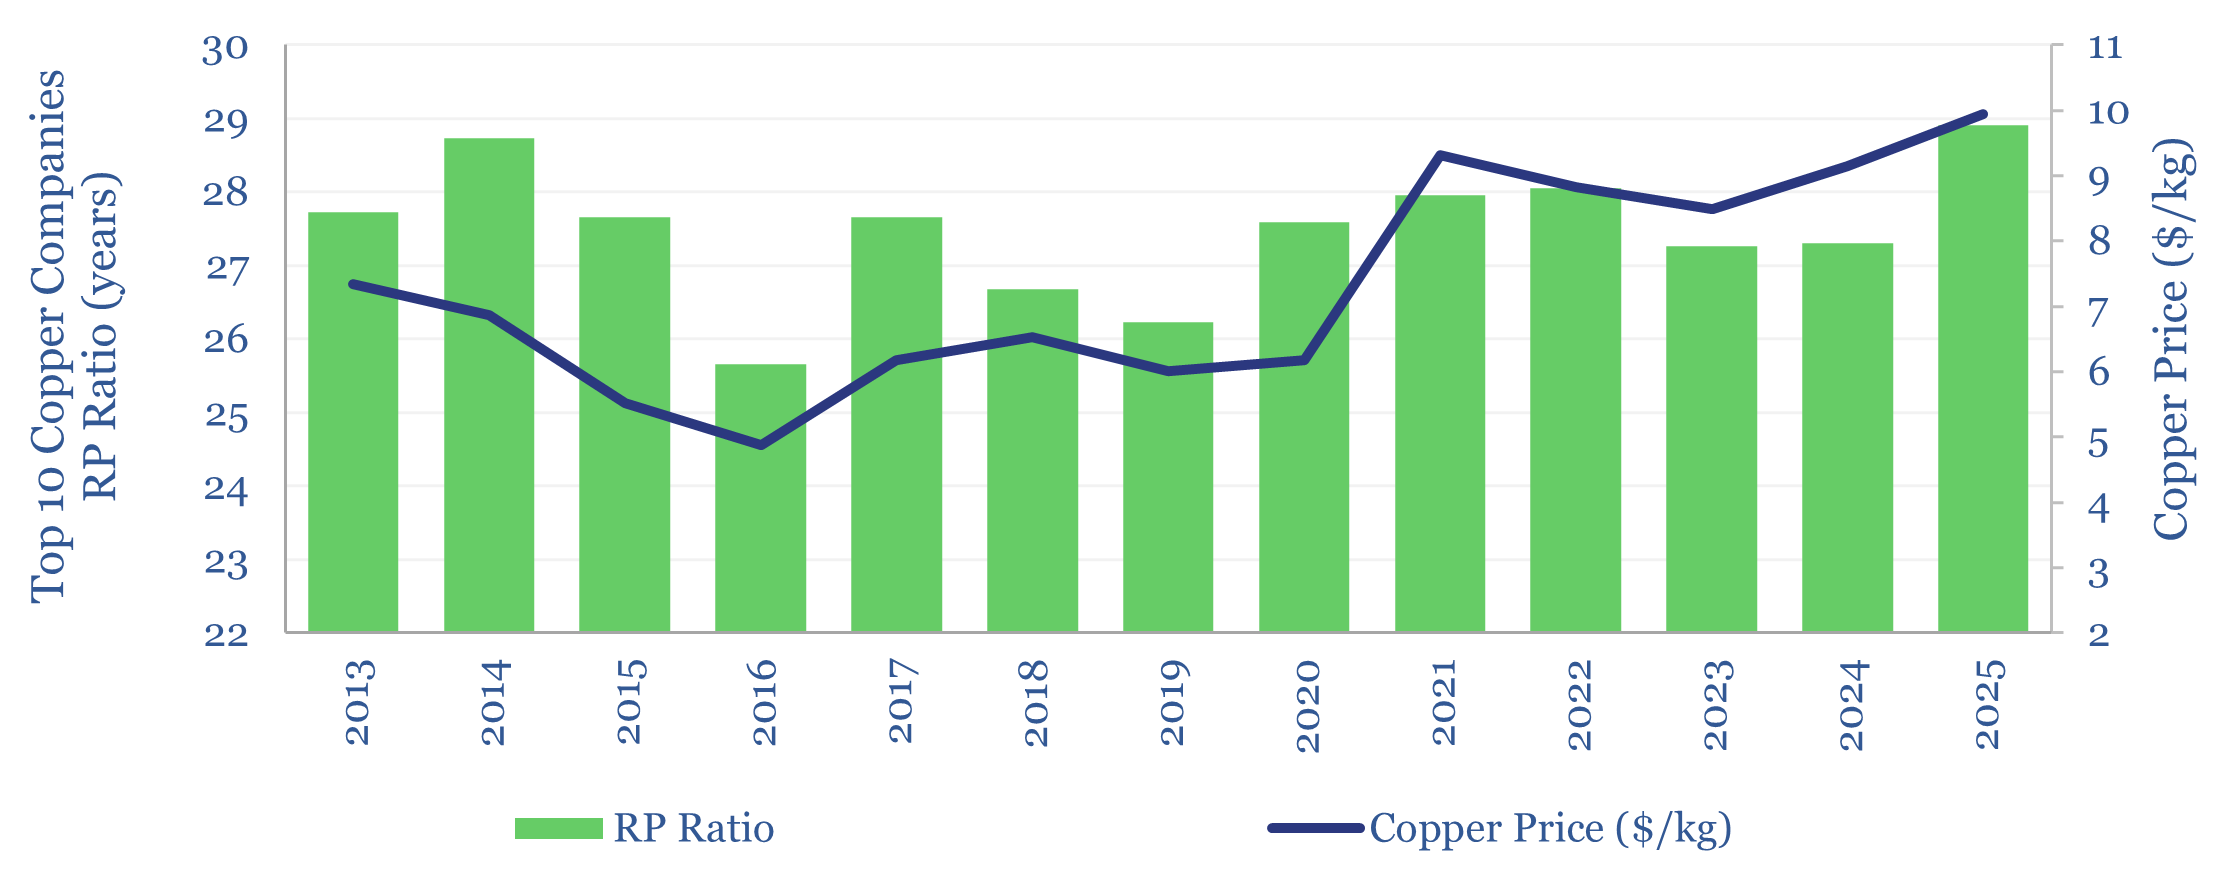
RP ratios for the ten largest companies in the peer group have run flat at 28 years from 2013-14 to 27.5 years in 2023-2024, even as global average copper prices rose 20% to $9/kg (below). In 2025, RP ratios increased to 29 years, but this was due to decreases in production, not new reserves found.
Average production costs across the group also increased by c30%, from $3/kg in 2019 to $3.8/kg in 2025. Labor productivity is a murkier metric but seems to have fallen by 20% since 2019. Further cost details are available in our economic model of copper production.
AI and machine learning deployments have stepped up, especially in 2024. Freeport McMoran stated, “You know, all of us in the copper sector are seeing decreases in head grades, right? That means we’re going to have to get more efficient, and so it’s really pushing the question on technology and what can technology do”. Examples of AI initiatives are highlighted in yellow for each company in the screen. We think this will steepen the global cost curve.
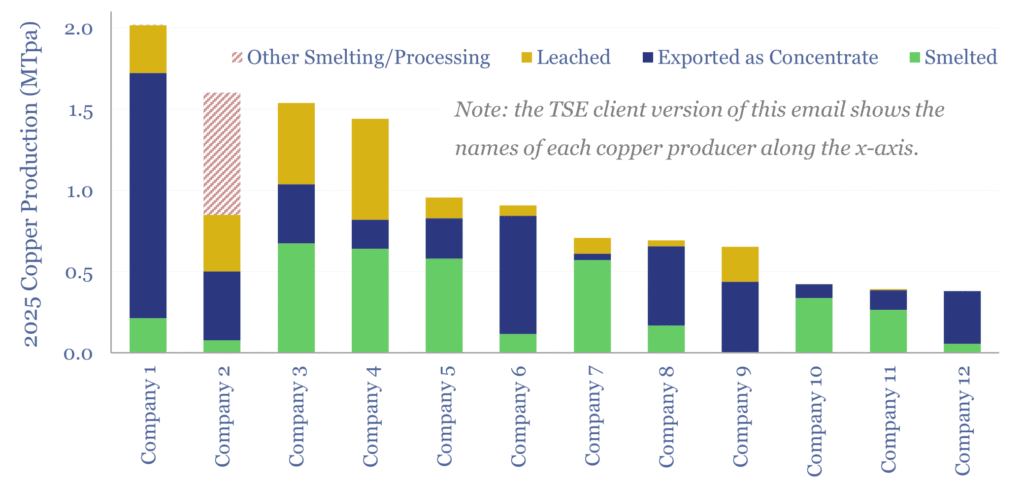
Our 2026 update of this data-file also estimates the relative exposure to heap-leaching, smelting and exporting of concentrates, by producer, which matters due to the disruption of sulfur flows from the Strait of Hormuz.
15 companies are covered overall in our screen of copper producers, including diversified miners such as Glencore, BHP, Rio Tinto and Anglo American; and more concentrated specialists such as Codelco, Freeport McMoRan, Southern Copper, Antofagasta. Generally, the data do seem to imply that a copper capex cycle is gearing up, and a steepening cost curve for copper.