Chinese coal provides 15% of the world’s energy, equivalent to 4 Saudi Arabia’s worth of oil. Global energy markets may become 10% under-supplied if this output plateaus per our ‘net zero’ scenario. Alternatively, might China ramp its coal to cure energy shortages, especially as Europe bids harder for renewables and LNG post-Russia? Today’s note presents our ‘top ten’ charts on China’s opaque coal industry.
China’s coal industry provides 15% of the world’s energy and c22% of its CO2 emissions. These numbers are placed in context on page 2.
China’s coal production policies will sway global energy balances. Key numbers, and their impacts on global energy supply-demand, are laid out on page 3.
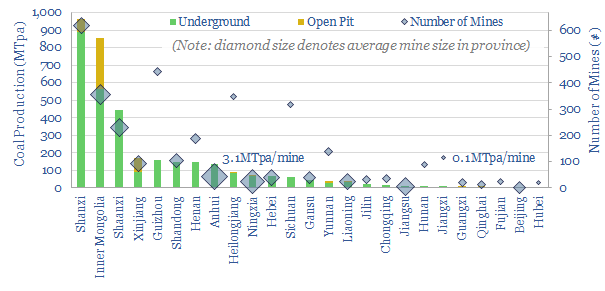
China’s coal mines are a constellation of c4,000 assets. Some useful rules of thumb are given on the breakdown on page 4.
China’s coal demand is bridged on page 5, including the share of demands for power, industrial heat, residential/commercial heat and coking.
Coal prices are contextualized on page 6-7, comparing Chinese coal with gas, renewables, hydro and nuclear in c/kWh terms.
Coal costs are calculated on page 6-8. We model what price is needed for China to maintain flat-slightly growing output, while earning double-digit returns on investment.
Accelerating Chinese coal depends on policies, however, especially around a tail of smaller and higher cost mines. The skew and implications are explored on page 7-8.
China’s decarbonization is clearly linked to its coal output. We see decarbonization ambitions being thwarted in the 2020s, per page 8.
Methane leaks from China’s coal industry may actually be higher than methane leaks from the West’s gas industry (page 9).
Chinese coal companies are profiled, and compared with Western companies, on pages 10-11.
For an outlook on global coal production, please see our article here.