This note evaluates how sustained gas shortages could re-shape power markets (chart above). Nuclear is the greatest beneficiary, as its cost premium narrows. The balance also includes more renewables, batteries and power-electronics; and less gas, until gas prices normalized. Self-defeatingly, we would also expect less short-term decarbonization via coal-to-gas switching.
Across our research we have modelled over 150 different technologies which can help the world on its pathway towards net zero. Naturally this includes power generation sources such as wind, solar, gas turbines, CHPs, coal, hydro, nuclear and hydrogen fuel cells.
The lowest-cost ‘net zero power grids‘, we argue, most likely comprise a mixture of 25-50% renewables, backstopped with the most efficient and low-carbon natural gas power. There will inevitably some CO2 emissions associated with the gas production, but we think this can be entirely offset with nature-based CO2 removals, for a cost below $50/ton. The model is explored in the note below.
The reason for this balance is that renewables start out as the lowest cost power source. Until they hit 25-50% of the total grid. This is because wind and solar generation auto-correlates over very wide areas (charts below). Hence at a certain point, any incremental renewables that you build will be trying to feed into the grid at a point when the grid is already saturated with renewables, and these incremental renewables will be curtailed.
You could build more renewables into these grids, but the costs would escalate rapidly, because of curtailment, because of the costs of batteries, and because of the complicated power-electronics that must be installed downstream to compensate for renewables’ inherent lack of inertia, reactive power and fault current (notes below).
A final issue with wind and solar is that they may see some inflation in their future costs. Although they are very low carbon, their costs are partly determined by the cost of input materials, many of which are energy intensive and themselves need to be decarbonized. For example, PV silicon, carbon fiber, other metals (see below). This is why higher gas/energy prices or higher CO2 prices mechanically translate into mild re-inflation for wind and solar in our analysis.
However, what has prompted the analysis in this short note is that we are confronting the possibility of materially higher gas prices in the next 2-5 years, due to sustained gas shortages. If fears over the energy transition have elevated capital costs in the gas industry to 15-20%, then we think international gas prices may need to run at $12-16/mcf, in order to attract sufficient investment to re-balance future gas markets (note below).
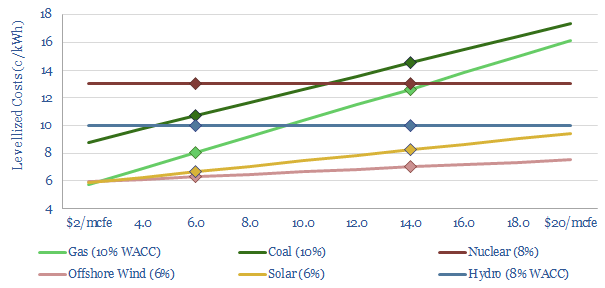
Higher gas prices clearly are going to translate into higher prices for gas-fired power. As a rule of thumb, each mcf of gas contains 304kWh of chemical energy. When combusted in an efficiency power generator, around 175kWh of electricity will be generated. Thus each $1/mcf increase in the gas price increases the marginal cost of gas-power by 0.6c/kWh.
In our chart below, we are also assuming that coal prices off of gas (i.e., the coal industry charges whatever it needs to charge, in order to incentivize the marginal consumer not to switch off its coal plant and switch to burning gas instead). So the levellized cost of coal power is also going to rise with gas prices. Finally, to be clear, we are assuming a $50/ton CO2 price, apples to apples, across the board in the analysis below.
So what changes if we were to have several years of gas prices in the range of $12-16/mcf, rather than $6-8/mcf as we have previously hoped for?
The first re-alignment is the relative balance between renewables and gas, in an optimized mix. Clearly if the baseline price gap between gas and renewables widens from 2c/kWh previously to 6c/kWh, then more renewables can be built before the cumulative costs of curtailments, backups and power-electronics upgrades sway the calculus. This might be good news for manufacturers of renewable assets, their underlying components, and power-electronics companies (some examples are profiled below). However, it is not necessarily great news for consumers, fore-suffering higher energy prices.
The other clear shift in the cost curve of power options would be bringing nuclear firmly into the money. In the past, our constructive outlook on the nuclear industry has hinged almost entirely on China (note below), where new nuclear facilities are constructed for c$3,000/kW. In the West (and in our model above), capex costs have been closer to $6,500/kW. And we have actually been assuming that Europe would phase back 15% of its nuclear capacity by 2025.
No longer. The easiest and most politically palatable way to address 2-4 years of gas shortages would be to cancel the nuclear phase backs. But moreover, at $14/mcf gas and $50/ton CO2 prices, there is effectively no economic difference between building new gas generators and new $6,500/kW nuclear plants. You probably want a mixture of both for diversification. And all the better if you can build the nuclear plants for less, for example, using some of the interesting next-generation nuclear concepts and SMRs under development.
Overall, our conclusion is that a period of sustainedly high gas prices would be most constructive for incumbent gas producers, who effectively print money until the world can be incentivized to quench painfully under-supplied gas markets. But longer term, upside is created for the nuclear, renewables and power-electronics industries. The data behind our analysis are tabulated below, with underlying details drawn from our other models.